3. Node_export安装部署
首先我们要知道什么是Node_export?因为Prometheus本身不具备监控功能,我们要通过Prometheus收集数据,需要安装对应的export。如Node_export用于监控服务器状态,如cpu、内存、网络、磁盘等信息。
注意事项: node_exporter服务需要在两台机器都安装,这里我们以客户端(192.168.229.138)为例
客户端
1.创建运行用户
[root@localhost opt]# groupadd -r prometheus

[root@localhost opt]# useradd -r -g prometheus -d / -s /sbin/nologin -c "prometheus user" prometheus
2.下载安装
[root@localhost opt]# wget https://github.com/prometheus/node_exporter/releases/download/v0.18.1/node_exporter-0.18.1.linux-amd64.tar.gz

[root@localhost opt]# tar -xf node_exporter-0.18.1.linux-amd64.tar.gz

[root@localhost opt]# cp node_exporter-0.18.1.linux-amd64/node_exporter /usr/local/bin/
3.配置启动脚本
[root@localhost opt]# vim /usr/lib/systemd/system/node_exporter.service

[Unit]

Description=node_export

Documentation=https://github.com/prometheus/node_exporter

After=network.target

[Service]

Type=simple

User=prometheus

ExecStart=/usr/local/bin/node_exporter

Restart=on-failure

[Install]

WantedBy=multi-user.target
4.启动
[root@localhost opt]# systemctl daemon-reload

[root@localhost opt]# systemctl enable node_exporter

Created symlink from /etc/systemd/system/multi-user.target.wants/node_exporter.service to /usr/lib/systemd/system/node_exporter.service.

[root@localhost opt]# systemctl start node_exporter
5.监听9100端口
[root@localhost opt]# netstat -anlptu|grep 9100

tcp        0      0 192.168.229.139:56874   192.168.229.138:9100    ESTABLISHED 8528/prometheus

tcp        0      0 192.168.229.139:40074   192.168.229.139:9100    ESTABLISHED 8528/prometheus

tcp6       0      0 :::9100                 :::*                    LISTEN      6064/node_exporter

tcp6       0      0 192.168.229.139:9100    192.168.229.139:40074   ESTABLISHED 6064/node_exporter
服务端
1.安装node_exporter,参考客户端安装
2. 修改prometheus.yml
[root@localhost opt]# vim /etc/prometheus/prometheus.yml

scrape_configs:

  # The job name is added as a label `job=<job_name>` to any timeseries scraped from this config.

  - job_name: 'prometheus'

    # metrics_path defaults to '/metrics'

    # scheme defaults to 'http'.

    static_configs:

    - targets: ['localhost:9090']

  - job_name: 'node'   ### 新增加job

    static_configs:

    - targets: ['192.168.229.139:9100','192.168.229.138:9100']  ### 主机列表
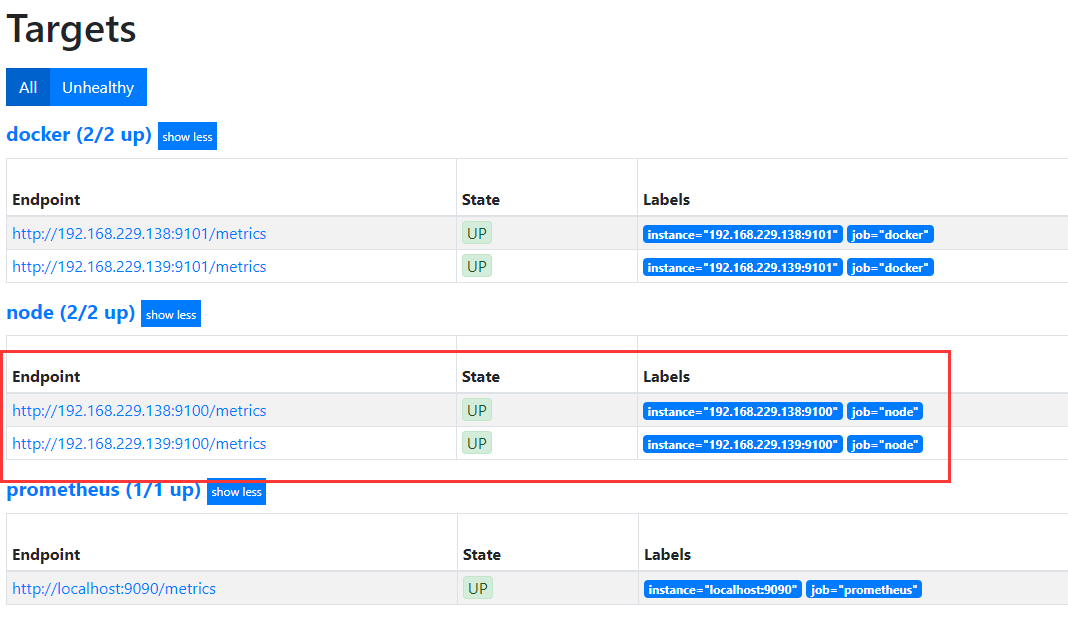
3.访问Prometheus Status > targets
4.收集系统CPU监控信息
4.1 CPU使用率
公式:100 - (avg by (instance) (irate(node_cpu_seconds_total{mode="idle"}[5m])) * 100)

4.2 CPU负载
公式:
1分钟负载:node_load1
5分钟负载:node_load5
15分钟负载:node_load15

5.收集系统内存监控信息
5.1 内存使用率
公式:(1 - (node_memory_MemAvailable_bytes / node_memory_MemTotal_bytes ))* 100
5.2 可用内存(单位:M)
公式:node_memory_MemAvailable_bytes / 1024 / 1024
6.收集系统磁盘监控信息
6.1 磁盘总大小(单位: G)
公式:node_filesystem_size_bytes {fstype=~"ext4|xfs"} / 1024 / 1024 / 1024
6.2 磁盘剩余大小(单位: G)
公式:node_filesystem_avail_bytes {fstype=~"ext4|xfs"} / 1024 / 1024 / 1024
6.3 磁盘使用率
公式:(1-(node_filesystem_free_bytes{fstype=~"ext4|xfs"} / node_filesystem_size_bytes{fstype=~"ext4|xfs"})) * 100
7.收集系统网络监控信息(ip add 查看网卡信息)
7.1 网卡入网流量 (指定某一个网卡)
公式:irate(node_network_receive_bytes_total{device='ens33'}[5m])
7.2 网卡出网流量(指定某一个网卡)
公式:irate(node_network_transmit_bytes_total{device='ens33'}[5m])
说明:以上收集系统各信息,都是通过node_exporter服务进行数据的收集,然后通过prometheus内置的PromQL语句进行组合查询,对于每一个公式,都可以在prometheus WEB界面测试查询。关于具体的PromQL语句以及公式中函数的使用参考:PromQL语句
欢迎关注微信公众号:软件测试汪。软件测试交流群:809111560
转载请注意出处,谢谢合作
3. Node_export安装部署的更多相关文章
- Prometheus入门到放弃(2)之Node_export安装部署
1.下载安装 node_exporter服务需要在三台机器都安装,这里我们以一台机器为例: 地址:https://prometheus.io/download/ ### 另外两个节点部署时,需要先创建 ...
- node_export 安装
目录 安装部署 环境准备 下载安装 启动测试 安装部署 环境准备 主机名 角色 IP 系统版本 内核版本 es01.k8s.com node01 10.0.20.11 CentOS 7.5 5.1.4 ...
- Oracle安装部署,版本升级,应用补丁快速参考
一.Oracle安装部署 1.1 单机环境 1.2 Oracle RAC环境 1.3 Oracle DataGuard环境 1.4 主机双机 1.5 客户端部署 二.Oracle版本升级 2.1 单机 ...
- KVM安装部署
KVM安装部署 公司开始部署KVM,KVM的全称是kernel base virtual machine,对KVM虚拟化技术研究了一段时间, KVM是基于硬件的完全虚拟化,跟vmware.xen.hy ...
- Linux平台oracle 11g单实例 + ASM存储 安装部署 快速参考
操作环境:Citrix虚拟化环境中申请一个Linux6.4主机(模板)目标:创建单机11g + ASM存储 数据库 1. 主机准备 2. 创建ORACLE 用户和组成员 3. 创建以下目录并赋予对应权 ...
- 分布式文件系统 - FastDFS 在 CentOS 下配置安装部署
少啰嗦,直接装 看过上一篇分布式文件系统 - FastDFS 简单了解一下的朋友应该知道,本次安装是使用目前余庆老师开源的最新 V5.05 版本,是余庆老师放在 Github 上的,和目前你能在网络上 ...
- C# winform安装部署(转载)
c# winform 程序打包部署 核心总结: 1.建议在完成的要打包的项目外,另建解决方案建立安装部署项目(而不是在同一个解决方案内新建),在解决方案上右击-〉添加-〉现有项目-〉选择你要打包的项目 ...
- Ubuntu14.04 Django Mysql安装部署全过程
Ubuntu14.04 Django Mysql安装部署全过程 一.简要步骤.(阿里云Ubuntu14.04) Python安装 Django Mysql的安装与配置 记录一下我的部署过程,也方便 ...
- 比Ansible更吊的自动化运维工具,自动化统一安装部署_自动化部署udeploy 1.0
新增功能: 2015-03-11 除pass(备份与更新)与start(启动服务)外,实现一切自动化. 注:pass与start设为业务类,由于各类业务不同,所以无法实现自动化.同类业务除外,如更新的 ...
随机推荐
- centos清理缓存
释放网页缓存(To free pagecache): echo 1 > /proc/sys/vm/drop_caches 释放目录项和索引(To free dentries and inodes ...
- 使用SSH方式实现Git远程连接GitHub/gitlab
参照: https://blog.csdn.net/wuli_smbug/article/details/81480162
- JumpServer堡垒机安装笔记
厂商文档--一步一步安装CentOS(https://jumpserver.readthedocs.io/zh/master/setup_by_centos.html) 厂商文档--简单优化(http ...
- 小程序UI自动化(一):appium小程序自动化尝试
appium 进行 小程序自动化尝试: 由于工作中进行app自动化用的是appium,故首先尝试用appium进行小程序自动化,以美团小程序为例(python脚本实现) 一.配置基础信息 启动微信ap ...
- HP Loadrunner 12.53的下载与安装
HP Loadrunner 12.53的下载与安装 HP Loadrunner 12.53的下载:http://pan.baidu.com/s/1c23axHm HP Loadrunner 12. ...
- HBase最佳实践-读性能优化策略
任何系统都会有各种各样的问题,有些是系统本身设计问题,有些却是使用姿势问题.HBase也一样,在真实生产线上大家或多或少都会遇到很多问题,有些是HBase还需要完善的,有些是我们确实对它了解太少.总结 ...
- Codeforces 1114C(数论)
题面 传送门 分析 我们先考虑n!在10进制下有多少个0 由于10=2*5, 我们考虑n!的分解式中5的指数,答案显然等于\(\frac{n}{5}+\frac{n}{5^2}+\frac{n}{5^ ...
- 【学习总结】Python-3-算术运算符中的/和//
参考:菜鸟教程-Python3运算符 参考:菜鸟教程-Python3数字 算术运算符中的两种除法的区别: 一个斜杠/:正常的人类除法,两个int相除也保留小数 eg: 21/10 = 2.1 两个斜杠 ...
- 小程序中为什么使用var that=this
前言: 在小程序或者js开发中,经常需要使用var that = this;开始我以为是无用功,(原谅我的无知),后来从面向对象的角度一想就明白了,下面简单解释一下我自己的理解,欢迎指正批评. 代码示 ...
- redis出现MISCONF Redis is configured to save RDB snapshots...的错误
今天重启服务器在连接redis数据库时突然报错: MISCONF Redis is configured to save RDB snapshots, but it is currently not ...