
Flink监控:Monitoring Apache Flink Applications
This post originally appeared on the Apache Flink blog. It was reproduced here under the Apache License, Version 2.0.
This blog post provides an introduction to Apache Flink’s built-in monitoring and metrics system, that allows developers to effectively monitor their Flink jobs. Oftentimes, the task of picking the relevant metrics to monitor a Flink application can be overwhelming for a DevOps team that is just starting with stream processing and Apache Flink. Having worked with many organizations that deploy Flink at scale, I would like to share my experience and some best practice with the community.
With business-critical applications running on Apache Flink, performance monitoring becomes an increasingly important part of a successful production deployment. It ensures that any degradation or downtime is immediately identified and resolved as quickly as possible.
Monitoring goes hand-in-hand with observability, which is a prerequisite for troubleshooting and performance tuning. Nowadays, with the complexity of modern enterprise applications and the speed of delivery increasing, an engineering team must understand and have a complete overview of its applications’ status at any given point in time.
Flink’s Metrics System
The foundation for monitoring Flink jobs is its metrics system which consists of two components; Metrics and MetricsReporters.
Metrics
Flink comes with a comprehensive set of built-in metrics such as:
Used JVM Heap / NonHeap / Direct Memory (per Task-/JobManager)
Number of Job Restarts (per Job)
Number of Records Per Second (per Operator)
…
These metrics have different scopes and measure more general (e.g. JVM or operating system) as well as Flink-specific aspects.
As a user, you can and should add application-specific metrics to your functions. Typically these include counters for the number of invalid records or the number of records temporarily buffered in managed state. Besides counters, Flink offers additional metrics types like gauges and histograms. For instructions on how to register your own metrics with Flink’s metrics system please check out Flink’s documentation. In this blog post, we will focus on how to get the most out of Flink’s built-in metrics.
MetricsReporters
All metrics can be queried via Flink’s REST API. However, users can configure MetricsReporters to send the metrics to external systems. Apache Flink provides reporters to the most common monitoring tools out-of-the-box including JMX, Prometheus, Datadog, Graphite and InfluxDB. For information about how to configure a reporter check out Flink’s MetricsReporter documentation.
In the remaining part of this blog post, we will go over some of the most important metrics to monitor your Apache Flink application.
Monitoring General Health
The first thing you want to monitor is whether your job is actually in a RUNNING state. In addition, it pays off to monitor the number of restarts and the time since the last restart.
Generally speaking, successful checkpointing is a strong indicator of the general health of your application. For each checkpoint, checkpoint barriers need to flow through the whole topology of your Flink job and events and barriers cannot overtake each other. Therefore, a successful checkpoint shows that no channel is fully congested.
Key Metrics
|
Metric |
Scope |
Description |
|
uptime |
job |
The time that the job has been running without interruption. |
|
fullRestarts |
job |
The total number of full restarts since this job was submitted. |
|
numberOfCompletedCheckpoints |
job |
The number of successfully completed checkpoints. |
|
numberOfFailedCheckpoints |
job |
The number of failed checkpoints. |
Example Dashboard Panels
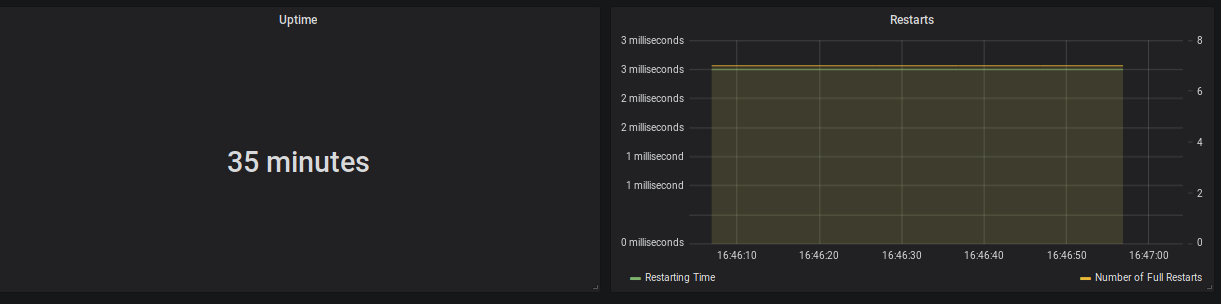
Figure 1: Uptime (35 minutes), Restarting Time (3 milliseconds) and Number of Full Restarts (7)
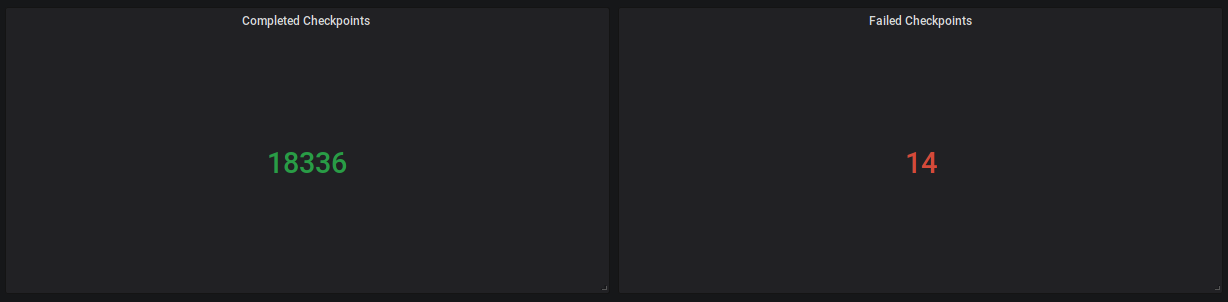
Figure 2: Completed Checkpoints (18336), Failed (14)
Possible Alerts
- ΔfullRestarts > threshold
- ΔnumberOfFailedCheckpoints > threshold
Monitoring Progress & Throughput
Knowing that your application is RUNNING and checkpointing is working fine is good, but it does not tell you whether the application is actually making progress and keeping up with the upstream systems.
Throughput
Flink provides multiple metrics to measure the throughput of your application. For each operator or task (remember: a task can contain multiple chained tasks Flink counts the number of records and bytes going in and out. Out of those metrics, the rate of outgoing records per operator is often the most intuitive and easiest to reason about.
Key Metrics
|
Metric |
Scope |
Description |
|
numRecordsOutPerSecond |
task |
The number of records this operator/task sends per second. |
|
numRecordsOutPerSecond |
operator |
The number of records this operator sends per second. |
Example Dashboard Panels
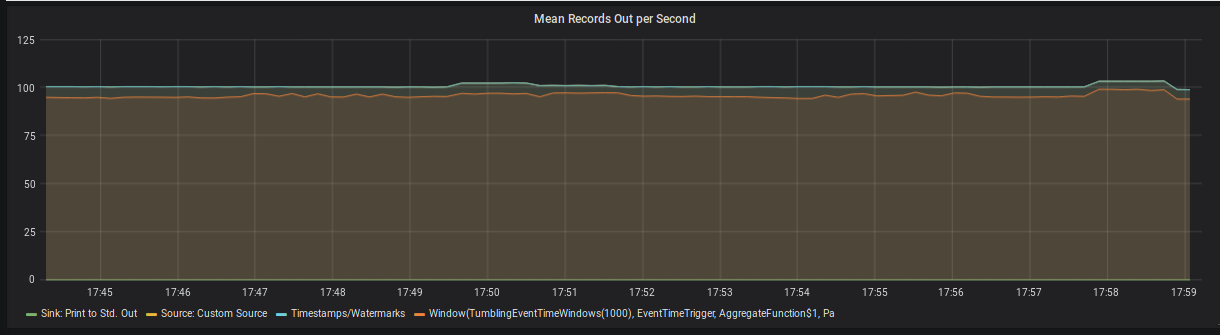 Figure 3: Mean Records Out per Second per Operator
Possible Alerts
recordsOutPerSecond = 0 (for a non-Sink operator)
Note: Source operators always have zero incoming records and sink operators always have zero outgoing records because the metrics only count Flink-internal communication. There is Jira ticketto change this behavior.
Progress
For applications, that use event time semantics, it is important that watermarks progress over time. A watermark of time t tells the framework, that it should not anymore expect to receive events with a timestamp earlier than t, and in turn, to trigger all operations that were scheduled for a timestamp < t. For example, an event time window that ends at t = 30 will be closed and evaluated once the watermark passes 30.
As a consequence, you should monitor the watermark at event time-sensitive operators in your application, such as process functions and windows. If the difference between the current processing time and the watermark, known as even-time skew, is unusually high, then it typically implies one of two issues. First, it could mean that your are simply processing old events, for example during catch-up after a downtime or when your job is simply not able to keep up and events are queuing up. Second, it could mean a single upstream sub-task has not sent a watermark for a long time (for example because it did not receive any events to base the watermark on), which also prevents the watermark in downstream operators to progress. This JIRA ticket provides further information and a work around for the latter.
Key Metrics
|
Metric |
Scope |
Description |
|
currentOutputWatermark |
operator |
The last watermark this operator has emitted |
Example Dashboard Panel
 Figure 4: Event Time Lag per Subtask of a single operator in the topology. In this case, the watermark is lagging a few seconds behind for each subtask.
Possible Alerts
currentProcessingTime - currentOutputWatermark > threshold
“Keeping Up”
When consuming from a message queue, there is often a direct way to monitor if your application is keeping up. By using connector-specific metrics you can monitor how far behind the head of the message queue your current consumer group is. Flink forwards the underlying metrics from most sources.
Key Metrics
|
Metric |
Scope |
Description |
|
records-lag-max |
user |
applies to FlinkKafkaConsumer The maximum lag in terms of the number of records for any partition in this window. An increasing value over time is your best indication that the consumer group is not keeping up with the producers. |
|
millisBehindLatest |
user |
applies to FlinkKinesisConsumer The number of milliseconds a consumer is behind the head of the stream. For any consumer and Kinesis shard, this indicates how far it is behind the current time. |
Possible Alerts
records-lag-max > threshold
millisBehindLatest > threshold
Monitoring Latency
Generally speaking, latency is the delay between the creation of an event and the time at which results based on this event become visible. Once the event is created it is usually stored in a persistent message queue, before it is processed by Apache Flink, which then writes the results to a database or calls a downstream system. In such a pipeline, latency can be introduced at each stage and for various reasons including the following:
It might take a varying amount of time until events are persisted in the message queue.
During periods of high load or during recovery, events might spend some time in the message queue until they are processed by Flink (see previous section).
Some operators in a streaming topology need to buffer events for some time (e.g. in a time window) for functional reasons.
Each computation in your Flink topology (framework or user code), as well as each network shuffle, takes time and adds to latency.
If the application emits through a transactional sink, the sink will only commit and publish transactions upon successful checkpoints of Flink, adding latency usually up to the checkpointing interval for each record.
In practice, it has proven invaluable to add timestamps to your events at multiple stages (at least at creation, persistence, ingestion by Flink, publication by Flink; possibly sampling those to save bandwidth). The differences between these timestamps can be exposed as a user-defined metric in your Flink topology to derive the latency distribution of each stage.
In the rest of this section, we will only consider latency, which is introduced inside the Flink topology and cannot be attributed to transactional sinks or events being buffered for functional reasons (4.).
To this end, Flink comes with a feature called Latency Tracking. When enabled, Flink will insert so-called latency markers periodically at all sources. For each sub-task, a latency distribution from each source to this operator will be reported. The granularity of these histograms can be further controlled by setting metrics.latency.granularity as desired.
Due to the potentially high number of histograms (in particular for metrics.latency.granularity: subtask), enabling latency tracking can significantly impact the performance of the cluster. It is recommended to only enable it to locate sources of latency during debugging.
Key Metrics
|
Metric |
Scope |
Description |
|
latency |
operator |
The latency from the source operator to this operator. |
|
restartingTime |
job |
The time it took to restart the job, or how long the current restart has been in progress. |
Example Dashboard Panel
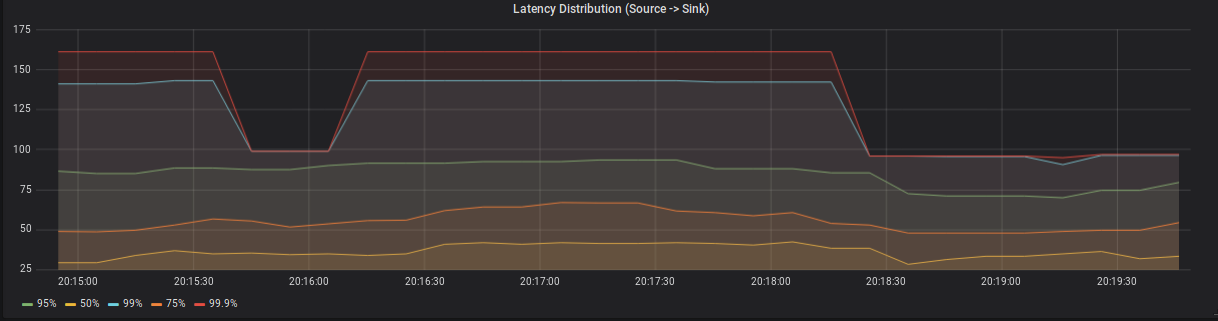
Figure 5: Latency distribution between a source and a single sink subtask.
JVM Metrics
So far we have only looked at Flink-specific metrics. As long as latency & throughput of your application are in line with your expectations and it is checkpointing consistently, this is probably everything you need. On the other hand, if you job’s performance is starting to degrade among the first metrics you want to look at are memory consumption and CPU load of your Task- & JobManager JVMs.
Memory
Flink reports the usage of Heap, NonHeap, Direct & Mapped memory for JobManagers and TaskManagers.
Heap memory - as with most JVM applications - is the most volatile and important metric to watch. This is especially true when using Flink’s filesystem statebackend as it keeps all state objects on the JVM Heap. If the size of long-living objects on the Heap increases significantly, this can usually be attributed to the size of your application state (check the checkpointing metrics for an estimated size of the on-heap state). The possible reasons for growing state are very application-specific. Typically, an increasing number of keys, a large event-time skew between different input streams or simply missing state cleanup may cause growing state.
NonHeap memory is dominated by the metaspace, the size of which is unlimited by default and holds class metadata as well as static content. There is a JIRA Ticket to limit the size to 250 megabyte by default
The biggest driver of Direct memory is by far the number of Flink’s network buffers, which can be configured.
Mapped memory is usually close to zero as Flink does not use memory-mapped files.
In a containerized environment you should additionally monitor the overall memory consumption of the Job- and TaskManager containers to ensure they don’t exceed their resource limits. This is particularly important, when using the RocksDB statebackend, since RocksDB allocates a considerable amount of memory off heap. To understand how much memory RocksDB might use, you can checkout this blog post by Stefan Richter.
Key Metrics
|
Metric |
Scope |
Description |
|
Status.JVM.Memory.NonHeap.Committed |
job-/ taskmanager |
The amount of non-heap memory guaranteed to be available to the JVM (in bytes). |
|
Status.JVM.Memory.Heap.Used |
job-/ taskmanager |
The amount of heap memory currently used (in bytes). |
|
Status.JVM.Memory.Heap.Committed |
job-/ taskmanager |
The amount of heap memory guaranteed to be available to the JVM (in bytes). |
|
Status.JVM.Memory.Direct.MemoryUsed |
job-/ taskmanager |
The amount of memory used by the JVM for the direct buffer pool (in bytes). |
|
Status.JVM.Memory.Mapped.MemoryUsed |
job-/ taskmanager |
The amount of memory used by the JVM for the mapped buffer pool (in bytes). |
|
Status.JVM.GarbageCollector.G1 Young Generation.Time |
job-/ taskmanager |
The total time spent performing G1 Young Generation garbage collection. |
|
Status.JVM.GarbageCollector.G1 Old Generation.Time |
job-/ taskmanager |
The total time spent performing G1 Old Generation garbage collection. |
Example Dashboard Panel
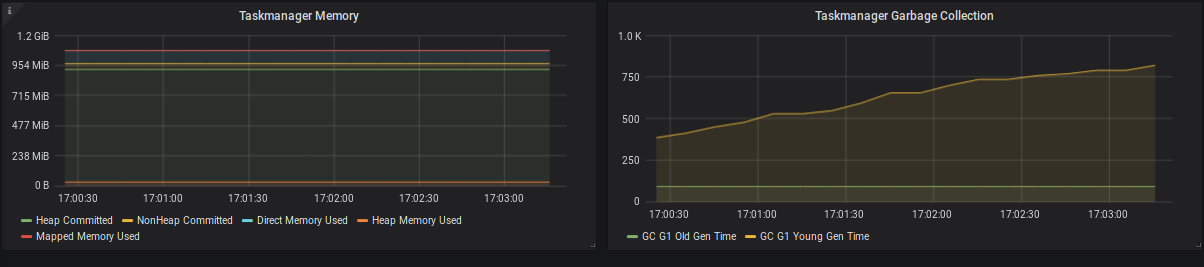
Figure 6: TaskManager memory consumption and garbage collection times.
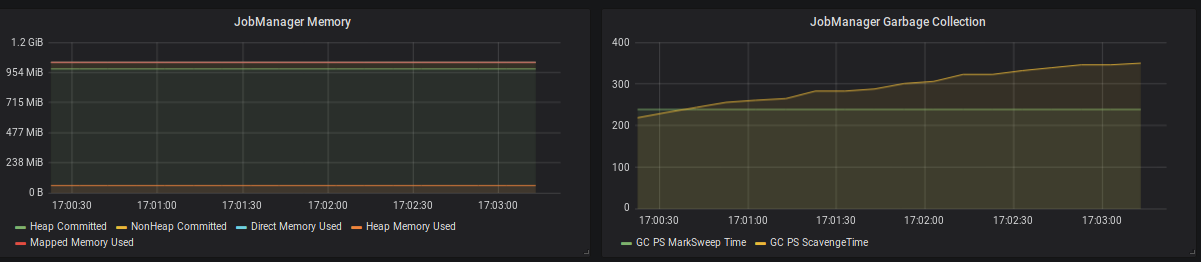
Figure 7: JobManager memory consumption and garbage collection times.
Possible Alerts
container memory limit < container memory + safety margin
CPU
Besides memory, you should also monitor the CPU load of the TaskManagers. If your TaskManagers are constantly under very high load, you might be able to improve the overall performance by decreasing the number of task slots per TaskManager (in case of a Standalone setup), by providing more resources to the TaskManager (in case of a containerized setup), or by providing more TaskManagers. In general, a system already running under very high load during normal operations, will need much more time to catch-up after recovering from a downtime. During this time you will see a much higher latency (event-time skew) than usual.
A sudden increase in the CPU load might also be attributed to high garbage collection pressure, which should be visible in the JVM memory metrics as well.
If one or a few TaskManagers are constantly under very high load, this can slow down the whole topology due to long checkpoint alignment times and increasing event-time skew. A common reason is skew in the partition key of the data, which can be mitigated by pre-aggregating before the shuffle or keying on a more evenly distributed key.
Key Metrics
|
Metrics |
Scope |
Description |
|
Status.JVM.CPU.Load |
job-/ taskmanager |
The recent CPU usage of the JVM. |
Example Dashboard Panel
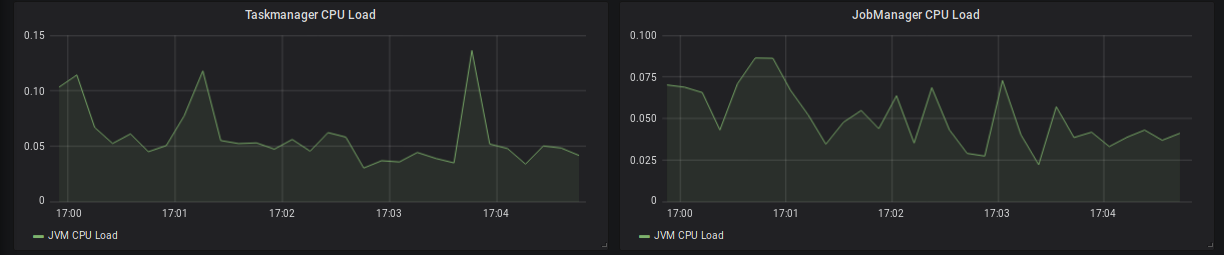
Figure 8: TaskManager & JobManager CPU load
System Resources
In addition to the JVM metrics above, it is also possible to use Flink’s metrics system to gather insights about system resources, i.e. memory, CPU & network-related metrics for the whole machine as opposed to the Flink processes alone. System resource monitoring is disabled by default and requires additional dependencies on the classpath. Please check out the Flink system resource metrics documentation for additional guidance and details. System resource monitoring in Flink can be very helpful in setups without existing host monitoring capabilities.
Conclusion
This post tries to shed some light on Flink’s metrics and monitoring system. You can utilise it as a starting point when you first think about how to successfully monitor your Flink application. I highly recommend to start monitoring your Flink application early on in the development phase. This way you will be able to improve your dashboards and alerts over time and, more importantly, observe the performance impact of the changes to your application throughout the development phase. By doing so, you can ask the right questions about the runtime behaviour of your application, and learn much more about Flink’s internals early on.
Flink监控:Monitoring Apache Flink Applications的更多相关文章
- Flink实战(1) - Apache Flink安装和示例程序的执行
在Windows上安装 从官方网站下载需要的二进制包 比如我下载的是flink-1.2.0-bin-hadoop2-scala_2.10.tgz,解压后进入bin目录 可以执行bat文件,也可以使用c ...
- Apache Flink 为什么能够成为新一代大数据计算引擎?
众所周知,Apache Flink(以下简称 Flink)最早诞生于欧洲,2014 年由其创始团队捐赠给 Apache 基金会.如同其他诞生之初的项目,它新鲜,它开源,它适应了快速转的世界中更重视的速 ...
- apache flink源码挖坑 (未完待续)
Apache Flink 源码解读(一) By yyz940922原创 项目模块 (除去.git, .github, .idea, docs等): flink-annotations: flink ...
- Apache Flink
Flink 剖析 1.概述 在如今数据爆炸的时代,企业的数据量与日俱增,大数据产品层出不穷.今天给大家分享一款产品—— Apache Flink,目前,已是 Apache 顶级项目之一.那么,接下来, ...
- Apache Flink 介绍
原文地址:https://mp.weixin.qq.com/s?__biz=MzU2Njg5Nzk0NQ==&mid=2247483660&idx=1&sn=ecf01cfc8 ...
- Apache Flink 1.9重磅发布!首次合并阿里内部版本Blink重要功能
8月22日,Apache Flink 1.9.0 版本正式发布,这也是阿里内部版本 Blink 合并入 Flink 后的首次版本发布.此次版本更新带来的重大功能包括批处理作业的批式恢复,以及 Tabl ...
- 园子的推广博文:欢迎收看 Apache Flink 技术峰会 FFA 2021 的视频回放
园子专属收看链接:https://developer.aliyun.com/special/ffa2021/live#?utm_content=g_1000316459 Flink Forward 是 ...
- Building real-time dashboard applications with Apache Flink, Elasticsearch, and Kibana
https://www.elastic.co/cn/blog/building-real-time-dashboard-applications-with-apache-flink-elasticse ...
- Stream processing with Apache Flink and Minio
转自:https://blog.minio.io/stream-processing-with-apache-flink-and-minio-10da85590787 Modern technolog ...
随机推荐
- 为什么在STM32F429工程配置中需要预先定义USE_STDPERIPH_DRIVER和STM32F429_439xx?
如图: 1.查找USE_STDPERIPH_DRIVER,发现这个宏出现在stm32f4xx.h头文件中,并且有如下代码: 也就是说,通过已经定义了USE_STDPERIPH_DRIVER宏加载stm ...
- Linux 操作系统基础
list : ls 目录: 文件,路径映射. ls : -l : lang 长格式, 显示完整信息. 文件类型: -: 普通文件(f) d: 目录文件 b: 块设备文件(block) c: 字块设备文 ...
- hexo 报错 Cannot read property 'replace' of null
详细错误信息: FATAL Cannot read property 'replace' of null TypeError: Cannot read property 'replace' of nu ...
- 无废话--Mac OS, VS Code 搭建c/c++基本开发环境
无废话,直接上步骤. 1) 安装 xcode. 打开App Store,搜索xcode,进行下载安装. 2)执行命令: xcode-select --install 安装命令行工具. 3)安装VS C ...
- 线性回归预测PM2.5----台大李宏毅机器学习作业1(HW1)
一.作业说明 给定训练集train.csv,要求根据前9个小时的空气监测情况预测第10个小时的PM2.5含量. 训练集介绍: (1)CSV文件,包含台湾丰原地区240天的气象观测资料(取每个月前20天 ...
- PHP全栈学习笔记14
一.搭建PHP开发环境 Apahce服务器 Dreamwear创建站点 <!DOCTYPE html PUBLIC "-//W3C//DTD XHTML 1.0 Transitiona ...
- 知乎专栏开放性api
概述 这是我在工作中扒的知乎专栏的开放性api,记录下来供以后开发时参考,相信对其他人也有用. 参考资料: zhihu库 zhihu-oauth库 开放性api 其中hemingke是专栏名字,可以换 ...
- 如何将Azure DevOps中的代码发布到Azure App Service中
标题:如何将Azure DevOps中的代码发布到Azure App Service中 作者:Lamond Lu 背景 最近做了几个项目一直在用Azure DevOps和Azure App Servi ...
- 辅助模式最终考验的是想象力,先来看看怎么用!| Accessibility
一.序 Hi,大家好,我是承香墨影! Android 的辅助模式(Accessibility)功能非常的强大.基本上被获取到授权之后,可以监听手机上的任何事件,例如:屏幕点击.窗口的变化.以及模拟点击 ...
- C#利用NPOI操作Excel文件
NPOI作为开源免费的组件,功能强大,可用来读写Excel(兼容xls和xlsx两种版本).Word.PPT文件.可是要让我们记住所有的操作,这便有点困难了,至此,总结一些在开发中常用的针对Excel ...