echarjs—阿里历年双十一销售数据统计及预测
阿里双十一数据统计
<!DOCTYPE html>
<html>
<head>
<title>阿里历年双十一销售数据统计及预测</title>
<meta http-equiv="pragma" content="no-cache">
<meta http-equiv="cache-control" content="no-cache">
<meta http-equiv="expires" content="0">
<meta http-equiv="keywords" content="keyword1,keyword2,keyword3">
<meta http-equiv="description" content="This is my page">
<link rel="stylesheet" href="css/bootstrap.min.css">
</head> <body>
<section class="hj-second-page-section">
<div class="container-fluid">
<div class="rows">
<div class="col-xs-12 col-sm-12 col-md-12 col-lg-12">
<div class="rows">
<div class="col-xs-12 col-sm-12 col-md-12 col-lg-12 hj-jumbotron-div">
<div class="panel panel-primary ng-scope">
<!-- pannel start -->
<div class="panel-body vc-pannel-body-toggle">
<div class="rows ng-scope">
<div class="panel-body vc-msg-panel-body">
<div class="row">
<div class="col-xs-12 col-sm-12 col-md-6 col-lg-6">
<div id="rt_chart1" style=""></div>
</div>
</div>
</div>
</div>
</div>
<!-- pannel end -->
</div>
</div>
</div>
</div>
</div>
</div>
</section>
<script src="js/echarts2.js"></script>
<script src="js/jquery-2.2.3.min.js"></script>
<script>
/**
* @description 绘制折线图
* @date 2019-11-13
* @param
*/
function initChart1() {
$("#rt_chart1").height(460);
$("#rt_chart1").width(1005);
$("#rt_chart1").css("border","1px solid #ddd");
var myChart1 = echarts.init(document.getElementById("rt_chart1")); var option1 = {
title: {
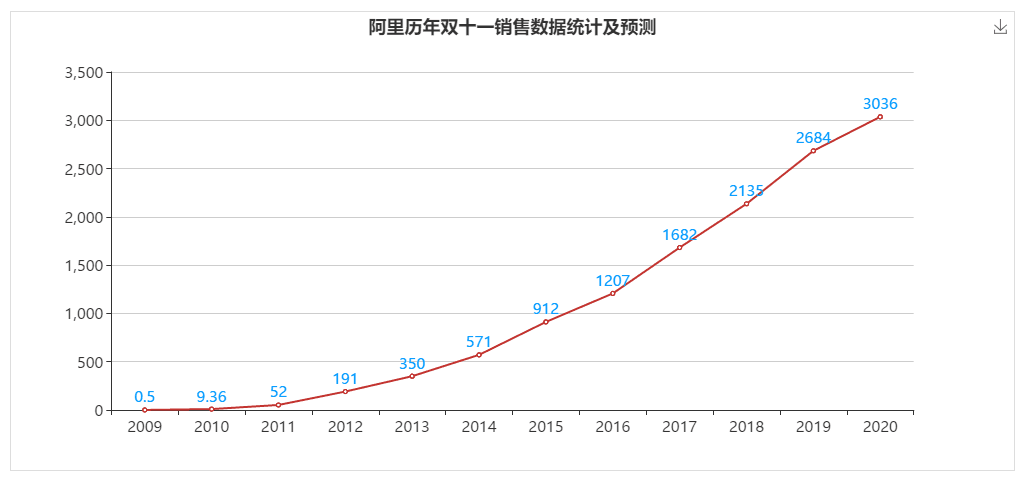
text: '阿里历年双十一销售数据统计及预测',
//subtext: '数据来源于网络',
sublink: '',
left: 'center'
},
tooltip : {
trigger: 'axis'
},
toolbox: {
show: true,
feature: {
saveAsImage: {}
}
},
legend: {
data:[2009,2010,2011,2012,2013,2014,2015,2016,2017,2018,2019,2020]
},
xAxis: {
type: 'category',
data: [2009,2010,2011,2012,2013,2014,2015,2016,2017,2018,2019,2020]
},
yAxis: {
type: 'value'
},
series: [{
itemStyle: {
normal: {
label: {
show: true,
position: 'top',
textStyle: {
color: '#0099ff'
}
}
}
},
data: [0.5,9.36,52.0,191.0,350.0,571.0,912.0,1207.0,1682.0,2135.0,2684.0,3036.0],
type: 'line'
}]
}; // 为echarts对象加载数据
myChart1.setOption(option1);
} initChart1();
</script>
</body>
</html>
<!DOCTYPE html>
<html>
<head>
<title>阿里历年双十一销售数据统计及预测</title>
<meta http-equiv="pragma" content="no-cache">
<meta http-equiv="cache-control" content="no-cache">
<meta http-equiv="expires" content="0">
<meta http-equiv="keywords" content="keyword1,keyword2,keyword3">
<meta http-equiv="description" content="This is my page">
<link rel="stylesheet" href="css/bootstrap.min.css">
</head> <body>
<section class="hj-second-page-section">
<div class="container-fluid">
<div class="rows">
<div class="col-xs-12 col-sm-12 col-md-12 col-lg-12">
<div class="rows">
<div class="col-xs-12 col-sm-12 col-md-12 col-lg-12 hj-jumbotron-div">
<div class="panel panel-primary ng-scope">
<!-- pannel start -->
<div class="panel-body vc-pannel-body-toggle">
<div class="rows ng-scope">
<div class="panel-body vc-msg-panel-body">
<div class="row">
<div class="col-xs-12 col-sm-12 col-md-6 col-lg-6">
<div id="rt_chart1" style=""></div>
</div>
</div>
</div>
</div>
</div>
<!-- pannel end -->
</div>
</div>
</div>
</div>
</div>
</div>
</section>
<script src="js/echarts2.js"></script>
<script src="js/jquery-2.2.3.min.js"></script>
<script>
/**
* @description 绘制柱状图
* @date 2019-11-13
* @param
*/
function initChart1() {
$("#rt_chart1").height(460);
$("#rt_chart1").width(1205);
$("#rt_chart1").css("border","1px solid #ddd");
var myChart1 = echarts.init(document.getElementById("rt_chart1")); //var option1 = {
var option1 = {
title : {
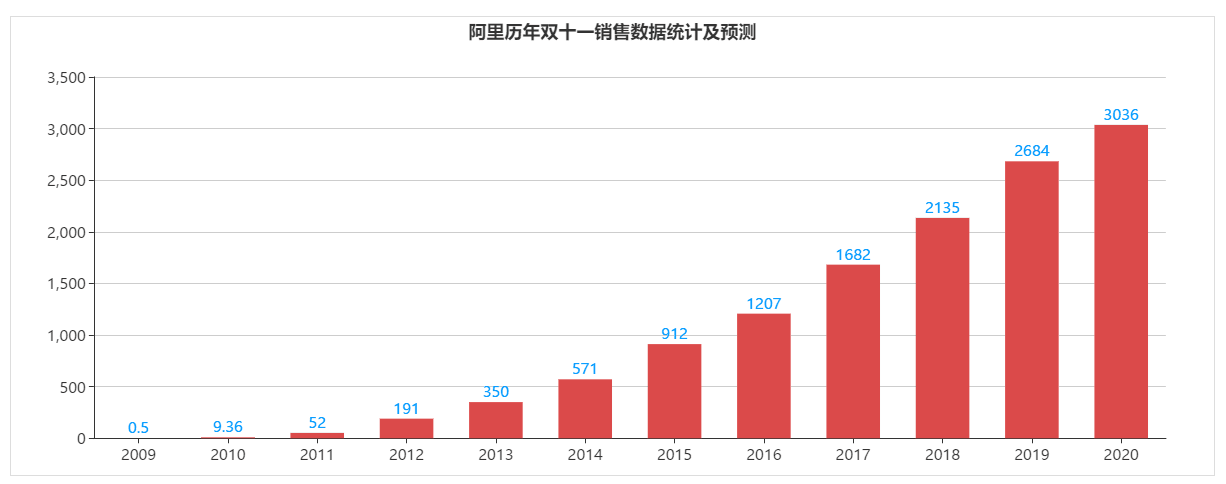
text: '阿里历年双十一销售数据统计及预测',
//subtext: '数据来源于网络',
left: 'center'
},
color: ['#DB4B4B'],
tooltip : {
trigger: 'axis',
axisPointer : { // 坐标轴指示器,坐标轴触发有效
type : 'shadow' // 默认为直线,可选为:'line' | 'shadow'
}
},
grid: {
left: '3%',
right: '4%',
bottom: '3%',
containLabel: true
},
xAxis : [
{
type : 'category',
data:[2009,2010,2011,2012,2013,2014,2015,2016,2017,2018,2019,2020],
axisTick: {
alignWithLabel: true
},
axisLabel: {
interval:0
}
}
],
yAxis : [
{
type : 'value'
}
],
series : [
{
itemStyle: {
normal: {
label: {
show: true,
position: 'top',
textStyle: {
color: '#0099ff'
}
}
}
},
name:'亿元',
type:'bar',
barWidth: '60%',
data:[0.5,9.36,52.0,191.0,350.0,571.0,912.0,1207.0,1682.0,2135.0,2684.0,3036.0]
}
]
}; // 为echarts对象加载数据
myChart1.setOption(option1);
} initChart1();
</script>
</body>
</html>
echarjs—阿里历年双十一销售数据统计及预测的更多相关文章
- 浅析 阿里 OceanBase 双十一 淘宝天猫 天量交易 承载能力 原理
我们先看看 这 2 篇文章: <秘诀!支付宝支撑双十一4200万次/秒的数据库请求峰值的技术实现> https://mp.weixin.qq.com/s?__biz=MzI3MzEzMD ...
- 阿里历年经典Java面试题汇总,想进BAT你还不快收藏!
转载:https://mp.weixin.qq.com/s/M8YyxloxZnMACH9QCQN7HA Volatile的特征: A.禁止指令重排(有例外) B.可见性 Volatile的内存语义: ...
- 阿里历年经典Java面试题汇总
Volatile的特征: A.禁止指令重排(有例外) B.可见性 Volatile的内存语义: 当写一个volatile变量时,JMM会把线程对应的本地内存中的共享变量值刷新到主内存. 当读一个vol ...
- iOS开发工具篇-AppStore统计工具 (转载)
随着iOS开发的流行,针对iOS开发涉及的方方面面,早有一些公司提供了专门的解决方案或工具.这些解决方案或工具包括:用户行为统计工具(友盟,Flurry,Google Analytics等), App ...
- 阿里云资深DBA专家罗龙九:云数据库十大经典案例分析【转载】
阿里云资深DBA专家罗龙九:云数据库十大经典案例分析 2016-07-21 06:33 本文已获阿里云授权发布,转载具体要求见文末 摘要:本文根据阿里云资深DBA专家罗龙九在首届阿里巴巴在线峰会的&l ...
- 2018年Android的保活方案效果统计
一.常见保活方案 1.监听广播:监听全局的静态广播,比如时间更新的广播.开机广播.解锁屏.网络状态.解锁加锁亮屏暗屏(3.1版本),高版本需要应用开机后运行一次才能监听这些系统广播,目前此方案失效.可 ...
- 教你用ActiveReports分析京东双十一数据的价值
随着双十一购物盛会落下帷幕,各大电商平台纷纷公布出自己今年的成绩.与其它同行不同的是,京东除了公布1598亿的线上下单金额,还公布了线上线下融合的战果. 面对京东线上.线下海量数据源,我们该如何进行整 ...
- iOS开发工具篇-AppStore统计工具
本文转载至 http://mobile.51cto.com/hot-418183.htm 随着iOS开发的流行,针对iOS开发涉及的方方面面,早有一些公司提供了专门的解决方案或工具.这些解决方案或工具 ...
- iOS开发工具篇-AppStore统计工具
苹果官方的iTunes Connect提供的销售数据统计功能比较弱,例如只能保存最近30天的详细销售数据,界面丑陋, 无法查看App的排名历史变化情况等. 早有一些公司提供了专门的解决方案或工具.这些 ...
随机推荐
- Linux CentOS 7 安装PostgreSQL 9.5.17 (源码编译)
近日需要将PostgreSQL数据库从Windows中迁移到Linux中,Linux CentOS 7 安装PostgreSQL 9.5.17 安装过程 特此记录. 安装环境: 数据库:Postgre ...
- 【HICP Gauss】数据库 数据库管理(shutdown 日志 连接命令)-5
数据库关闭终止Zengine进程关闭数据库 会导致无法预料的状态 建议shutdown关闭数据库 shutdown 模式1.normal默认 停止新请求 断开等待会话 关闭服务 终止主进程 需要连接发 ...
- Mariadb/MySQL生产环境的my.cnf配置示例
Mariadb/MySQL生产环境的my.cnf配置示例 作者:尹正杰 版权声明:原创作品,谢绝转载!否则将追究法律责任. 一.针对MySQL主程序mysqld定义参数[mysqld] 1>. ...
- 读取yaml文件小方法
def read_inf(inf_path): '''读取指定路径配置文件''' try: import yaml fr = open(inf_path) fy = yaml.load(fr) fr. ...
- 微信程序开发之-WeixinJSBridge调用
微信的WeixinJSBridge还是很厉害的,虽然官方文档只公布了3个功能,但是还内置的很多功能没公布,但是存在.今天就好好和大家聊聊 功能1------发送给好友 代码如下: functi ...
- js正则实现从一段复杂html代码字符串中匹配并处理特定信息
js正则实现从一段复杂html代码字符串中匹配并处理特定信息 问题: 现在要从一个复杂的html代码字符串(包含各种html标签,数字.中文等信息)中找到某一段特别的信息(被一对“|”包裹着),并对他 ...
- 与你一起学习MS Project——理论篇:项目管理与Project
Hi,你好!我是大黄蜂,非常高兴借此机会与你一起学习微软Project的相关知识和技能.这一次的分享主要是结合本人在实际使用Project 2013过程中的一些方法技巧,其中有一些材料则来源于互联网, ...
- 决策树——C4.5
-- coding: utf-8 -- """ Created on Thu Aug 2 17:09:34 2018 决策树ID3,C4.5的实现 @author: we ...
- Linear Discriminant Analysis Algorithm
线性判别分析算法. 逻辑回归是一种分类算法,传统上仅限于两类分类问题. 如果有两个以上的类,那么线性判别分析算法是首选的线性分类技术.LDA的表示非常直接.它包括数据的统计属性,为每个类计算.对于单个 ...
- 洛谷 P1250 种树 题解
差分约束系统,维护前缀和,根据式子d[ b ] < = d[ e + 1 ] - t,可以看出要连e和b - 1,但占用了超级源点0,所以要把区间向后移,这样就可以用超级源点0来保持图的连通性( ...