matplotlib基本使用(矩形图、饼图、热力图、3D图)
使用matplotlib画简单的图形:
#-*- coding:utf-8 -*-

from numpy.random import randn

import matplotlib.pyplot as plt

fig=plt.figure()

ax1=fig.add_subplot(2,2,1)

plt.plot(randn(50).cumsum(),'k--')

ax2=fig.add_subplot(2,2,2)

#bins越大矩形越窄 alpha表示颜色深度

ax2.hist(randn(10000), bins  = 30, color = 'red', alpha = 1)

ax3=fig.add_subplot(2,2,3)

plt.plot([1.5, 2, 4, -2, 1.6])

plt.show()
运行结果:

散点图
#-*- coding:utf-8 -*-

from pylab import *

import matplotlib.pyplot as plt

mpl.rcParams['font.sans-serif'] = ['SimHei']

n = 1024

X = np.random.normal(0,1,n)

Y = np.random.normal(0,1,n)

for i in range(1,10):

    scatter(i, i)

plt.title(u"散点图",color='red')

show()

pyplot.subplots有几个选项
nrows:subplot的行数
ncols:subplot的列数
sharex:所有subplot共享x轴刻度
sharey:所有subplot共享Y轴刻度
#-*- coding:utf-8 -*-

from  numpy.random import randn

from matplotlib import pyplot as plt

fig,axes=plt.subplots(2,2,sharex=True,sharey=True)

for i in range(2):

    for j in range(2):

        axes[i,j].hist(randn(50),bins=50,color='red',alpha=1)

plt.show()

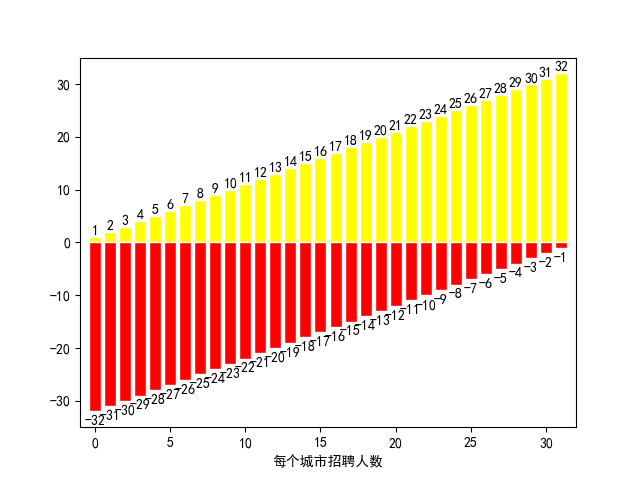
矩阵图
#-*- coding:utf-8 -*-

from pylab import *

#使用中文

mpl.rcParams['font.sans-serif'] = ['SimHei']

#显示负号

matplotlib.rcParams['axes.unicode_minus'] = False

n=32

list1=[i for i in range(1,33)]

list2=[i for i in range(-32,0)]

n= np.arange(n)

xlim(-1,32)

ylim(-35,35)

xlabel(u'每个城市招聘人数')

bar(n, list1, facecolor='yellow', edgecolor='white')

bar(n, list2, facecolor='red', edgecolor='white')

for x,y in zip(n,list1):

    text(x, y, '%d' % y, ha='center', va= 'bottom' )

for x,y in zip(n,list2):

    text(x, y-3, '%d' % y, ha='center', va= 'bottom')

show()
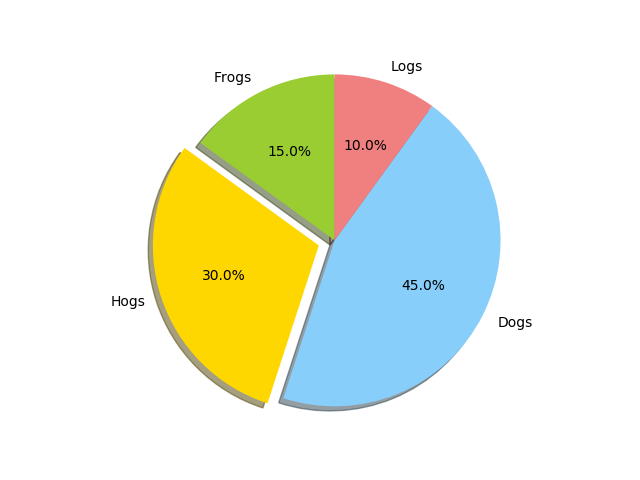
饼图
# -*- coding: utf-8 -*-

import matplotlib.pyplot as plt

labels = 'Frogs', 'Hogs', 'Dogs', 'Logs'  # 设置标签

sizes = [15, 30, 45, 10]  # 占比,和为100

colors = ['yellowgreen', 'gold', 'lightskyblue', 'lightcoral']  # 颜色

explode = (0, 0.1, 0, 0)  # 展开第二个扇形,即Hogs,间距为0.1

plt.pie(sizes, explode=explode, labels=labels, colors=colors, autopct='%1.1f%%', shadow=True,

        startangle=90)  # startangle控制饼状图的旋转方向

plt.axis('equal')  # 保证饼状图是正圆,否则会有一点角度偏斜

plt.show()
# -*- coding: utf-8 -*-

import matplotlib.pyplot as plt

import numpy as np

labels = 'Frogs', 'Hogs', 'Dogs', 'Logs'  # 设置标签

colors = ['yellowgreen', 'gold', 'lightskyblue', 'lightcoral']  # 颜色

explode = (0.1, 0.2, 0, 0)  # 展开第二个扇形,即Hogs,间距为0.1

fig = plt.figure()

ax = fig.gca()

ax.pie(np.random.random(4), explode=explode, labels=labels, colors=colors, autopct='%1.1f%%', shadow=True,

       startangle=90, radius=0.25, center=(0, 0), frame=True)

ax.pie(np.random.random(4), explode=explode, labels=labels, colors=colors, autopct='%1.1f%%', shadow=True,

       startangle=90, radius=0.25, center=(1, 1), frame=True)

ax.pie(np.random.random(4), explode=explode, labels=labels, colors=colors, autopct='%1.1f%%', shadow=True,

       startangle=90, radius=0.25, center=(0, 1), frame=True)

ax.pie(np.random.random(4), explode=explode, labels=labels, colors=colors, autopct='%1.1f%%', shadow=True,

       startangle=90, radius=0.25, center=(1, 0), frame=True)

ax.set_xticks([0, 1])  # 设置位置

ax.set_yticks([0, 1])

ax.set_xticklabels(["Sunny", "Cloudy"])  # 设置标签

ax.set_yticklabels(["Dry", "Rainy"])

ax.set_xlim((-0.5, 1.5))

ax.set_ylim((-0.5, 1.5))

ax.set_aspect('equal')

plt.show()

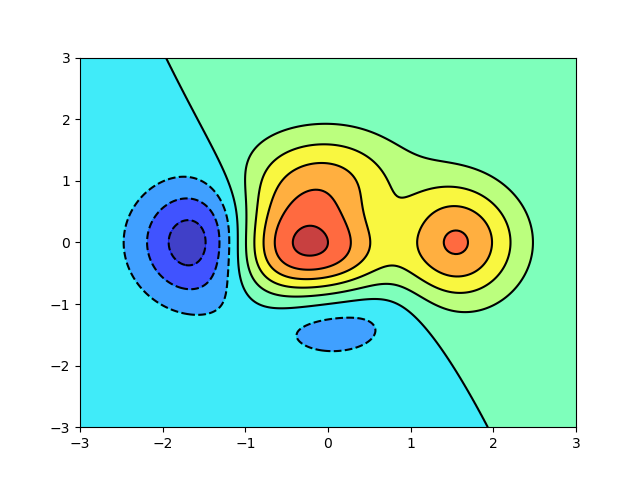
热力图
#-*- coding:utf-8 -*-

from pylab import *

def f(x,y): return (1-x/2+x**5+y**3)*np.exp(-x**2-y**2)

n = 256

x = np.linspace(-3,3,n)

y = np.linspace(-3,3,n)

X,Y = np.meshgrid(x,y)

contourf(X, Y, f(X,Y), 8, alpha=.75, cmap='jet')

C = contour(X, Y, f(X,Y), 8, colors='black', linewidth=.5)

show()
利用numpy来实现sin函数
#-*- coding:utf-8 -*-

from pylab import *

#使用中文

mpl.rcParams['font.sans-serif'] = ['SimHei']

#显示负号

matplotlib.rcParams['axes.unicode_minus'] = False

t=np.arange(0.0,2.0,0.01)#0到2之间,以0.01为间距

s=np.sin(2*np.pi*t)#利用numpy实现2sinπx

plt.plot(t,s)

plt.xlabel('t的值')

plt.ylabel('s的值')

#这里同时可以使用plt.xlim()和plt.ylim()来限制x、y轴的范围

plt.show()

#-*- coding:utf-8 -*-

from pylab import *

#使用中文

mpl.rcParams['font.sans-serif'] = ['SimHei']

#显示负号

matplotlib.rcParams['axes.unicode_minus'] = False

x1=np.linspace(0.0,5.0)

x2=np.linspace(0.0,2.0)

y1=np.cos(2*np.pi*x1)*np.exp(-x1)

y2=np.cos(2*np.pi*x2)

plt.subplot(2,1,1)

plt.plot(x1,y1,'y*-')#y表示颜色,*表示点的样子,-表示连接

plt.title('图1')

plt.subplot(2,1,2)#最后一个2表示在第二个位置

plt.plot(x1,y2,'r.--')

plt.title('图2')

plt.show()

#-*- coding:utf-8 -*-
from pylab import * #使用中文
mpl.rcParams['font.sans-serif'] = ['SimHei']
#显示负号
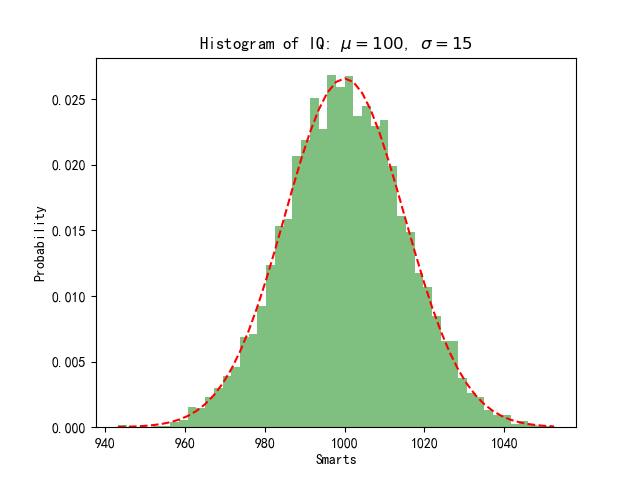
matplotlib.rcParams['axes.unicode_minus'] = False mu=1000
sigma=15
x=mu+sigma*np.random.randn(10000)#在均值周围产生符合正态分布x值 num_bins=50
n,bins,patches=plt.hist(x,num_bins,normed=1,facecolor='green',alpha=0.5)
#直方图函数,x为x轴的值,normed=1表示为概率密度,即和为一,绿色方块,色深参数0.5.返回n个概率,直方块左边线的x值,及各个方块对象
y=mlab.normpdf(bins,mu,sigma)#画一条逼近的曲线
plt.plot(bins,y,'r--')
plt.xlabel('Smarts')
plt.ylabel('Probability')
plt.title(r'Histogram of IQ: $\mu=100$, $\sigma=15$') plt.subplots_adjust(left=0.15)
plt.show()
# -*- coding:utf-8 -*-

from pylab import *

from mpl_toolkits.mplot3d import Axes3D

x_list = [[3, 3, 2], [4, 3, 1], [1, 2, 3], [1, 1, 2], [2, 1, 2]]

fig = plt.figure()

ax = Axes3D(fig)

for x in x_list:

    ax.scatter(x[0], x[1], x[2], c='r')

plt.show()

from pylab import *

from mpl_toolkits.mplot3d import Axes3D

fig = plt.figure()

ax = fig.add_subplot(1, 1, 1, projection='3d')

X = np.arange(1, 10, 1)

Y = np.arange(1, 10, 1)

X, Y = np.meshgrid(X, Y)

Z = 3 * X + 2 * Y + 30

surf = ax.plot_surface(X, Y, Z, rstride=1, cstride=1, cmap=cm.jet, linewidth=0, antialiased=True)

ax.set_zlim3d(0,100)

fig.colorbar(surf, shrink=0.5, aspect=5)

plt.show()

# -*- coding:utf-8 -*-
from mpl_toolkits.mplot3d import Axes3D
from matplotlib import cm
from matplotlib.ticker import LinearLocator, FormatStrFormatter
import matplotlib.pyplot as plt
import numpy as np

fig = plt.figure()
ax = fig.gca(projection='3d')
X = np.arange(-5, 5, 0.1)
Y = np.arange(-5, 5, 0.1)
X, Y = np.meshgrid(X, Y)
R = np.sqrt(X ** 2 + Y ** 2)
Z = np.sin(R)
surf = ax.plot_surface(X, Y, Z, rstride=1, cstride=1, cmap=cm.coolwarm, linewidth=0, antialiased=False)
# 画表面,x,y,z坐标, 横向步长,纵向步长,颜色,线宽,是否渐变
ax.set_zlim(-1.01, 1.01)  # 坐标系的下边界和上边界

ax.zaxis.set_major_locator(LinearLocator(10))  # 设置Z轴标度
ax.zaxis.set_major_formatter(FormatStrFormatter('%.02f'))  # Z轴精度
fig.colorbar(surf, shrink=0.5, aspect=5)  # shrink颜色条伸缩比例(0-1),aspect颜色条宽度(反比例,数值越大宽度越窄)

plt.show()

matplotlib基本使用(矩形图、饼图、热力图、3D图)的更多相关文章
- matplotlib点线 坐标刻度 3D图绘制(六)
plot语句中支持除X,Y以外的参数,以字符串形式存在,来控制颜色.线型.点型等要素,语法形式为: plt.plot(X, Y, 'format', ...) 1 点和线的样式 颜色 参数color或 ...
- 4-Highcharts 3D图之3D普通饼图
<!DOCTYPE> <html lang='en'> <head> <title>4-Highcharts 3D图之3D普通饼图</title& ...
- 06. Matplotlib 2 |折线图| 柱状图| 堆叠图| 面积图| 填图| 饼图| 直方图| 散点图| 极坐标| 图箱型图
1.基本图表绘制 plt.plot() 图表类别:线形图.柱状图.密度图,以横纵坐标两个维度为主同时可延展出多种其他图表样式 plt.plot(kind='line', ax=None, figsiz ...
- python数据可视化-matplotlib入门(5)-饼图和堆叠图
饼图常用于统计学模块,画饼图用到的方法为:pie( ) 一.pie()函数用来绘制饼图 pie(x, explode=None, labels=None, colors=None, autopct=N ...
- python中matplotlib绘图封装类之折线图、条状图、圆饼图
DrawHelper.py封装类源码: import matplotlib import matplotlib.pyplot as plt import numpy as np class DrawH ...
- 【Python环境】matplotlib - 2D 与 3D 图的绘制
2015-10-30数据科学自媒体 类MATLAB API 最简单的入门是从类 MATLAB API 开始,它被设计成兼容 MATLAB 绘图函数. 让我们加载它: from pylab import ...
- 3-Highcharts 3D图之3D柱状图分组叠堆3D图
<!DOCTYPE> <html lang='en'> <head> <title>3-Highcharts 3D图之3D柱状图分组叠堆3D图</ ...
- 2-Highcharts 3D图之3D柱状图带可调试倾斜角度
<!DOCTYPE> <html lang='en'> <head> <title>2-Highcharts 3D图之3D柱状图带可调试倾斜角度< ...
- 1-Highcharts 3D图之普通3D柱状图与带空值
<!DOCTYPE> <html lang='en'> <head> <title>1-Highcharts 3D图之普通3D柱状图与带空值</t ...
- struts2整合JFreechart 饼图、折线图、柱形图
struts2整合JFreechart 饼图.折线图.柱形图 上效果图: 当然可以将数据导出图片格式存储.具体下的链接里的文件有保存成图片的操作. 因为是strust2整合JFreechart,所以s ...
随机推荐
- #include 和 #import 的区别, @class 的含义
#import 和 #include 会包含这个类的所有信息,包括实体变量和方法 而#include比起 #import的好处不会引起重复包含 @class是用来做类引用的 @class就是告诉编译 ...
- (转)EF Power tool用法
转自:http://msdn.microsoft.com/zh-cn/data/jj593170.aspx 命令摘要 安装 EF Power Tools 后,将提供以下上下文菜单项.本演练将详细讨论这 ...
- MFC-CWinApp
概览 CWinApp为应用程序类, CWinApp由 CWinThread 派生而来 ,后者表示可能具有一个或多个线程的应用程序的主执行线程,基于框架生成的应用程序必须有且仅有一个从 CWinApp ...
- Delphi XE5 图解为Android应用制作签名
http://redboy136.blog.163.com/blog/static/107188432201381872820132 Delphi XE5 图解为Android应用制作签名 2013- ...
- XCode 7.3.1(dmg) 官方直接下载地址(离线下载)
XCode 7 7.3.1:https://developer.apple.com/services-account/download?path=/Developer_Tools/Xcode_7.3. ...
- Eclipse使用Maven搭建Java Web项目,并直接部署Tomcat(转载)
原文地址:http://www.cnblogs.com/hackyo/p/6527910.html 1.环境: win10 Java 1.8 Maven 3.3.9 Eclipse IDE for J ...
- Windows 8/8.1 及 Windows Phone 8 应用神器 - APP Producer
继 App studio 以及 Project Siena 之后 微软再次打造应用生成器 APP Producer,这个版本的应用生成器功能相对比之前两个版本要简单许多,更适合入门并且真正的支持全平 ...
- 使用 X-Frame-Options 防止被iframe 造成跨域iframe 提交挂掉
Refused to display 'http://www.***.com/login/doLogin.html' in a frame because it set 'X-Frame-Optio ...
- Regex Golf练习笔记(1)
正则表达式进阶练习:https://alf.nu/RegexGolf (此练习笔记) 正则表达式验证:https://regexr.com/ (1) (2) 注释:每个词的三个字母在后面重复出现了一 ...
- 曲演杂坛--使用TRY CATCH应该注意的一个小细节
群里一个朋友遇到一个TRY CATCH的小问题,测试后发现是自己从来没有考虑的情况,写篇blog加深下印象 --============================================ ...