【QCustomPlot】绘制 x-y 曲线图
说明
使用 QCustomPlot 绘图库辅助开发时整理的学习笔记。同系列文章目录可见 《绘图库 QCustomPlot 学习笔记》目录。本篇介绍如何使用 QCustomPlot 绘制 x-y 曲线图,需要 x 轴数据与 y 轴数据都已知,示例中使用的 QCustomPlot 版本为 Version 2.1.1,QT 版本为 5.9.2。
1. 示例工程配置
通过包含源码的方式来使用 QCustomPlot 绘图库,方法详见本人同系列文章 使用方法(源码方式)。此外,库官网有提供绘图的示例代码,详见 QCustomPlot - Introduction,下载压缩包 QCustomPlot.tar.gz 中也有示例的工程代码,详见同系列文章 下载。下面示例中所用的工程文件(demoQCP.pro)内容为:
QT       += core gui

greaterThan(QT_MAJOR_VERSION, 4): QT += widgets printsupport

greaterThan(QT_MAJOR_VERSION, 4): CONFIG += c++11

lessThan(QT_MAJOR_VERSION, 5): QMAKE_CXXFLAGS += -std=c++11

TARGET = demoQCP

TEMPLATE = app

SOURCES += main.cpp\

           qcustomplot.cpp

HEADERS  += qcustomplot.h
实际使用 QCustomPlot 进行绘图时,通常是将 UI 界面中的某个 QWidget 控件提升为 QCustomPlot,然后以指针的方式调用 QCustomPlot 的类方法绘制图像。这一方式用在示例中有点繁琐(需要 .ui 文件),为了突出示例重点,减少文件依赖,示例代码直接在 main.cpp 中声明了一个 QCustomPlot 对象,示例工程所需的文件如下,只需四个文件,demoQCP.pro 的文件内容已在上面给出,main.cpp 的文件内容会在后面给出,qcustomplot.h 与 qcustomplot.cpp 两个文件下载自官网。

main.cpp 文件的框架如下,demoPlot() 里面用来写绘图的示例代码。
#include <QApplication>

#include <QMainWindow>

#include "qcustomplot.h"

void demoPlot(QCustomPlot *customPlot)

{

    // 绘图示例代码

}

int main(int argc, char *argv[])

{

    QApplication a(argc, argv);

    QMainWindow window;

    // 将QCustomPlot窗口作为QMainWindow中心窗口

    QCustomPlot customPlot;

    window.setCentralWidget(&customPlot);

    // 绘图

    demoPlot(&customPlot);

    // 显示

    window.setWindowTitle(QStringLiteral("x-y 曲线图示例 @木三百川"));

    window.setGeometry(100, 100, 800, 600);

    window.show();

    return a.exec();

}
关于绘图颜色、线型、字体、网格线等外观上的美化,会在本人同系列文章 《绘图库 QCustomPlot 学习笔记》目录 中再做介绍,想学习的不妨关注一下。本文章只介绍绘制 x-y 曲线图的基础方法。
2. 常用 API 介绍
绘制 x-y 曲线图所使用的类为 QCPGraph,它提供的类方法可在 Documentation - QCPGraph 中找到。常用的接口有以下几个:
// 重置/添加绘图数据的接口

void setData(const QVector<double> &keys, const QVector<double> &values, bool alreadySorted=false)

void addData(const QVector<double> &keys, const QVector<double> &values, bool alreadySorted=false)

void addData(double key, double value)

// 设置线型

void setLineStyle(LineStyle ls)

// 设置点型

void setScatterStyle(const QCPScatterStyle &style)
3. 绘制一条 x-y 曲线
demoPlot() 函数如下:
void demoPlot(QCustomPlot *customPlot)

{

    // 显示上方横轴(xAxis2)与右方纵轴(yAxis2),并与xAxis/yAxis保持同步

    customPlot->axisRect()->setupFullAxesBox(true);

    // 生成x-y数据, y=x^2, 定义域[-1,1]

    QVector<double> x(101), y(101);

    for (int i = 0; i < 101; ++i)

    {

        x[i] = i/50.0 - 1;

        y[i] = x[i]*x[i];

    }

    // 新建QCPGraph对象,并设置绘图数据

    customPlot->addGraph();

    customPlot->graph(0)->setData(x, y);

    // 设置标题

    customPlot->plotLayout()->insertRow(0);

    customPlot->plotLayout()->addElement(0, 0, new QCPTextElement(customPlot, "Test-Title", QFont("sans", 17, QFont::Bold)));

    // 设置坐标轴标签

    customPlot->xAxis->setLabel("x");

    customPlot->yAxis->setLabel("y");

    // 设置坐标轴范围

    customPlot->xAxis->setRange(-1, 1);

    customPlot->yAxis->setRange(0, 1);

    // 刷新显示

    customPlot->replot();

}
绘制效果:

4. 绘制多条 x-y 曲线
demoPlot() 函数如下:
void demoPlot(QCustomPlot *customPlot)

{

    // 显示上方横轴(xAxis2)与右方纵轴(yAxis2),并与xAxis/yAxis保持同步

    customPlot->axisRect()->setupFullAxesBox(true);

    // 生成x-y数据,y1=x^2,y2=x^3,定义域[-1,1]

    QVector<double> x(101), y1(101), y2(101);

    for (int i = 0; i < 101; ++i)

    {

        x[i] = i/50.0 - 1;

        y1[i] = x[i]*x[i];

        y2[i] = x[i]*x[i]*x[i];

    }

    // 新建QCPGraph对象,并设置绘图数据x-y1

    customPlot->addGraph();

    customPlot->graph(0)->setPen(QPen(Qt::blue));

    customPlot->graph(0)->setData(x, y1);

    customPlot->graph(0)->setName(QStringLiteral("二次曲线图例"));

    // 新建QCPGraph对象,并设置绘图数据x-y2

    customPlot->addGraph();

    customPlot->graph(1)->setPen(QPen(Qt::red));

    customPlot->graph(1)->setData(x, y2);

    customPlot->graph(1)->setName(QStringLiteral("三次曲线图例"));

    // 显示图例

    customPlot->legend->setVisible(true);

    // 设置标题

    customPlot->plotLayout()->insertRow(0);

    customPlot->plotLayout()->addElement(0, 0, new QCPTextElement(customPlot, "Test-Title", QFont("sans", 17, QFont::Bold)));

    // 设置坐标轴标签

    customPlot->xAxis->setLabel("x");

    customPlot->yAxis->setLabel("y");

    // 设置坐标轴范围

    customPlot->xAxis->setRange(-1, 1);

    customPlot->yAxis->setRange(-1, 1);

    // 刷新显示

    customPlot->replot();

}
绘制效果:

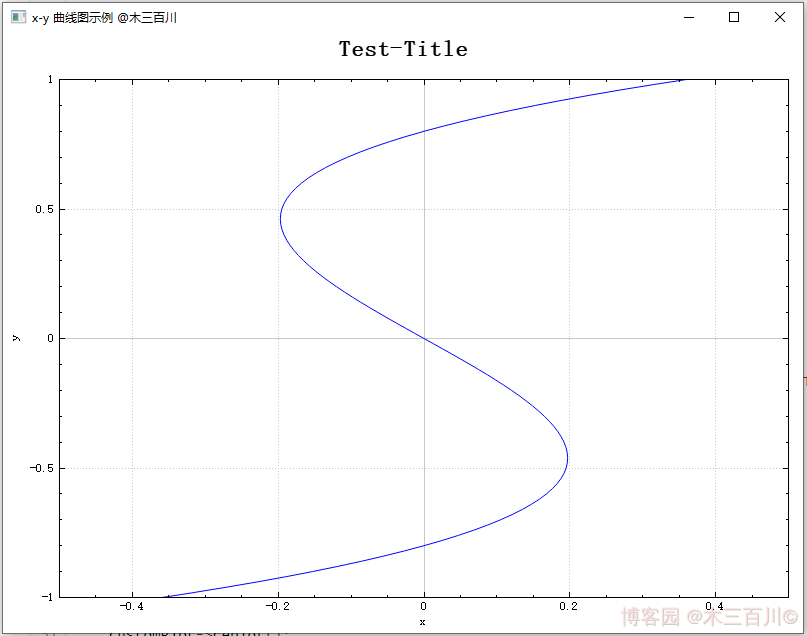
5. 绘制往回走的 x-y 曲线
举个例子,若需要绘制 \(x=(y+0.8)\times y\times (y-0.8),y\in [-1,1]\) 曲线,有三种方法:
- 方法一:新建
QCPGraph对象时,指定yAxis为keyAxis,指定xAxis为valueAxis,即互换一下坐标轴的角色,这是最靠谱也最常用的方法。 - 方法二:仍以
xAxis为keyAxis、yAxis为valueAxis(默认情况),但在调用setData()时,需传入第三个参数true。这是一种偷懒的做法,并且绘图的横轴数据(keyAxis)需满足一定的条件:keyData必须先递增再减小、且减小时不得离keyData[0]太近,否则绘图会出错。 - 方法三:导出绘图数据的内存地址,直接将数据写入内存中,这种做法常被用来提升 QCustomPlot 性能,缩短数据更新时间,但用此来绘制往回走的 x-y 曲线时,绘图的横轴数据也需要满足上面的条件,否则绘图会出错。
当曲线形成的环路很复杂时,一般采用绘制参数曲线的方法来表现,详见 Documentation - QCPCurve 或本人同系列文章。
5.1 靠谱方法:互换 x-y 轴
demoPlot() 函数如下:
void demoPlot(QCustomPlot *customPlot)

{

    // 显示上方横轴(xAxis2)与右方纵轴(yAxis2),并与xAxis/yAxis保持同步

    customPlot->axisRect()->setupFullAxesBox(true);

    // 生成y-x数据, x=(y+0.8)*y*(y-0.8), 定义域[-1,1]

    QVector<double> x(101), y(101);

    for (int i = 0; i < 101; ++i)

    {

        y[i] = i/50.0 - 1;

        x[i] = (y[i]+0.8)*y[i]*(y[i]-0.8);

    }

    // 新建QCPGraph对象(互换xAxis/yAxis),并设置绘图数据

    customPlot->addGraph(customPlot->yAxis, customPlot->xAxis);

    customPlot->graph(0)->setData(y, x);

    // 设置标题

    customPlot->plotLayout()->insertRow(0);

    customPlot->plotLayout()->addElement(0, 0, new QCPTextElement(customPlot, "Test-Title", QFont("sans", 17, QFont::Bold)));

    // 设置坐标轴标签

    customPlot->xAxis->setLabel("x");

    customPlot->yAxis->setLabel("y");

    // 设置坐标轴范围

    customPlot->xAxis->setRange(-0.5, 0.5);

    customPlot->yAxis->setRange(-1, 1);

    // 刷新显示

    customPlot->replot();

}
绘制效果:

5.2 偷懒方法:设置 alreadySorted = true
demoPlot() 函数如下:
void demoPlot(QCustomPlot *customPlot)

{

    // 显示上方横轴(xAxis2)与右方纵轴(yAxis2),并与xAxis/yAxis保持同步

    customPlot->axisRect()->setupFullAxesBox(true);

    // 生成y-x数据, x=(y+0.8)*y*(y-0.8), 定义域[-1,1]

    QVector<double> x(101), y(101);

    for (int i = 0; i < 101; ++i)

    {

        y[i] = i/50.0 - 1;

        x[i] = (y[i]+0.8)*y[i]*(y[i]-0.8);

    }

    // 新建QCPGraph对象,并设置绘图数据以及 alreadySorted = true

    customPlot->addGraph();

    customPlot->graph(0)->setData(x, y, true);

    // 设置标题

    customPlot->plotLayout()->insertRow(0);

    customPlot->plotLayout()->addElement(0, 0, new QCPTextElement(customPlot, "Test-Title", QFont("sans", 17, QFont::Bold)));

    // 设置坐标轴标签

    customPlot->xAxis->setLabel("x");

    customPlot->yAxis->setLabel("y");

    // 设置坐标轴范围

    customPlot->xAxis->setRange(-0.5, 0.5);

    customPlot->yAxis->setRange(-1, 1);

    // 刷新显示

    customPlot->replot();

}
绘制效果:

注意这张图中,keyData (横轴)满足先递增再减小、且减小时的最小值(约为 -0.197)大于 keyData[0](约为 -0.360),所以绘制没有出错。有兴趣的可以尝试一下,当横轴数据减小且比较接近 keyData[0] 时,绘制的效果。
5.3 备用方法:导出绘图数据内存地址
关于如何导出一维绘图数据的内存地址,详见本人另一篇文章 【QCustomPlot】性能提升之修改源码(版本 V2.x.x)。demoPlot() 函数如下:
void demoPlot(QCustomPlot *customPlot)

{

    // 显示上方横轴(xAxis2)与右方纵轴(yAxis2),并与xAxis/yAxis保持同步

    customPlot->axisRect()->setupFullAxesBox(true);

    // 新建QCPGraph对象,获得绘图数据的内存地址,并设置绘图数据

    customPlot->addGraph();

    QVector<QCPGraphData> *mData = customPlot->graph(0)->data()->coreData();

    mData->reserve(101);

    mData->resize(101);

    for (int i = 0; i < 101; ++i)

    {

        double y = i/50.0 - 1;

        (*mData)[i].key = (y+0.8)*y*(y-0.8);

        (*mData)[i].value = y;

    }

    // 设置标题

    customPlot->plotLayout()->insertRow(0);

    customPlot->plotLayout()->addElement(0, 0, new QCPTextElement(customPlot, "Test-Title", QFont("sans", 17, QFont::Bold)));

    // 设置坐标轴标签

    customPlot->xAxis->setLabel("x");

    customPlot->yAxis->setLabel("y");

    // 设置坐标轴范围

    customPlot->xAxis->setRange(-0.5, 0.5);

    customPlot->yAxis->setRange(-1, 1);

    // 刷新显示

    customPlot->replot();

}
绘制效果:
6. 绘制间隙中断的 x-y 曲线
当 keyAxis 数据中存在 NaN 时,绘制曲线会出现间隙中断的效果,demoPlot() 函数如下:
void demoPlot(QCustomPlot *customPlot)

{

    // 显示上方横轴(xAxis2)与右方纵轴(yAxis2),并与xAxis/yAxis保持同步

    customPlot->axisRect()->setupFullAxesBox(true);

    // 生成x-y数据, y=x^2, 定义域[-1,1]

    QVector<double> x(101), y(101);

    for (int i = 0; i < 101; ++i)

    {

        x[i] = i/50.0 - 1;

        y[i] = x[i]*x[i];

    }

    y[30] = qQNaN();

    y[60] = std::numeric_limits<double>::quiet_NaN();

    // 新建QCPGraph对象,并设置绘图数据

    customPlot->addGraph();

    customPlot->graph(0)->setData(x, y);

    // 设置标题

    customPlot->plotLayout()->insertRow(0);

    customPlot->plotLayout()->addElement(0, 0, new QCPTextElement(customPlot, "Test-Title", QFont("sans", 17, QFont::Bold)));

    // 设置坐标轴标签

    customPlot->xAxis->setLabel("x");

    customPlot->yAxis->setLabel("y");

    // 设置坐标轴范围

    customPlot->xAxis->setRange(-1, 1);

    customPlot->yAxis->setRange(0, 1);

    // 刷新显示

    customPlot->replot();

}
绘制效果:

【QCustomPlot】绘制 x-y 曲线图的更多相关文章
- Python绘制3d螺旋曲线图实例代码
Axes3D.plot(xs, ys, *args, **kwargs) 绘制2D或3D数据 参数 描述 xs, ys X轴,Y轴坐标定点 zs Z值,每一个点的值都是1 zdir 绘制2D集合时使用 ...
- Python教程:matplotlib 绘制双Y轴曲线图
前言 本文的文字及图片来源于网络,仅供学习.交流使用,不具有任何商业用途,版权归原作者所有,如有问题请及时联系我们以作处理. 作者:数据皮皮侠 双X轴的可以理解为共享y轴 ax1=ax.twiny() ...
- Android之使用AchartEngineActivity引擎绘制柱状图、曲线图
1.简介 AChartEngine(简称ACE)是Google的一个开源图表库(for Android).它功能强大,支持散点图.折线 .关于里面类的具体使用,请下载响应的文档说明(主页上有). 2. ...
- Origin绘制双Y轴图的方法
1.已有数据绘图如下,其中网络流量的单位是M Bytes/s,与另外两组数据的单位(时间)不同,现在要为其添加右侧Y轴. 2.首先选中该图像,找到工具条,点击第三个按钮“Add Right-Y Lay ...
- 绘制函数 y=x^2-2x-3/2x^2+2x+1 的曲线
代码: <!DOCTYPE html> <html lang="utf-8"> <meta http-equiv="Content-Type ...
- 绘制函数y=(x^2-2x+1)/(x^2+x+2)的曲线
代码: <!DOCTYPE html> <html lang="utf-8"> <meta http-equiv="Content-Type ...
- matplotlib 绘制正余弦曲线图
1.普通风格 代码 import numpy as npimport matplotlib.pyplot as plt x = np.linspace(0, 2*np.pi, 50)y1 = np.s ...
- QCustomPlot 使用整理
QCustomPlot 是一个比较小的 QT 图表插件.使用时,我们在程序中写完相关调用的代码后,只需将 QCunstomPlot.cpp 和 QCustomPlot.h 两个文件加入工程,正常编译即 ...
- matlab绘制二维图形
常用的二维图形命令: plot:绘制二维图形 loglog:用全对数坐标绘图 semilogx:用半对数坐标(X)绘图 semilogy:用半对数坐标(Y)绘图 fill:绘制二维多边填充图形 pol ...
- MATLAB曲线绘制
一. 二维数据曲线图1.1 绘制 单根二维曲线plot 函数的基本调用 格式为:plot(x,y) 其中x和y为长度相同的向量,分别用于存储x坐标 和y坐标数据. 例1-1 在0≤x≤2p区间内,绘制 ...
随机推荐
- Linux 大文件按大小切割,合并还原
工作中,由于堡垒机限制,大文件无法上传,故产生切割大文件上传后合并还原的需求. 不说废话,直接上干货: 切割: 1.1G文件,切割为200M大小的几个文件: split ...
- Python的函数和方法如何区分呢?
结论>>>:无论是函数还是方法都用def关键字来定义 方法:只要是自动传值都是方法.由谁来调用.会把自身传入 函数:有几个值就传几个值否则会报错 目录 一.详细介绍函数和方法 二.用 ...
- kubernetes(k8s)安装BGP模式calico网络支持IPV4和IPV6
kubernetes(k8s)安装BGP模式calico网络支持IPV4和IPV6 BGP是互联网上一个核心的去中心化自治路由协议,它通过维护IP路由表或"前缀"表来实现自治系统A ...
- 【性能优化】优雅地优化慢查询:缓存+SQL修改组合拳
问题描述 单例数据库模式中,后端高并发请求多(读多写少),导致数据库压力过大,关键接口响应变慢,严重影响体验. 需求 减少接口的响应时间. 寻找解决方案 由于问题主要处在数据库压力过大的情况,采用两种 ...
- ServletContext 详解(转载)
转载:https://www.cnblogs.com/zjdxr-up/p/7761813.html ServletContext,是一个全局的储存信息的空间,服务器开始,其就存在,服务器关闭,其才释 ...
- Podman Desktop安装与使用-Windows10
Podman Desktop安装与使用-Windows10 下载 containers/podman 地址 Podman Desktop Downloads 地址 我这里演示的是podman-v4.4 ...
- Java关键字以及标识符
Java中有许多关键字,关键字是什么意思呢? 我用自己的分析来表达一下吧. Java就是源自于生活的,我们都有自己的名字.所以它也会有许多的名字,每个名字都有各自不同的特性(作用),都是系统定义好的. ...
- cocos2dx返回Android游戏黑屏解决办法
用来解决返回Android游戏加载资源时黑屏的问题.帖子过些日子估计就沉了,所以转出来,以供后面查询. 需要修改三个文件: 1) cocos2dx/platform/CCPlatformMacros. ...
- 利用Velero对K8S备份还原与集群迁移实战
一.简介 Velero 是一款云原生时代的灾难恢复和迁移工具,采用 Go 语言编写,并在 github 上进行了开源,利用 velero 用户可以安全的备份.恢复和迁移 Kubernetes 集群资源 ...
- PowerBI(一) : 如何将powerBI报表嵌入内部web应用程序?
最近做了一个PowerBI报表嵌入内部web应用系统的项目,分享一下主要步骤以及踩坑记录. 微软官网完整教程这里:https://learn.microsoft.com/zh-cn/power-bi/ ...