python-pandas-1
series
Series 是pandas两大数据结构中(DataFrame,Series)的一种。
创建Series
Series的定义:Series是一种类似于一维数组的对象,它由一组数据(各种NumPy数据类型)以及一组与之相关的数据标签(即索引)组成。
Series对象本质上是一个NumPy的数组,因此NumPy的数组处理函数可以直接对Series进行处理。但是Series除了可以使用位置作为下标存取元素之外,还可以使用标签下标存取元素,这一点和字典相似。每个Series对象实际上都由两个数组组成:
index: 它是从NumPy数组继承的Index对象,保存标签信息。
values: 保存值的NumPy数组。
注意三点:
Series是一种类似于一维数组(数组:ndarray)的对象
它的数据类型没有限制(各种NumPy数据类型)
它有索引,把索引当做数据的标签(key)看待,这样就类似字典了(只是类似,实质上市数组)
4.Series同时具有数组和字典的功能,因此它也支持一些字典的方法
创建数组,例如:
In [1]:arr=[1,2,3,4] #创建数组

In [2]:arr

Out[2]: [1, 2, 3, 4]
创建Series:
series_1=Series(arr)

series_1

Out[146]:

0    1

1    2

2    3

3    4

dtype: int64

series_2=Series([1,2,3,4])

series_2

Out[148]:

0    1

1    2

2    3

3    4

dtype: int64
创建包含多种数据类型的Series:
series_3=Series([1,2,'3',4,'a'])  #包含数字和字符串

series_3

Out[150]:

0    1

1    2

2    3

3    4

4    a

dtype: object  #类型变成了字符串
Series索引
Series创建后会自动生成索引,默认从0开始
可以指定和修改索引
In [154]: series_4.index=['a','b','c']

In [155]: series_4

Out[155]:

a    1

b    2

c    3
修改索引除了这里的直接修改还有一个reindex()方法。
Series增删改
Series创建后可以对数据进行增删改查
增
Series的add()方法是加法计算不是增加Series元素用的。
使用append连接其他Series
删
In [162]: series_4.drop('a')

Out[162]:

b    2

c    3

dtype: int64
改
In [170]: series_4['a']=4

In [171]: series_4

Out[171]:

a    4

b    2

c    3

dtype: int64
查
通过索引查单值
In [172]: series_4['a']

Out[172]: 4
通过索引序列查多值:
series_4[['a','b']]

Out[174]:

a    4

b    2

dtype: int64
通过布尔类型索引筛选:
In [175]: series_4[series_4>2]

Out[175]:

a    4

c    3

dtype: int64
通过位置切片和标签切片查询数据:
series_4

Out[194]:

a    4

b    2

c    3

dtype: int64

series_4[:2]

Out[195]:

a    4

b    2

dtype: int64

series_4['a':'c']

Out[196]:

a    4

b    2

c    3

dtype: int64
通过字典创建Series
series_5=Series({'a':1,'b':2,'c':3})

series_5

Out[201]:

a    1

b    2

c    3

dtype: int64
dataframe
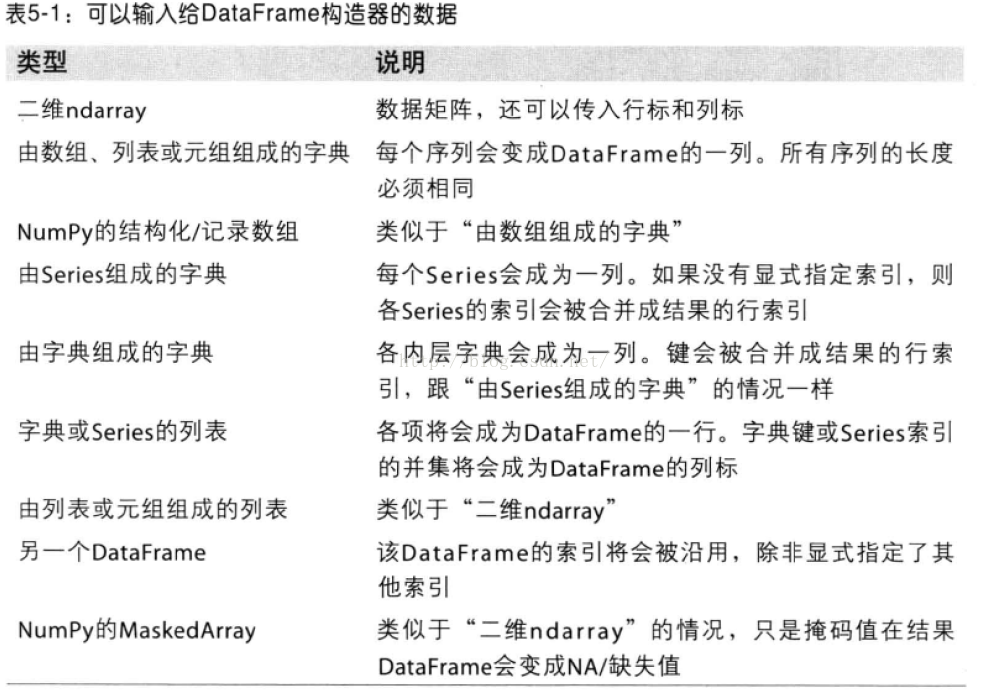
这一部分主要学习pandas中基于前面两种数据结构的基本操作。设有DataFrame结果的数据a如下所示:
       a  b  c

one    4  1  1

two    6  2  0

three  6  1  6
创建dataframe
1.标准格式创建
2.等长列表组成的字典来创建
3.嵌套字典(字典的值也是字典)创建
标准格式创建
DataFrame创建方法有很多,常用基本格式是:DataFrame 构造器参数:DataFrame(data=[],index=[],coloumns=[])
In [272]: df2=DataFrame(np.arange(16).reshape((4,4)),index=['a','b','c','d'],columns=['one','two','three','four'])

In [273]: df2

Out[273]:

   one  two  three  four

a    0    1      2     3

b    4    5      6     7

c    8    9     10    11

d   12   13     14    15
用传入等长列表组成的字典来创建
In [204]: data={'c':['1','2'],'a':['5']}  #创建不等长字典序列

In [205]: data

Out[205]: {'a': ['5'], 'c': ['1', '2']}

In [206]: df=DataFrame(data)

Traceback (most recent call last):

...

ValueError: arrays must all be same length   # 报错,传入的数组必须等长

In [207]: data={'c':['1','2'],'a':['5','6']}  #创建<strong>等长字典序列

In [208]: df=DataFrame(data)

In [209]: df

Out[209]:

   a  c                      # 创建完成后'a','c'自动按照字典序排序,并且创建时自定加上索引

0  5  1

1  6  2
创建完成后'a','c'自动按照字典序排序,并且创建时自定加上索引
如果指定了columns名称,则会按照指定顺序创建。
In [210]: df=DataFrame(data,columns=['c','a'])

In [211]: df

Out[211]:

   c  a    #按照指定顺序创建。

0  1  5

1  2  6
传入嵌套字典(字典的值也是字典)创建DataFrame
列名:嵌套字典的外层子键
索引:内层键
In [227]: nest_dict={'shanghai':{2015:100,2016:101},'beijing':{2015:102,2016:103}}

In [228]: nest_dict

Out[228]: {'beijing': {2015: 102, 2016: 103}, 'shanghai': {2015: 100, 2016: 101}}

In [229]: df1=DataFrame(nest_dict)

In [230]: df1

Out[230]:

      beijing  shanghai

2015      102       100

2016      103       101
查
查看对象的方法对于Series来说同样适用
1.查看DataFrame前xx行或后xx行
a=DataFrame(data);
a.head(6)表示显示前6行数据,若head()中不带参数则会显示全部数据。
a.tail(6)表示显示后6行数据,若tail()中不带参数则也会显示全部数据。
2.查看DataFrame的index,columns以及values
a.index ; a.columns ; a.values 即可
3.describe()函数对于数据的快速统计汇总
a.describe()对每一列数据进行统计,包括计数,均值,std,各个分位数等。
4.对数据的转置
a.T
5.对轴进行排序
a.sort_index(axis=1,ascending=False);
其中axis=1表示对所有的columns进行排序,下面的数也跟着发生移动。后面的ascending=False表示按降序排列,参数缺失时默认升序。
6.对DataFrame中的值排序
a.sort(columns='x')
即对a中的x这一列,从小到大进行排序。注意仅仅是x这一列,而上面的按轴进行排序时会对所有的columns进行操作。
增
为不存在的列赋值会创建新列
In [219]: df['b']=1

In [220]: df

Out[220]:

   c  a  b

0  1  5  1

1  2  6  1
删
#用del删除

In [225]: del df['a']

In [226]: df

Out[226]:

   c  b

0  1  1

1  2  1
用drop() 删除
用drop删除时,删的是视图,并没有真正删除。
In [258]: df

Out[258]:

   c  b  0

0  5  1  6

1  5  1  6

In [259]: df.drop(0,axis=1) #删除列Out[259]:

   c  b

0  5  1

1  5  1

In [260]: df  # df的数据并没有改动

Out[260]:

   c  b  0

0  5  1  6

1  5  1  6
dorp()可以通过axis(行:axis=0 ,列:axis=1)可以控制删除行或列,默认是行。
dorp()也可以同时删除多行或多列
例:
In [271]: df.drop([0,1],axis=1)

Out[271]:

   c  b

0  6  6

1  5  1
改
赋值进行修改,可以通过定位到行,列,或者具体位置进行赋值修改。
#修改具体元素值:

In [242]: df['c'][1]=4

In [243]: df

Out[243]:

   c  b

0  1  1

1  4  1
#修改列

In [244]: df['c']=5

In [245]: df

Out[245]:

   c  b

0  5  1

1  5  1
#修改行

df[:1]=6

df

Out[266]:

   c  b

0  6  6

1  5  1
修改行和列如果传入一组值得话,注意传入数组的长度,如果传入数组长度大于len(df) 则截断,小于df长度则置NaN
In [267]: df[0]=Series([1,2,3])

In [268]: df

Out[268]:

   c  b  0

0  6  6  1

1  5  1  2

In [269]: df[1]=Series([1,])  #增加一列,传入一个值

In [270]: df

Out[270]:

   c  b  0   1

0  6  6  1   1

1  5  1  2 NaN
选择对象
选择特定列和行的数据
a['x'] 那么将会返回columns为x的列,注意这种方式一次只能返回一个列。a.x与a['x']意思一样。
取行数据,通过切片[]来选择
如:a[0:3] 则会返回前三行的数据。loc是通过标签来选择数据
a.loc['one']则会默认表示选取行为'one'的行;
a.loc[:,['a','b'] ] 表示选取所有的行以及columns为a,b的列;
a.loc[['one','two'],['a','b']] 表示选取'one'和'two'这两行以及columns为a,b的列;
a.loc['one','a']与a.loc[['one'],['a']]作用是一样的,不过前者只显示对应的值,而后者会显示对应的行和列标签。
iloc则是直接通过位置来选择数据
这与通过标签选择类似
a.iloc[1:2,1:2] 则会显示第一行第一列的数据;(切片后面的值取不到)a.iloc[1:2] 即后面表示列的值没有时,默认选取行位置为1的数据;
a.iloc[[0,2],[1,2]] 即可以自由选取行位置,和列位置对应的数据。
使用条件来选择
使用单独的列来选择数据
a[a.c>0] 表示选择c列中大于0的数据使用where来选择数据
a[a>0] 表直接选择a中所有大于0的数据使用isin()选出特定列中包含特定值的行
a1=a.copy()
a1[a1['one'].isin(['2','3'])] 表显示满足条件:列one中的值包含'2','3'的所有行。
设置值(赋值)
赋值操作在上述选择操作的基础上直接赋值即可。
例
a.loc[:,['a','c']]=9 即将a和c列的所有行中的值设置为9
a.iloc[:,[1,3]]=9 也表示将a和c列的所有行中的值设置为9
同时也依然可以用条件来直接赋值
a[a>0]=-a 表示将a中所有大于0的数转化为负值
缺失值处理
在pandas中,使用np.nan来代替缺失值,这些值将默认不会包含在计算中。
reindex()方法
用来对指定轴上的索引进行改变/增加/删除操作,这将返回原始数据的一个拷贝。
a.reindex(index=list(a.index)+['five'],columns=list(a.columns)+['d'])a.reindex(index=['one','five'],columns=list(a.columns)+['d'])
即用index=[]表示对index进行操作,columns表对列进行操作。
对缺失值进行填充
a.fillna(value=x)
表示用值为x的数来对缺失值进行填充去掉包含缺失值的行
a.dropna(how='any')
表示去掉所有包含缺失值的行
合并
contact
contact(a1,axis=0/1,keys=['xx','xx','xx',...])其中a1表示要进行进行连接的列表数据,axis=1时表横着对数据进行连接。axis=0或不指定时,表将数据竖着进行连接。a1中要连接的数据有几个则对应几个keys,设置keys是为了在数据连接以后区分每一个原始a1中的数据。
例:
a1=[b['a'],b['c']]
result=**pd.concat**(a1,axis=1,keys=['1','2'])Append 将一行或多行数据连接到一个DataFrame上
a.append(a[2:],ignore_index=True)
表示将a中的第三行以后的数据全部添加到a中,若不指定ignore_index参数,则会把添加的数据的index保留下来,若ignore_index=Ture则会对所有的行重新自动建立索引。merge类似于SQL中的join
设a1,a2为两个dataframe,二者中存在相同的键值,两个对象连接的方式有下面几种:
(1)内连接,pd.merge(a1, a2, on='key')
(2)左连接,pd.merge(a1, a2, on='key', how='left')
(3)右连接,pd.merge(a1, a2, on='key', how='right')
(4)外连接,pd.merge(a1, a2, on='key', how='outer')
至于四者的具体差别,具体学习参考sql中相应的语法。
分组(groupby)
用pd.date_range函数生成连续指定天数的的日期pd.date_range('20000101',periods=10)
def shuju():

    data={

        'date':pd.date_range('20000101',periods=10),

        'gender':np.random.randint(0,2,size=10),

        'height':np.random.randint(40,50,size=10),

        'weight':np.random.randint(150,180,size=10)

    }

a=DataFrame(data)

print(a)

        date  gender  height  weight

0 2000-01-01       0      47     165

1 2000-01-02       0      46     179

2 2000-01-03       1      48     172

3 2000-01-04       0      45     173

4 2000-01-05       1      47     151

5 2000-01-06       0      45     172

6 2000-01-07       0      48     167

7 2000-01-08       0      45     157

8 2000-01-09       1      42     157

9 2000-01-10       1      42     164
用a.groupby('gender').sum()得到的结果为:
 #注意在python中groupby(''xx)后要加sum(),不然显示不了数据对象。

gender     height  weight

0           256     989

1           170     643
用a.groupby('gender').size()可以对各个gender下的数目进行计数。
可以看到groupby的作用相当于:
按gender对gender进行分类,对应为数字的列会自动求和,而为字符串类型的列则不显示;当然也可以同时groupby(['x1','x2',...])多个字段,其作用与上面类似。
groupby().max()

groupby().min()

groupby().mean()

groupby().sum()
排序
按1列排序
(1)升序
frame.sort(columns = ['a'],axis = 0,ascending = True)

Out[62]:

   a  b  c

3  1  2  3

1  2  7  5

2  5 -3  8

0  9  4  6

frame.sort_index(axis = 0,ascending = True,by = 'a')

Out[63]:

   a  b  c

3  1  2  3

1  2  7  5

2  5 -3  8

0  9  4  6

frame.sort_values(by = 'a',axis = 0,ascending = True)

Out[65]:

   a  b  c

3  1  2  3

1  2  7  5

2  5 -3  8

0  9  4  6
(2)降序
frame.sort(columns = ['a'],axis = 0,ascending = False)

Out[67]:

   a  b  c

0  9  4  6

2  5 -3  8

1  2  7  5

3  1  2  3

frame.sort_index(axis = 0,ascending = False,by = 'a')

Out[68]:

   a  b  c

0  9  4  6

2  5 -3  8

1  2  7  5

3  1  2  3

frame.sort_values(by = 'a',axis = 0,ascending = False)

Out[69]:

   a  b  c

0  9  4  6

2  5 -3  8

1  2  7  5

3  1  2  3
按多列排序
frame = pandas.DataFrame({"a":[9,2,5,1,0,7],"b":[4,7,-3,2,2,2],"c":[6,5,8,3,4,4]})

frame

Out[73]:

   a  b  c

0  9  4  6

1  2  7  5

2  5 -3  8

3  1  2  3

4  0  2  4

5  7  2  4
(1) 升序
 frame.sort(columns = ['b','c','a'],axis = 0,ascending = True)

Out[74]:

   a  b  c

2  5 -3  8

3  1  2  3

4  0  2  4

5  7  2  4

0  9  4  6

1  2  7  5

frame.sort_index(axis = 0,ascending = True,by = ['b','c','a'])

Out[75]:

   a  b  c

2  5 -3  8

3  1  2  3

4  0  2  4

5  7  2  4

0  9  4  6

1  2  7  5

frame.sort_values(by = ['b','c','a'],axis = 0,ascending = True)

Out[76]:

   a  b  c

2  5 -3  8

3  1  2  3

4  0  2  4

5  7  2  4

0  9  4  6

1  2  7  5
(2) 降序
frame.sort(columns = ['b','c','a'],axis = 0,ascending = False)

Out[77]:

   a  b  c

1  2  7  5

0  9  4  6

5  7  2  4

4  0  2  4

3  1  2  3

2  5 -3  8

frame.sort_index(axis = 0,ascending = False,by = ['b','c','a'])

Out[78]:

   a  b  c

1  2  7  5

0  9  4  6

5  7  2  4

4  0  2  4

3  1  2  3

2  5 -3  8

frame.sort_values(by = ['b','c','a'],axis = 0,ascending = False)

Out[79]:

   a  b  c

1  2  7  5

0  9  4  6

5  7  2  4

4  0  2  4

3  1  2  3

2  5 -3  8
按行排序
data = {"b":[4,7,-3,2,2,2],"a":[9,2,5,1,0,7],"c":[6,5,8,3,4,4]}

frame = pandas.DataFrame(data,columns = ['b','a','c'])

frame

Out[90]:

   b  a  c

0  4  9  6

1  7  2  5

2 -3  5  8

3  2  1  3

4  2  0  4

5  2  7  4
(1) 按行升序
 frame.sort_index(axis = 1,ascending = True)

Out[91]:

   a  b  c

0  9  4  6

1  2  7  5

2  5 -3  8

3  1  2  3

4  0  2  4

5  7  2  4
(2) 按行降序
frame.sort_index(axis = 1,ascending = False)

Out[97]:

   c  b  a

0  6  4  9

1  5  7  2

2  8 -3  5

3  3  2  1

4  4  2  0

5  4  2  7
Categorical按某一列重新编码分类
如分组中中要对a中的gender进行greoupby重新编码分类,将对应的0,1转化为male,female,过程如下:
a['gender1']=a['gender'].astype('category')

a['gender1'].cat.categories=['male','female']  #即将0,1先转化为category类型再进行编码。

 print(a)得到的结果为:

      date    gender  height  weight gender1

0 2000-01-01       1      40     163  female

1 2000-01-02       0      44     177    male

2 2000-01-03       1      40     167  female

3 2000-01-04       0      41     161    male

4 2000-01-05       0      48     177    male

5 2000-01-06       1      46     179  female

6 2000-01-07       1      42     154  female

7 2000-01-08       1      43     170  female

8 2000-01-09       0      46     158    male

9 2000-01-10       1      44     168  female
所以可以看出重新编码后的编码会自动增加到dataframe最后作为一列。
相关操作
描述性统计:
1.a.mean() 默认对每一列的数据求平均值;若加上参数a.mean(1)则对每一行求平均值;
2.统计某一列x中各个值出现的次数:a['x'].value_counts();
3.对数据应用函数
a.apply(lambda x:x.max()-x.min())
表示返回所有列中最大值-最小值的差。
4.字符串相关操作
a['gender1'].str.lower() 将gender1中所有的英文大写转化为小写,注意dataframe没有str属性,只有series有,所以要选取a中的gender1字段。
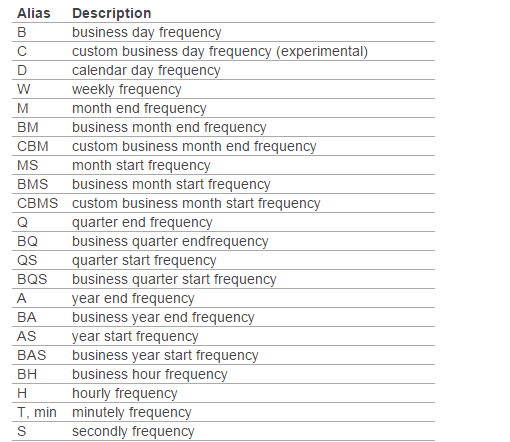
时间序列
用pd.date_range('xxxx',periods=xx,freq='D/M/Y....')函数生成连续指定天数的的日期列表。
例如
pd.date_range('20000101',periods=10),其中periods表示持续频数;
pd.date_range('20000201','20000210',freq='D')也可以不指定频数,只指定起始日期。
此外如果不指定freq,则默认从起始日期开始,频率为day。其他频率表示如下:
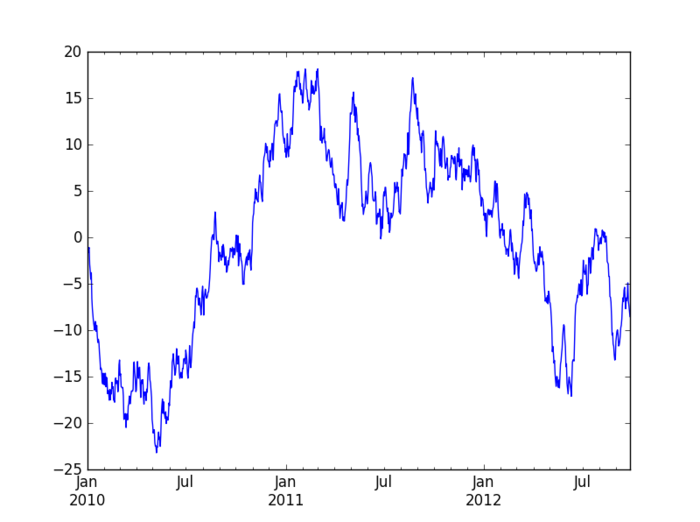
画图(plot)
在pycharm中首先要:import matplotlib.pyplot as plt

a=Series(np.random.randn(1000),index=pd.date_range('20100101',periods=1000))

b=a.cumsum()

b.plot()

plt.show()    #最后一定要加这个plt.show(),不然不会显示出图来。
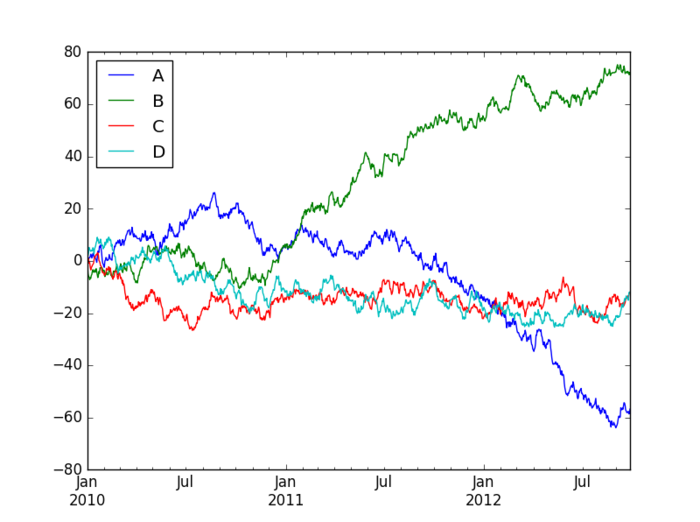
也可以使用下面的代码来生成多条时间序列图:
a=DataFrame(np.random.randn(1000,4),index=pd.date_range('20100101',periods=1000),columns=list('ABCD'))

b=a.cumsum()

b.plot()

plt.show()
导入和导出文件
写入和读取excel文件
虽然写入excel表时有两种写入xls和csv,但建议少使用csv,不然在表中调整数据格式时,保存时一直询问你是否保存新格式,很麻烦。而在读取数据时,如果指定了哪一张sheet,则在pycharm又会出现格式不对齐。
还有将数据写入表格中时,excel会自动给你在表格最前面增加一个字段,对数据行进行编号。
时间序列列表
import pandas as pd

from datetime import datetime

def datelist(beginDate, endDate): # beginDate,endDate是形如‘20160601’的字符串或datetime格式

    date_l=[datetime.strftime(x,'%Y-%m-%d')

        for x in list(pd.date_range(start=beginDate, end=endDate))]

    return date_l
python-pandas-1的更多相关文章
- python & pandas链接mysql数据库
Python&pandas与mysql连接 1.python 与mysql 连接及操作,直接上代码,简单直接高效: import MySQLdb try: conn = MySQLdb.con ...
- Python pandas ERROR 2006 (HY000): MySQL server has gone away
之前在做python pandas大数据分析的时候,在将分析后的数据存入mysql的时候报ERROR 2006 (HY000): MySQL server has gone away 原因分析:在对百 ...
- Python+Pandas 读取Oracle数据库
Python+Pandas 读取Oracle数据库 import pandas as pd from sqlalchemy import create_engine import cx_Oracle ...
- 看到篇博文,用python pandas改写了下
看到篇博文,https://blog.csdn.net/young2415/article/details/82795688 需求是需要统计部门礼品数量,自己简单绘制了个表格,如下: 大意是,每个部门 ...
- Python pandas快速入门
Python pandas快速入门2017年03月14日 17:17:52 青盏 阅读数:14292 标签: python numpy 数据分析 更多 个人分类: machine learning 来 ...
- Python pandas & numpy 笔记
记性不好,多记录些常用的东西,真·持续更新中::先列出一些常用的网址: 参考了的 莫烦python pandas DOC numpy DOC matplotlib 常用 习惯上我们如此导入: impo ...
- python. pandas(series,dataframe,index) method test
python. pandas(series,dataframe,index,reindex,csv file read and write) method test import pandas as ...
- oracle数据据 Python+Pandas 获取Oracle数据库并加入DataFrame
import pandas as pd import sys import imp imp.reload(sys) from sqlalchemy import create_engine impor ...
- Python Pandas找到缺失值的位置
python pandas判断缺失值一般采用 isnull(),然而生成的却是所有数据的true/false矩阵,对于庞大的数据dataframe,很难一眼看出来哪个数据缺失,一共有多少个缺失数据,缺 ...
- 【跟着stackoverflow学Pandas】 - Adding new column to existing DataFrame in Python pandas - Pandas 添加列
最近做一个系列博客,跟着stackoverflow学Pandas. 以 pandas作为关键词,在stackoverflow中进行搜索,随后安照 votes 数目进行排序: https://stack ...
随机推荐
- linux mysql-5.7.26 安装全记录
买了个阿里云,自己折腾一下. 时间:2019年7月17日13:40:18 1.下载 wget https://cdn.mysql.com//Downloads/MySQL-5.7/mysql-5.7. ...
- python爬虫下正则各种字符串数据匹配
s = '*\/:?"<>|' #这9个字符在Windows系统下是不可以出现在文件名中的str1 = '\巴拉<1"!11[]>1*hgn/p:?|' # ...
- vue开发后台管理系统有感
使用vue开发后台近一个月,今天终于完成得差不多了,期间也遇到很多的问题,所以利用现在的闲暇时间做个总结 使用element-ui基础,这次使用了vue-element-admin(github地址) ...
- 转载: Linux查看系统开机时间
转自: https://www.cnblogs.com/kerrycode/p/3759395.html 查看Linux系统运行了多久时间,此时需要知道上次开机启动时间: 有时候由于断电或供电故障突然 ...
- vbox的四种网络模式
一.NAT模式 特点: 1.如果主机可以上网,虚拟机可以上网 2.虚拟机之间不能ping通 3.虚拟机可以ping通主机(此时ping虚拟机的网关,即是ping主机) 4.主机不能ping通虚拟机 ...
- ActiveMQ基础简介
1. 什么是ActiveMQ ActiveMQ 是Apache出品,最流行的,能力强劲的开源消息总线.ActiveMQ 是一个完全支持JMS1.1和J2EE 1.4规范的 JMS Provider实现 ...
- 【1】Zookeeper概述
一.前言 在"网络是不可靠的"这一前提下,分布式系统开发需要解决如下四个问题: 客户端如何访问众多服务? 解决方案:服务聚合,使用API网关 服务于服务之间如何通信? 解决方案 ...
- DNS负载均衡与NGINX负载均衡策略
负载均衡是指的是把请求均匀的分摊到多个服务器上处理.一般常见的负载均衡有两种:①客户端与反向代理服务器之间的DNS负载均衡②反向代理服务器与应用服务器之间的负载均衡(这种负载均衡有很多,可以是webl ...
- django_celery_results安装的坑
前言 在Celery4.0之前的版本中,有一个专门供Django使用的Celery版本django-celery.但现在Celery已经统一为一个版本,所以直接安装原生的Celery即可.这里就暂时 ...
- dfs序+RMQ求LCA详解
首先安利自己倍增求LCA的博客,前置(算不上)知识在此. LCA有3种求法:倍增求lca(上面qwq),树链剖分求lca(什么时候会了树链剖分再说.),还有,标题. 是的你也来和我一起学习这个了qwq ...