prometheus+grafana实现服务监控
一、安装prometheus:
下载相应的版本 :https://prometheus.io/download/
解压:
Linux:tar -zxvf XXX.tar.gz
windows:直接下载.ism 安装程序
mac:未使用过
进入到解压后的文件夹可以直接运行:
./prometheus --config.file=prometheus.yml
浏览器打开“http://localhost:9090” 访问

二、配置启动项
方法1 直接在prometheus.yml进行配置(监控内容较少的时候):
  - job_name: 'linux'

    static_configs:

    - targets: ['localhost:9104']
方法2 指定配置文件 :
# prometheus.yml 配置

  - job_name: 'Linux'

    file_sd_configs:

    - files: ['/opt/prometheus/sd_cfg/Linux.yml']
# /opt/prometheus/sd_cfg/Linux.yml 中文件配置

- targets: ['IP地址:9100']

  labels:

    name: Linux-node1[这里建议给每个主机打个有意义的标签,方便识别.]
配置文件检查命令(检查配置是否存在错误):
./promtool check config prometheus.yml
配置文件详解:
官方文档:https://prometheus.io/docs/prometheus/latest/configuration/configuration/
其他:https://www.cnblogs.com/liujiliang/p/10080849.html
https://www.cnblogs.com/xiangsikai/p/11288835.html
创建专用用户:
groupadd prometheus

useradd -g prometheus -m -d /opt/prometheus/ -s /sbin/nologin prometheus
二、配置 Linux系统监控
node_exporter 服务安装:
下载地址:https://github.com/prometheus/node_exporter/releases/
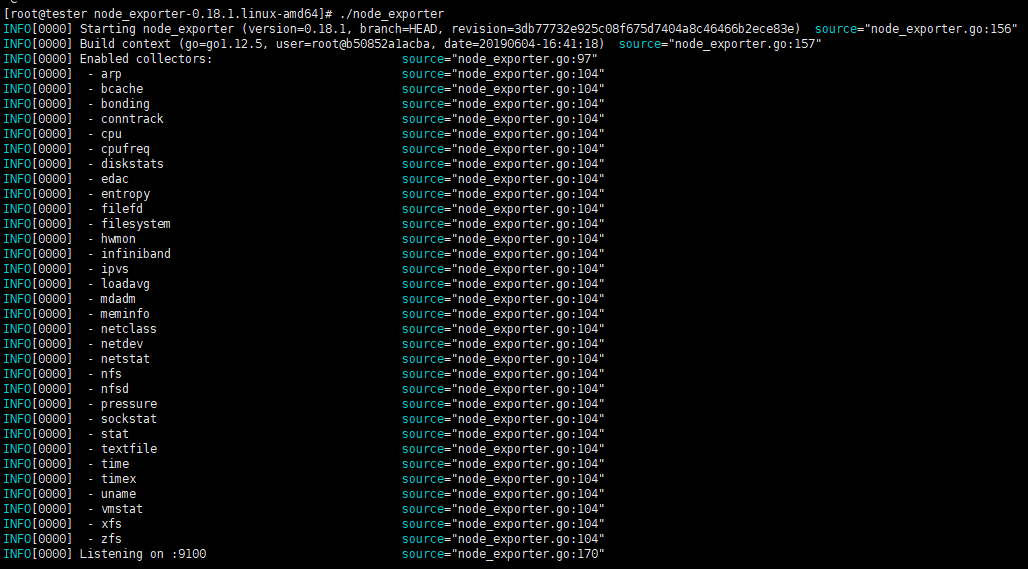
解压命令:tar -zxvf node_exporter-xxx.tar.gz

解压完成 进入解压文件夹: cd node_exporter-xxx

启动: ./node_exporter
成功效果
三、安装配置Grafana
下载地址:https://grafana.com/grafana/download
安装编译:yum localinstall grafana-xxx.rpm
安装完成访问 : http://localhost:3000
默认账号/密码:admin/admin

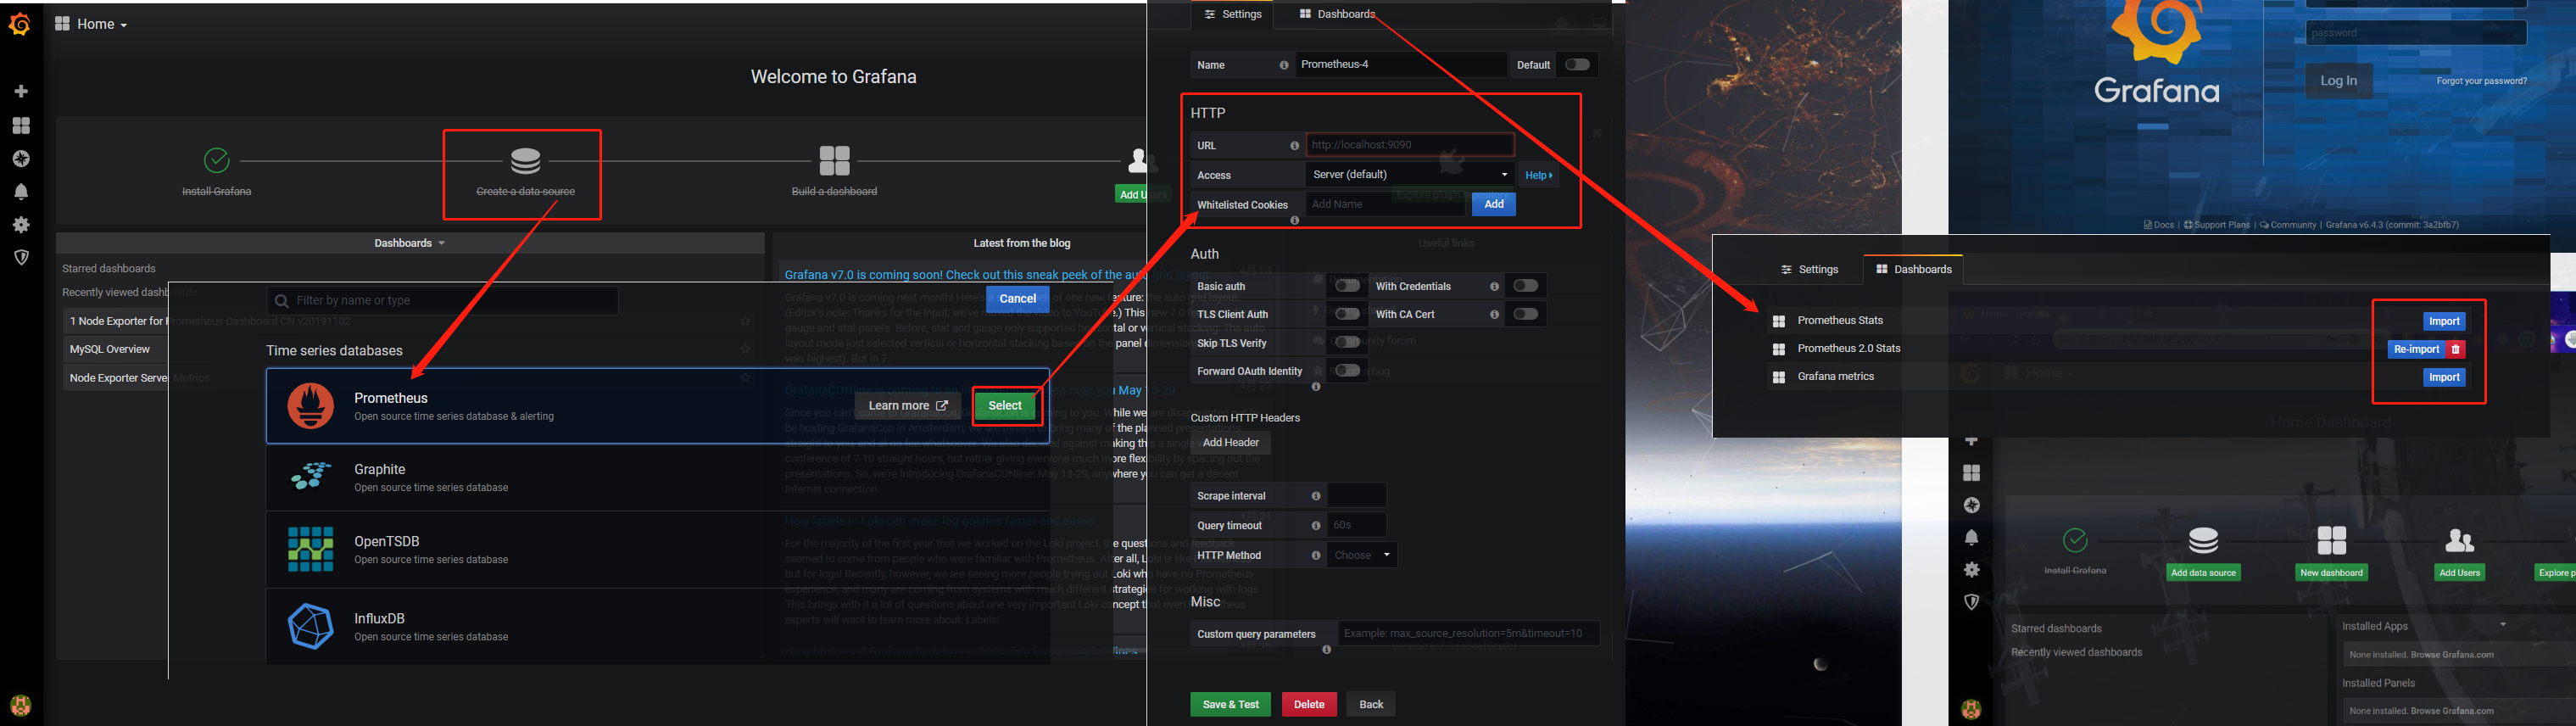
配置 node_exporter监控:
网址和服务名称填写就可以了。
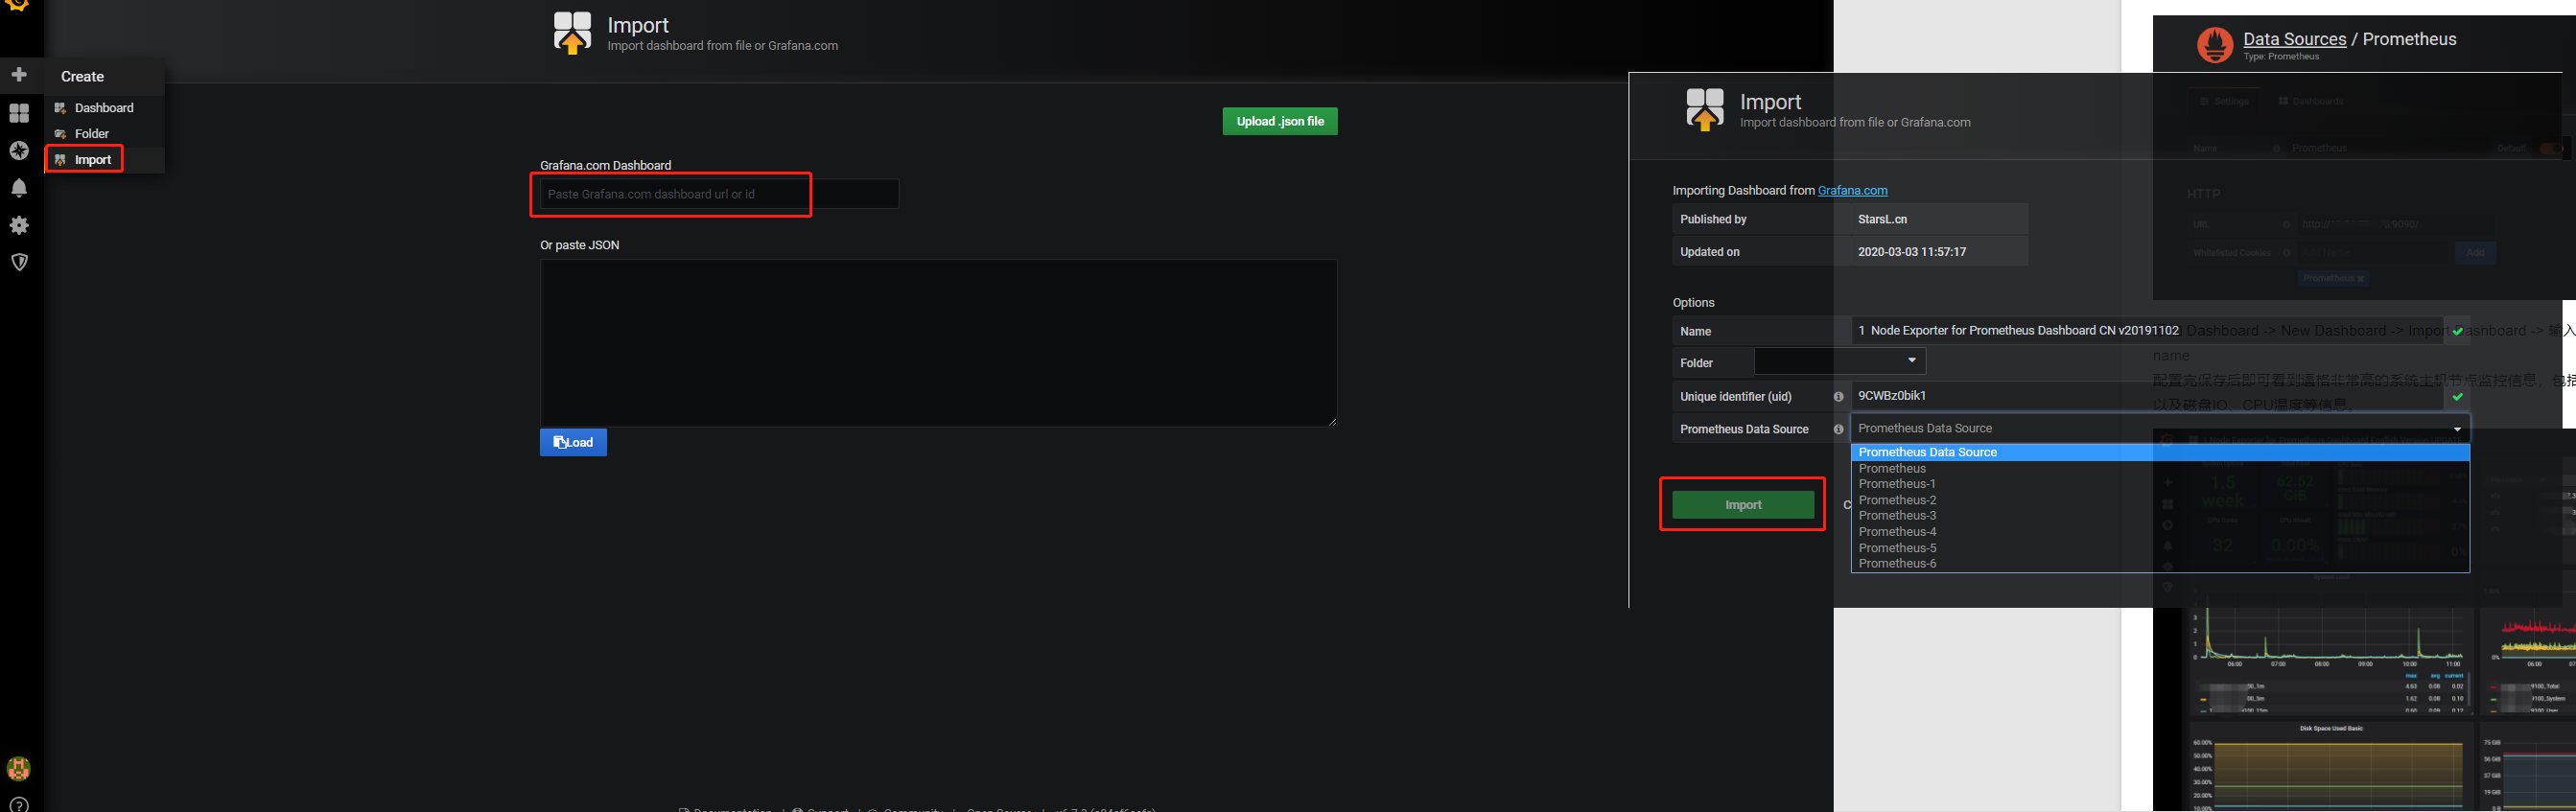
添加统计图模板:
模板网址:https://grafana.com/grafana/dashboards
找到模板ID
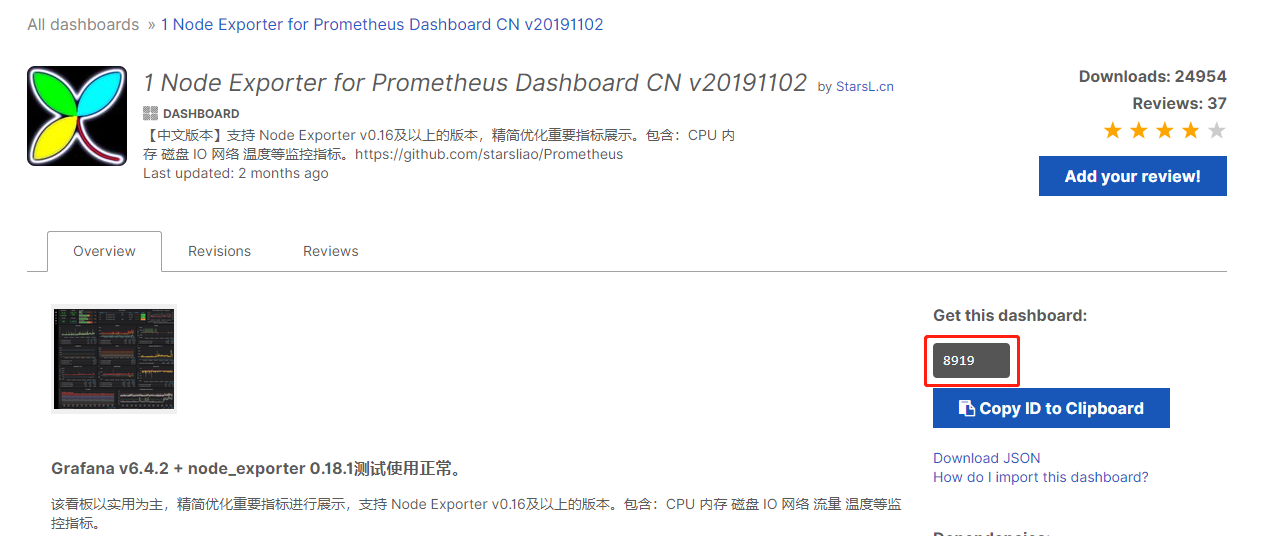
填写模板ID
效果:

教程地址:https://www.cnblogs.com/guoxiangyue/p/11772717.html
prometheus+grafana实现服务监控的更多相关文章
- prometheus + grafana部署RabbitMQ监控
prometheus + grafana部署RabbitMQ监控 1.grafana导入dashboards https://grafana.com/dashboards/2121 2.expor ...
- Prometheus+Grafana通过kafka_exporter监控kafka
Prometheus+Grafana通过kafka_exporter监控kafka 一.暴露 kafka-metric 方式 二.jmx_exporter方式 2.1 下载jmx_prometheus ...
- 【Prometheus+Grafana系列】监控MySQL服务
前言 前面的一篇文章已经介绍了 docker-compose 搭建 Prometheus + Grafana 服务.当时实现了监控服务器指标数据,是通过 node_exporter.Prometheu ...
- Prometheus+Grafana+Altermanager搭建监控系统
基本概念 Prometheus 时间序列化数据库,我的理解就是将数据打上标签,以时间维度存储.后面有机会在深入研究. Prometheus架构如下: Grafana Prometheus中存储的数据, ...
- SpringBoot+Prometheus+Grafana实现应用监控和报警
一.背景 SpringBoot的应用监控方案比较多,SpringBoot+Prometheus+Grafana是目前比较常用的方案之一.它们三者之间的关系大概如下图: 关系图 二.开发SpringBo ...
- nmon2influxdb+grafana:服务监控可视化部署
在工作中,无论是定位线上问题,还是性能优化,都需要对前端.后台服务进行监控.而及时的获取监控数据,能更好的帮助技术人员排查定位问题. 前面的博客介绍过服务端监控工具:Nmon使用方法及利用easyNm ...
- 使用prometheus+ grafana+nginx-module-vts 模块监控openresty
nginx-module-vts 是一个很不错的nginx 模块,我们可以用来,方便的分析系统的请求状态 同时支持基于prometheus 的监控, 我参考openresty 的docker镜像已 ...
- Prometheus+Grafana打造Mysql监控平台
prometheus/node_exporter/mysqld_exporter都是由go语言编写,需要先安装GoLang环境 下载node_exporter(监控服务器的CPU.内存.存储使用情况) ...
- 基于Prometheus+Grafana+AlertManager的监控系统
一.Prometheus 1.1 简介 Prometheus是一套开源的监控&报警&时间序列数据库的组合,基于应用的metrics来进行监控的开源工具 . 1.2 下载&安装 ...
随机推荐
- Linux部署PgSQL数据库
1.安装: yum install postgresql-server -y postgresql-setup initdb cd /var/lib/pgsql/data 2.进入 /var/lib/ ...
- CentOS7 安装Oracle12c数据库
在centos7上安装oracle是一个比较麻烦的事,在安装前需要做一些服务器的准备工作 我是在虚拟机里测试的所以需要下载centos7的镜像,可以去官网然后找到中国的镜像站用迅雷插件下载速度比较快这 ...
- HTTP状态码关于各个网站的实地调查
我使用的是新版Edge浏览器,右键,点击检查,点击网络,可以看到请求的各种文件.那么以此来看看状态码的使用吧. 101 与websocket相关,websocket在慕课网中的应用 - KeBoom ...
- 题解 P3643 [APIO2016]划艇
题解 一种思路很好想:\(f_{i,j}\) 表示前 \(i\) 所学校中,第 \(i\) 所学校参赛且派出 \(j\) 艘划艇的方案数.(转移就不列了.) 这种方式有一个致命点,就是 \(j\) 的 ...
- 源码安装nginx开启SSL功能
编译安装nginx的环境 yum -y install gcc zlib zlib-devel pcre-devel openssl openssl-devel 下载nginx安装包 cd /usr/ ...
- vue项目打包 部署nginx服务器 访问远程接口 本地json 跨域问题
本文建立在你已经在windows7上已经配好了nginx的前提下进行!!! 如果没有请移步至:https://www.cnblogs.com/jack1208-rose0203/p/5739765.h ...
- flink双流join
package com.streamingjoin import org.apache.flink.api.common.state.{ValueState, ValueStateDescriptor ...
- Asp.NetCore3.1 WebApi 获取配置json文件中的数据
下面只是做一个简单的测试: 1:定义好appsetting.Json文件的配置信息如下: { "Logging": { "LogLevel": { " ...
- Vulnhub靶机渗透 -- DC5
信息收集 通过nmap搜索到IP为:192.168.200.11 开启了80http.111RPC服务端口 先打开网页,然后进行目录爆破 contact.php 攻击 经搜索没有发现可以攻击wheel ...
- Linux从头学10:三级跳过程详解-从 bootloader 到 操作系统,再到应用程序
作 者:道哥,10+年的嵌入式开发老兵. 公众号:[IOT物联网小镇],专注于:C/C++.Linux操作系统.应用程序设计.物联网.单片机和嵌入式开发等领域. 公众号回复[书籍],获取 Linux. ...