matplotlib绘图(四)
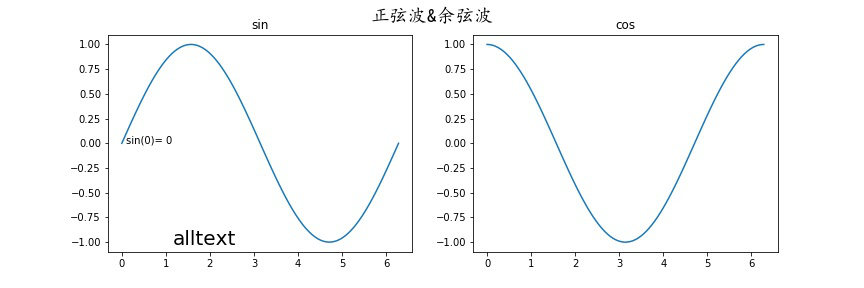
控制文字属性的方法:

所有的方法都会返回一个matplotlib.text.Text对象
文本注释:
annnotate()
xy参数设置箭头指示的位置,xytext参数设置注释文字的位置
arrowprops参数以字典的形式设置箭头的样式
width参数设置箭头长发行部分的宽度,headlength参数设置箭头尖端的长度,
headwidth参数设置箭头尖端底部的宽度,
facecolor设置箭头颜色
shrink参数设置箭头顶点,尾部与指示点,注释文字的距离(比例值)
系统定义的箭头样式:
    ``'-'``        None

    ``'->'``       head_length=0.4,head_width=0.2

    ``'-['``       widthB=1.0,lengthB=0.2,angleB=None

    ``'|-|'``      widthA=1.0,widthB=1.0

    ``'-|>'``      head_length=0.4,head_width=0.2

    ``'<-'``       head_length=0.4,head_width=0.2

    ``'<->'``      head_length=0.4,head_width=0.2

    ``'<|-'``      head_length=0.4,head_width=0.2

    ``'<|-|>'``    head_length=0.4,head_width=0.2

    ``'fancy'``    head_length=0.4,head_width=0.4,tail_width=0.4

    ``'simple'``   head_length=0.5,head_width=0.5,tail_width=0.2

    ``'wedge'``    tail_width=0.3,shrink_factor=0.5
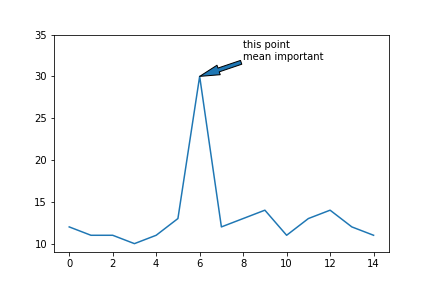
x = np.arange(15)
y = np.random.randint(10,15,size = 15)
plt.annotate(s = "this point \nmean important",xy = (6,30),xytext = (8,32),arrowprops= {"arrowstyle":"wedge"} )

自定义箭头样式:
plt.annotate(s = "this point \nmean important",
xy = (6,30),xytext = (8,32),
arrowprops= {"width":4,"headwidth":10,"headlength":20,"shrink":1} )
matplotlib绘图(四)的更多相关文章
- matplotlib绘图的基本操作
转自:Laumians博客园 更简明易懂看Matplotlib Python 画图教程 (莫烦Python)_演讲•公开课_科技_bilibili_哔哩哔哩 https://www.bilibili. ...
- matplotlib绘图基本用法-转自(http://blog.csdn.net/mao19931004/article/details/51915016)
本文转载自http://blog.csdn.net/mao19931004/article/details/51915016 <!DOCTYPE html PUBLIC "-//W3C ...
- Matplotlib绘图及动画总结
目录 Matplotlib绘图总结 绘图原理 block模式(python默认) interactive模式(ipython模式默认) 深入子图 子图表示 子图绘图 绘制动画 参考链接 Matplot ...
- 数据分析07 /matplotlib绘图
数据分析07 /matplotlib绘图 目录 数据分析07 /matplotlib绘图 1. 绘制线性图:plt.plot() 2. 绘制柱状图:plt.bar() 3. 绘制直方图:plt.his ...
- python数据分析使用matplotlib绘图
matplotlib绘图 关注公众号"轻松学编程"了解更多. Series和DataFrame都有一个用于生成各类图表的plot方法.默认情况下,它们所生成的是线形图 %matpl ...
- Matplotlib 绘图秘籍·翻译完成
原文:Matplotlib Plotting Cookbook 协议:CC BY-NC-SA 4.0 欢迎任何人参与和完善:一个人可以走的很快,但是一群人却可以走的更远. 在线阅读 ApacheCN ...
- matplotlib 绘图
http://blog.csdn.net/jkhere/article/details/9324823 都打一遍 5 matplotlib-绘制精美的图表 matplotlib 是python最著名的 ...
- python实战学习之matplotlib绘图续
学习完matplotlib绘图可以设置的属性,还需要学习一下除了折线图以外其他类型的图如直方图,条形图,散点图等,matplotlib还支持更多的图,具体细节可以参考官方文档:https://matp ...
- python中利用matplotlib绘图可视化知识归纳
python中利用matplotlib绘图可视化知识归纳: (1)matplotlib图标正常显示中文 import matplotlib.pyplot as plt plt.rcParams['fo ...
随机推荐
- vue.js数据绑定语法
原始高清大图下载 1.数据绑定 html代码: <div id="first" class="first">msg:{{msg}}</div& ...
- hubbledotnet 使用笔记
Hubble vs 字符串 <connectionStrings> <add name="Search" connectionString="serve ...
- IDEA在debug模式项目启动一半卡主,无法启动,也不报错
罪魁祸首就是手误 点了一下代码中方法的左侧打了个方法断点 Java Method Breakpoints 有时候debug启动很慢也有可能是这个原因,记录一下
- mongodb的投影
mongodb 投影意思是只选择必要的数据而不是选择一个文件的数据的整个.如果一个文档有5个字段,需要显示只有3个,然后选择其中只有3个字段. find() 方法 MongoDB 的find()方法, ...
- 文件系统结构-《循序渐进linux》
1.目录结构 很多linux的发行版都遵循FSSTND标准,这一标准仅包含系统最基本的文件. /dev 设备文件 /bin 可执行的二进制文件 /opt /root 超级用户的主目录 /home 每个 ...
- iOS VIPER架构(一)
洋葱模型 洋葱模型,是从冰山模型上演变而来的,用来进行层次分析的模型,这是Redux的洋葱模型. action从最外层传入,层层传递直至核心后,经过逐层事件触发,再次被分发出来,执行后续操作. 洋葱模 ...
- iOS Programming Autorotation, Popover Controllers, and Modal View Controllers
iOS Programming Autorotation, Popover Controllers, and Modal View Controllers 自动旋转,Popover 控制器,Moda ...
- 运行JavaWeb项目报错Access denied for user 'root'@'localhost' (using password: YES)
问题重现:(以下讨论范围仅限Windows环境): C:\AppServ\MySQL> mysql -u root -p Enter password: ERROR 1045 (28000): ...
- Codeforces 464E #265 (Div. 1) E. The Classic Problem 主席树+Hash
E. The Classic Problem http://codeforces.com/problemset/problem/464/E 题意:给你一张无向带权图,求S-T的最短路,并输出路径.边权 ...
- UVALive 3942 Remember The Word (Tire)
状态是DAG,因此方案用dp统计,dp[i] = sum(dp[i+len(x)]),x是以i开头的前缀且是单词,关键在于快速判断一个前缀是不是单词,可用Trie. 每一次转移的复杂度是O(maxle ...