部署Prometheus+Grafana监控

Prometheus
1、不是很友好,各种配置都手写
2、对docker和k8s监控有成熟解决方案
Prometheus(普罗米修斯)
是一个最初在SoudCloud上构建的监控系统,开源项目,拥有非常活跃的开发人员和用户社区,2016年加入云原生云计算基金会(CNCF)成为继kubernetes之后的第二个托管项目
https://Prometheus.io
https://github.com./Prometheus
Prometheus 特点
l 多维数据模型:由度量名称和键值对标识的时间序列数据
l PromSQL:一种灵活的查询语言,可以利用多维数据完成复杂查询
l 不依赖分布式存储,当服务器节点可以直接工作
l 基于HTTP的pull方式进行采集时间序列数据
l 推送时间序列数据通过pushgateway组件支持
l 通过服务发现或静态配置发现目标
l 多种如下模式仪表盘执行(grafana)
功能简介
l Prometheus Server:收集指标和存储时间序列数据,并提供查询接口
l ClientLibrary:客户端库
l Push Gateway:短期存储指标数据,主要用于临时性任务
l Exporters:采集已有的第三方服务监控指标并暴露metrics
l Alertmanager:告警
l Web UI:简单的Wbe控制台
Prometheus概述
概念:
l 实例:可以抓取的目标称为实例(Instances)
l 作业:具有相同目标的实例集合称为作业(Job)
机器规划
|
CentOS 7.X |
192.168.10.110 |
安装docker |
安装promethues |
|
CentOS 7.X |
192.168.10.113 |
安装docker |
安装cAdvisor |
基础优化
1、时间同步

echo "#time sync by fage at 2020-7-22" >>/var/spool/cron/root && echo "*/5 * * * *  /usr/sbin/ntpdate ntp1.aliyun.com >/dev/null 2>&1" >>/var/spool/cron/root && systemctl restart crond.service

2、关闭防火墙和selinux

systemctl stop firewalld && systemctl disable firewalld && setenforce 0 && sed -i s#SELINUX=enforcing#SELINUX=disable#g /etc/selinux/config

3、安装基础软件

yum install -y lrzsz nmap tcpdump screen tree dos2unix nc iproute net-tools unzip wget vim bash-completion.noarch telnet ntp ntpdate lsof curl

4、更换国内原

wget -O /etc/yum.repos.d/CentOS-Base.repo https://mirrors.aliyun.com/repo/Centos-7.repo

wget -O /etc/yum.repos.d/epel.repo http://mirrors.aliyun.com/repo/epel-7.repo

5、安装docker

yum install -y yum-utils device-mapper-persistent-data lvm2

wget https://mirrors.aliyun.com/docker-ce/linux/centos/docker-ce.repo -O /etc/yum.repos.d/docker-ce.repo

yum makecache fast

yum install -y docker-ce-19.03.12

mkdir -p /etc/docker

cat > /etc/docker/daemon.json << EOF

{

  "registry-mirrors": ["https://b9pmyelo.mirror.aliyuncs.com"]

}

EOF

systemctl daemon-reload && systemctl enable docker

systemctl start docker && systemctl status docker

docker info
使用docker部署,首先对系统有一定要求,必须是centos7.x以上版本,安装好docker
prometheus.yml文件内容
# my global config

global:

  scrape_interval:     15s # Set the scrape interval to every 15 seconds. Default is every 1 minute.

  evaluation_interval: 15s # Evaluate rules every 15 seconds. The default is every 1 minute.

  # scrape_timeout is set to the global default (10s).

  # Attach these labels to any time series or alerts when communicating with

  # external systems (federation, remote storage, Alertmanager).

  external_labels:

      monitor: 'codelab-monitor'

# Load rules once and periodically evaluate them according to the global 'evaluation_interval'.

rule_files:

  # - "first.rules"

  # - "second.rules"

# A scrape configuration containing exactly one endpoint to scrape:

# Here it's Prometheus itself.

scrape_configs:

  # The job name is added as a label `job=<job_name>` to any timeseries scraped from this config.

  - job_name: 'prometheus'

    # metrics_path defaults to '/metrics'

    # scheme defaults to 'http'.

    static_configs:

      - targets: ['localhost:9090']

  - job_name: "docker"

    static_configs:

    - targets: ['192.168.10.190:8080']

  - job_name: "Linux"

    static_configs:

    - targets: ['192.168.10.190:9100']
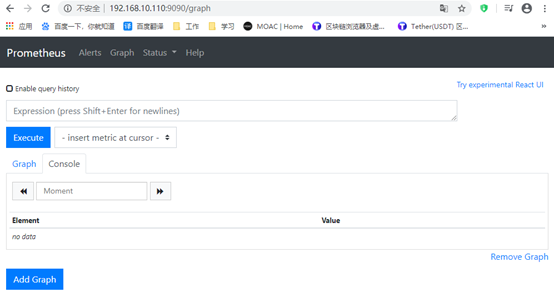
docker部署
参考地址:https://prometheus.io/docs/prometheus/latest/installation/
docker run -d \

    -p 9090:9090 \

    --name prometheus \

    -v /tmp/prometheus.yml:/etc/prometheus/prometheus.yml \

    prom/prometheus
Prometheus+Grafana监控Docker 主机
cAdvisor(Container Advisor)用于手机正在运行的容器资源使用和性能信息
Grafana 是一个开源的度量分析和可视化系统
模板获取地址:https://grafana.com/grafana/download
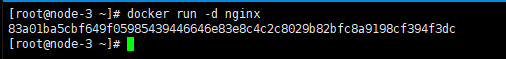
运行容器,如果没有这个镜像会去docker官方去拉取
docker run -d -p 80:80 --name nginx nginx

监控指标:
内存、CPU、内存、网络、业务状态
查看docker容器运行状态(动态)
docker stats nginx

查看docker容器运行状态(静态)
docker stats --no-stream nginx

Docker部署cAdvisor
获取状态通过挂载目录去获取
参考地址:https://github.com/google/cadvisor
docker run -d \

  --volume=/:/rootfs:ro \

  --volume=/var/run:/var/run:ro \

  --volume=/sys:/sys:ro \

  --volume=/var/lib/docker/:/var/lib/docker:ro \

  --volume=/dev/disk/:/dev/disk:ro \

  --publish=8080:8080 \

  --detach=true \

  --name=cadvisor \

  --privileged \

  --device=/dev/kmsg \

  google/cadvisor:v0.33.0
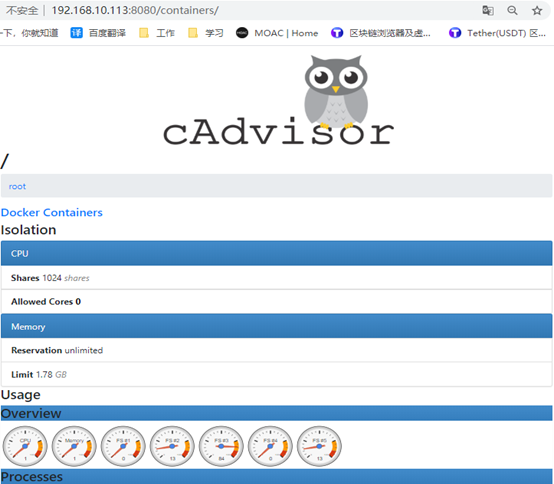
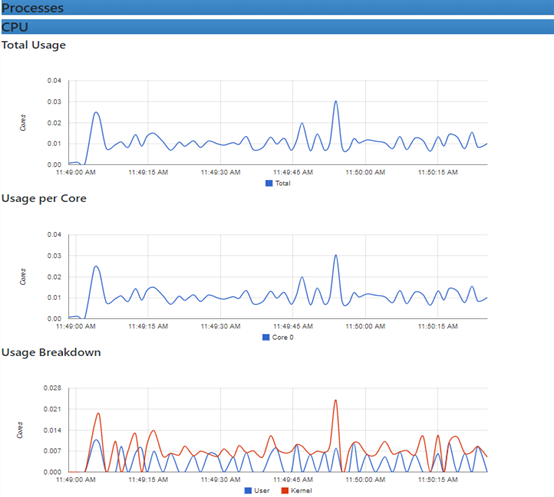

需要注意的是,cAdvisor没有存储数据的机制,所以需要采集到Prometheus上去存储
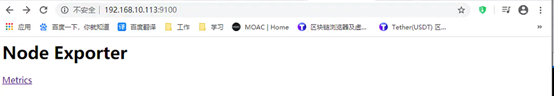
图上的容器指标也可以通过地址查看到:http://192.168.10.113:8080/metrics
里面的数据模型都是一个指标内容,解析出来了才能放入到promethues的实时数据库里面
修改promethues配置文件,让promethues采集被监控的数据
cat /tmp/prometheus.yml
global:

  scrape_interval: 15s

  evaluation_interval: 15s

alerting:

  alertmanagers:

  - static_configs:

    - targets:

rule_files:

scrape_configs:

  - job_name: 'prometheus'

    static_configs:

    - targets: ['localhost:9090']

  - job_name: "docker"

    static_configs:

    - targets: ['192.168.10.113:8080']
重启容器
docker ps -a | grep prometheus
docker restart prometheus
使用grafana去展示数据
Docker部署Grafana
docker run -d \

  --name=grafana \

  -p 3000:3000 \

  grafana/grafana
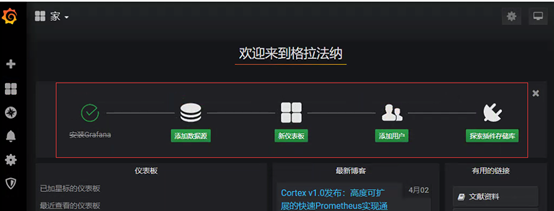
首选打开地址和端口后输入账号和密码,默认账号:admin 密码admin
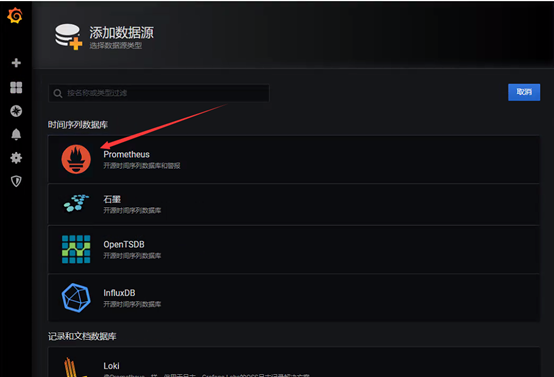
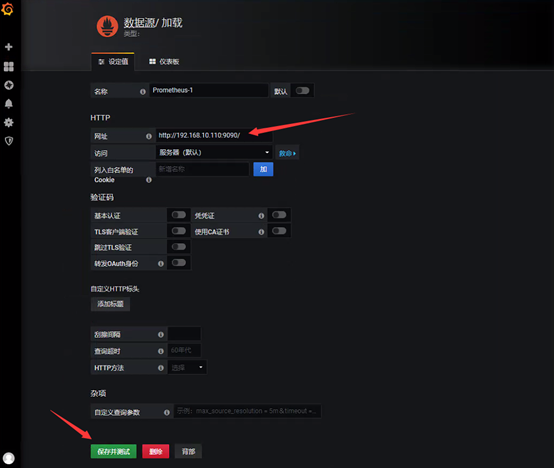
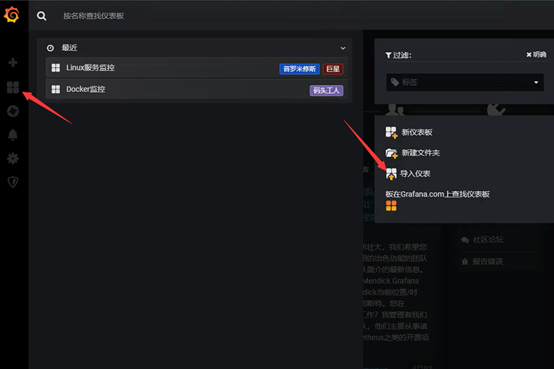
进去就会出现导航,添加数据源,新建仪表盘,用户和扩展插件
仪表盘获取地址:https://grafana.com/grafana/download
监控docker主机
下载地址:https://github.com/prometheus/node_exporter/
执行这个脚本即可安装import
cat node_exporter.sh
#!/bin/bash

wget https://github.com/prometheus/node_exporter/releases/download/v0.17.0/node_exporter-0.17.0.linux-amd64.tar.gz

tar xf node_exporter-0.17.0.linux-amd64.tar.gz

mv node_exporter-0.17.0.linux-amd64 /usr/local/node_exporter

cat <<EOF >/usr/lib/systemd/system/node_exporter.service

[Unit]

Description=https://prometheus.io

[Service]

Restart=on-failure

ExecStart=/usr/local/node_exporter/node_exporter --collector.systemd --collector.systemd.unit-whitelist=(docker|kubelet|kube-proxy|flanneld).service

[Install]

WantedBy=mulit-user.target

EOF

systemctl daemon-reload

systemctl enable node_exporter.service

systemctl start node_exporter.service

bash node_exporter.sh
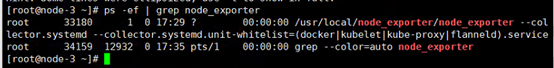
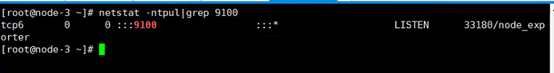
检查端口和服务是否正常,默认使用9100端口
systemctl status node_exporter.service

ps -ef | grep node_exporter

netstat -ntpul|grep 9100

重新修改prometheus配置文件,添加监控项目
cat /tmp/prometheus.yml
global:

  scrape_interval:     15s

  evaluation_interval: 15s

alerting:

  alertmanagers:

  - static_configs:

    - targets:

rule_files:

scrape_configs:

  - job_name: 'prometheus'

    static_configs:

    - targets: ['localhost:9090']

  - job_name: "docker"

    static_configs:

    - targets: ['192.168.10.113:8080']

  - job_name: "Linux"

    static_configs:

    - targets: ['192.168.10.113:9100']
重启服务
docker ps | grep prometheus

docker restart prometheus
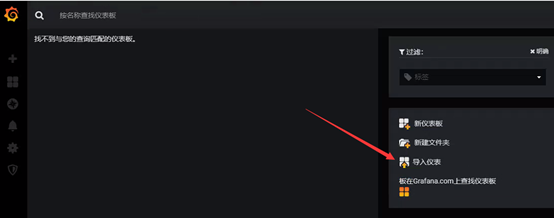
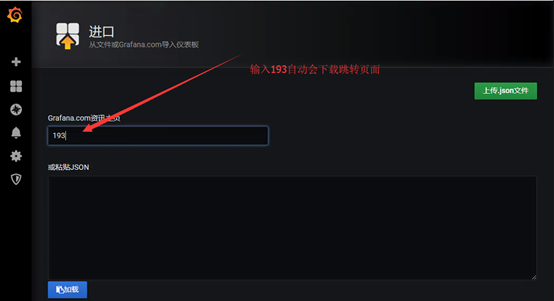
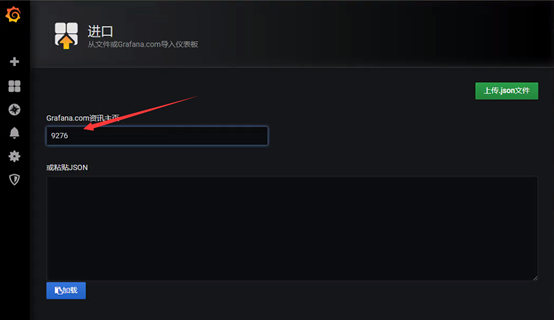
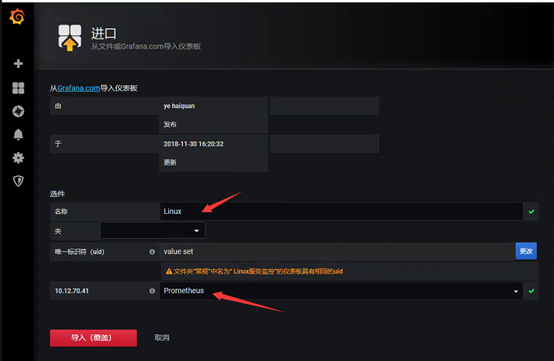
导入Linux模板,模板ID为:9276
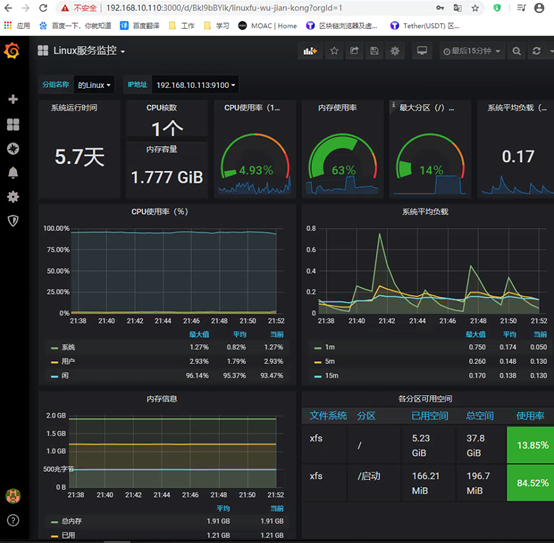
如果不出图:
1、网卡不出流量,可能是网卡名配置问题以前的eth0,现在可能是ens33等等

2、时间不对也会不出图

3、promql语句不正确,如网络没有数据:node_network_receive_bytes_total ,把这个语句拿到promtheus网页进行测试是否能获取到数据
部署Prometheus+Grafana监控的更多相关文章
- Rancher2.x 一键式部署 Prometheus + Grafana 监控 Kubernetes 集群
目录 1.Prometheus & Grafana 介绍 2.环境.软件准备 3.Rancher 2.x 应用商店 4.一键式部署 Prometheus 5.验证 Prometheus + G ...
- [转帖]Prometheus+Grafana监控Kubernetes
原博客的位置: https://blog.csdn.net/shenhonglei1234/article/details/80503353 感谢原作者 这里记录一下自己试验过程中遇到的问题: . 自 ...
- Prometheus + Grafana 监控系统搭
本文主要介绍基于Prometheus + Grafana 监控Linux服务器. 一.Prometheus 概述(略) 与其他监控系统对比 1 Prometheus vs. Zabbix Zabbix ...
- 【DB宝36】使用Docker分分钟搭建漂亮的prometheus+grafana监控
目录 一.部署Prometheus+grafana环境 1.1.下载Prometheus+grafana镜像 1.2.创建镜像 1.3.浏览器访问 二.监控Linux主机 2.1.在被监控主机上部署n ...
- Prometheus+Grafana监控Kubernetes
涉及文件下载地址:链接:https://pan.baidu.com/s/18XHK7ex_J0rzTtfW-QA2eA 密码:0qn6 文件中需要下载的镜像需要自己提前下载好,eg:prom/node ...
- Docker部署Zabbix+Grafana监控
Docker部署Zabbix+Grafana监控 环境 centos 7 ; Docker 17.12.0-ce ; docker-compose version 1.20.1 2018-4-1 当前 ...
- cAdvisor+Prometheus+Grafana监控docker
cAdvisor+Prometheus+Grafana监控docker 一.cAdvisor(需要监控的主机都要安装) 官方地址:https://github.com/google/cadvisor ...
- prometheus+grafana监控redis
prometheus+grafana监控redis redis安装配置 https://www.cnblogs.com/autohome7390/p/6433956.html redis_export ...
- prometheus+grafana监控mysql
prometheus+grafana监控mysql 1.安装配置MySQL官方的 Yum Repository(有mysql只需设置监控账号即可) [root@localhost ~]# wget - ...
随机推荐
- iOS打电话功能的简单实现
小功能简介 iOS中的很多小功能都是非常简单的,几行代码就搞定了,比如打电话.打开网址.发邮件.发短信等 打电话-方法3 创建一个UIWebView来加载URL,拨完后能自动回到原应用 if (_we ...
- Angular(二) - 组件Component
1. 组件Component示例 2. Component常用的几个选项 3. Component全部的选项 3.1 继承自@Directive装饰器的选项 3.2 @Component自己特有的选项 ...
- HTML-CSS-JS Prettify 代码格式化插件
前提:已经安装 node.js.安装插件 HTML-CSS-JS Prettify,修改node路径,即可通过单击右键 HTML-CSS-JS Prettify 中的 Prettify Code 使用 ...
- JumpServer 架构浅解
Jumpserver 是一款由python编写开源的跳板机(堡垒机)系统,实现了跳板机应有的功能.基于ssh协议来管理,客户端无需安装agent.完全开源,GPL授权 设计思路 设计一个跳转网关,所有 ...
- Linux打包压缩解压工具
第1章 Linux 打包压缩解压工具一.压缩.解压工具 compress/uncompress gzip/gunzip bzip2/bunzip2/ bzcat xz/unxz/ xzcat ...
- TDengine常见问题解答(FAQ)
1. TDengine2.0之前的版本升级到2.0及以上的版本应该注意什么?☆☆☆ 2.0版本在之前版本的基础上,进行了完全的重构,配置文件和数据文件是不兼容的.在升级之前务必进行如下操作: 删除配置 ...
- netty学习心得2内存池
http://frankfan915.iteye.com/blog/2199600 https://www.jianshu.com/p/13f72e0395c8:一个性能调优的文档,还有一些linux ...
- redis之哨兵 springboot配置
转载自https://blog.csdn.net/m0_37367413/article/details/82018125 springboot整合redis哨兵方式配置 2018年08月24日 14 ...
- Python爬虫和函数调试
一:函数调试 用之前学过的try···except进行调试 def gameover(setA,setB): if setA==3 or setB==3: return True else: retu ...
- 解释器与JIT编译器
解释器 JVM设计者们的初衷仅仅只是单纯地为了满足Java程序实现跨平台特性,因此避免采用静态编译的方式直接生成本地机器指令,从而诞生了实现解释器在运行时采用逐行解释字节码执行程序的想法. 解释器真正 ...