部署Prometheus+Grafana监控

Prometheus
1、不是很友好,各种配置都手写
2、对docker和k8s监控有成熟解决方案
Prometheus(普罗米修斯)
是一个最初在SoudCloud上构建的监控系统,开源项目,拥有非常活跃的开发人员和用户社区,2016年加入云原生云计算基金会(CNCF)成为继kubernetes之后的第二个托管项目
https://Prometheus.io
https://github.com./Prometheus
Prometheus 特点
l 多维数据模型:由度量名称和键值对标识的时间序列数据
l PromSQL:一种灵活的查询语言,可以利用多维数据完成复杂查询
l 不依赖分布式存储,当服务器节点可以直接工作
l 基于HTTP的pull方式进行采集时间序列数据
l 推送时间序列数据通过pushgateway组件支持
l 通过服务发现或静态配置发现目标
l 多种如下模式仪表盘执行(grafana)
功能简介
l Prometheus Server:收集指标和存储时间序列数据,并提供查询接口
l ClientLibrary:客户端库
l Push Gateway:短期存储指标数据,主要用于临时性任务
l Exporters:采集已有的第三方服务监控指标并暴露metrics
l Alertmanager:告警
l Web UI:简单的Wbe控制台
Prometheus概述
概念:
l 实例:可以抓取的目标称为实例(Instances)
l 作业:具有相同目标的实例集合称为作业(Job)
机器规划
|
CentOS 7.X |
192.168.10.110 |
安装docker |
安装promethues |
|
CentOS 7.X |
192.168.10.113 |
安装docker |
安装cAdvisor |
基础优化
1、时间同步

echo "#time sync by fage at 2020-7-22" >>/var/spool/cron/root && echo "*/5 * * * *  /usr/sbin/ntpdate ntp1.aliyun.com >/dev/null 2>&1" >>/var/spool/cron/root && systemctl restart crond.service

2、关闭防火墙和selinux

systemctl stop firewalld && systemctl disable firewalld && setenforce 0 && sed -i s#SELINUX=enforcing#SELINUX=disable#g /etc/selinux/config

3、安装基础软件

yum install -y lrzsz nmap tcpdump screen tree dos2unix nc iproute net-tools unzip wget vim bash-completion.noarch telnet ntp ntpdate lsof curl

4、更换国内原

wget -O /etc/yum.repos.d/CentOS-Base.repo https://mirrors.aliyun.com/repo/Centos-7.repo

wget -O /etc/yum.repos.d/epel.repo http://mirrors.aliyun.com/repo/epel-7.repo

5、安装docker

yum install -y yum-utils device-mapper-persistent-data lvm2

wget https://mirrors.aliyun.com/docker-ce/linux/centos/docker-ce.repo -O /etc/yum.repos.d/docker-ce.repo

yum makecache fast

yum install -y docker-ce-19.03.12

mkdir -p /etc/docker

cat > /etc/docker/daemon.json << EOF

{

  "registry-mirrors": ["https://b9pmyelo.mirror.aliyuncs.com"]

}

EOF

systemctl daemon-reload && systemctl enable docker

systemctl start docker && systemctl status docker

docker info
使用docker部署,首先对系统有一定要求,必须是centos7.x以上版本,安装好docker
prometheus.yml文件内容
# my global config

global:

  scrape_interval:     15s # Set the scrape interval to every 15 seconds. Default is every 1 minute.

  evaluation_interval: 15s # Evaluate rules every 15 seconds. The default is every 1 minute.

  # scrape_timeout is set to the global default (10s).

  # Attach these labels to any time series or alerts when communicating with

  # external systems (federation, remote storage, Alertmanager).

  external_labels:

      monitor: 'codelab-monitor'

# Load rules once and periodically evaluate them according to the global 'evaluation_interval'.

rule_files:

  # - "first.rules"

  # - "second.rules"

# A scrape configuration containing exactly one endpoint to scrape:

# Here it's Prometheus itself.

scrape_configs:

  # The job name is added as a label `job=<job_name>` to any timeseries scraped from this config.

  - job_name: 'prometheus'

    # metrics_path defaults to '/metrics'

    # scheme defaults to 'http'.

    static_configs:

      - targets: ['localhost:9090']

  - job_name: "docker"

    static_configs:

    - targets: ['192.168.10.190:8080']

  - job_name: "Linux"

    static_configs:

    - targets: ['192.168.10.190:9100']
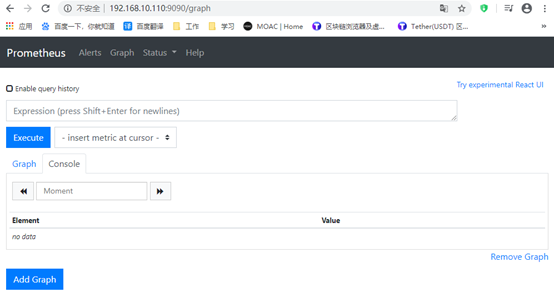
docker部署
参考地址:https://prometheus.io/docs/prometheus/latest/installation/
docker run -d \

    -p 9090:9090 \

    --name prometheus \

    -v /tmp/prometheus.yml:/etc/prometheus/prometheus.yml \

    prom/prometheus
Prometheus+Grafana监控Docker 主机
cAdvisor(Container Advisor)用于手机正在运行的容器资源使用和性能信息
Grafana 是一个开源的度量分析和可视化系统
模板获取地址:https://grafana.com/grafana/download
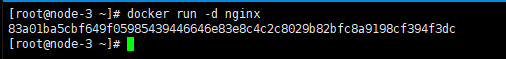
运行容器,如果没有这个镜像会去docker官方去拉取
docker run -d -p 80:80 --name nginx nginx

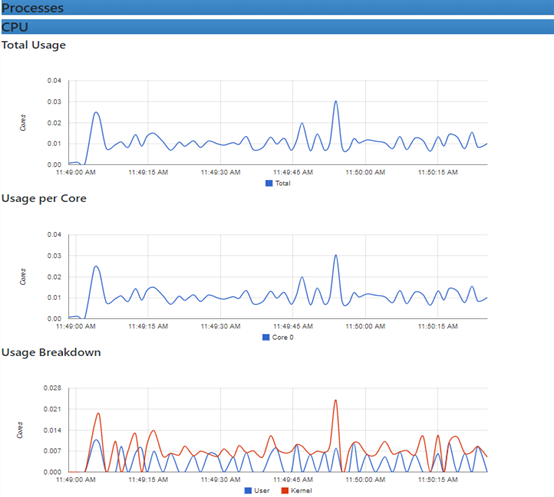
监控指标:
内存、CPU、内存、网络、业务状态
查看docker容器运行状态(动态)
docker stats nginx

查看docker容器运行状态(静态)
docker stats --no-stream nginx

Docker部署cAdvisor
获取状态通过挂载目录去获取
参考地址:https://github.com/google/cadvisor
docker run -d \

  --volume=/:/rootfs:ro \

  --volume=/var/run:/var/run:ro \

  --volume=/sys:/sys:ro \

  --volume=/var/lib/docker/:/var/lib/docker:ro \

  --volume=/dev/disk/:/dev/disk:ro \

  --publish=8080:8080 \

  --detach=true \

  --name=cadvisor \

  --privileged \

  --device=/dev/kmsg \

  google/cadvisor:v0.33.0
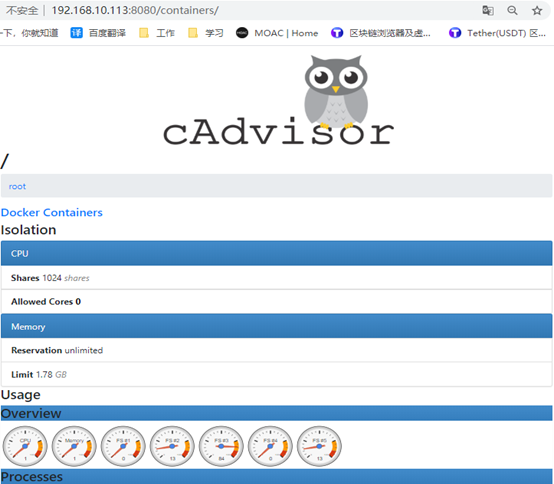

需要注意的是,cAdvisor没有存储数据的机制,所以需要采集到Prometheus上去存储
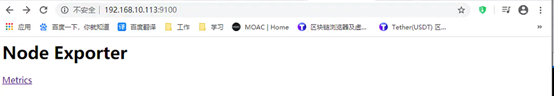
图上的容器指标也可以通过地址查看到:http://192.168.10.113:8080/metrics
里面的数据模型都是一个指标内容,解析出来了才能放入到promethues的实时数据库里面
修改promethues配置文件,让promethues采集被监控的数据
cat /tmp/prometheus.yml
global:

  scrape_interval: 15s

  evaluation_interval: 15s

alerting:

  alertmanagers:

  - static_configs:

    - targets:

rule_files:

scrape_configs:

  - job_name: 'prometheus'

    static_configs:

    - targets: ['localhost:9090']

  - job_name: "docker"

    static_configs:

    - targets: ['192.168.10.113:8080']
重启容器
docker ps -a | grep prometheus
docker restart prometheus
使用grafana去展示数据
Docker部署Grafana
docker run -d \

  --name=grafana \

  -p 3000:3000 \

  grafana/grafana
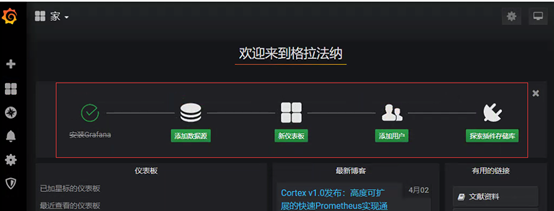
首选打开地址和端口后输入账号和密码,默认账号:admin 密码admin
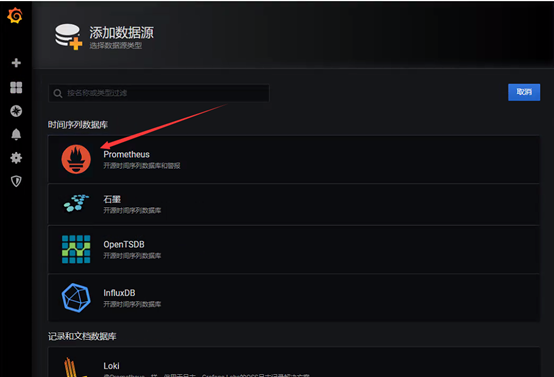
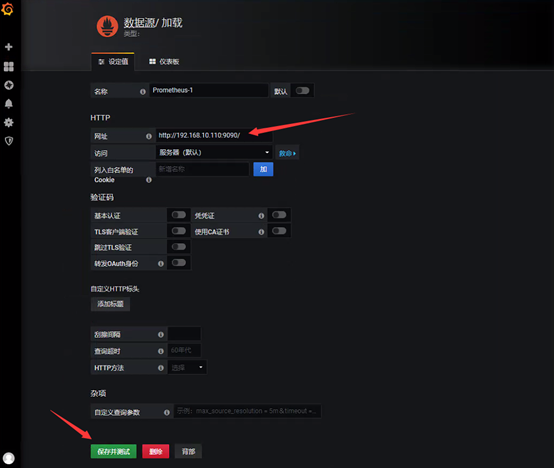
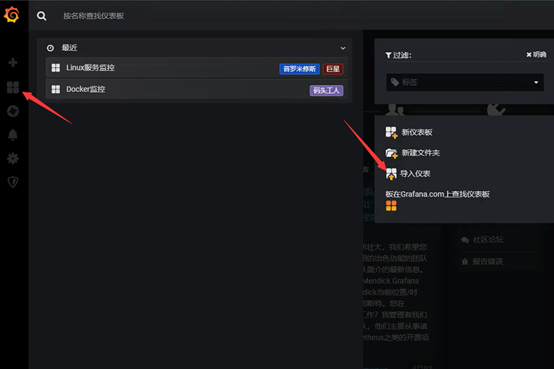
进去就会出现导航,添加数据源,新建仪表盘,用户和扩展插件
仪表盘获取地址:https://grafana.com/grafana/download
监控docker主机
下载地址:https://github.com/prometheus/node_exporter/
执行这个脚本即可安装import
cat node_exporter.sh
#!/bin/bash

wget https://github.com/prometheus/node_exporter/releases/download/v0.17.0/node_exporter-0.17.0.linux-amd64.tar.gz

tar xf node_exporter-0.17.0.linux-amd64.tar.gz

mv node_exporter-0.17.0.linux-amd64 /usr/local/node_exporter

cat <<EOF >/usr/lib/systemd/system/node_exporter.service

[Unit]

Description=https://prometheus.io

[Service]

Restart=on-failure

ExecStart=/usr/local/node_exporter/node_exporter --collector.systemd --collector.systemd.unit-whitelist=(docker|kubelet|kube-proxy|flanneld).service

[Install]

WantedBy=mulit-user.target

EOF

systemctl daemon-reload

systemctl enable node_exporter.service

systemctl start node_exporter.service

bash node_exporter.sh
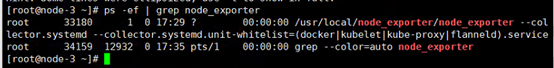
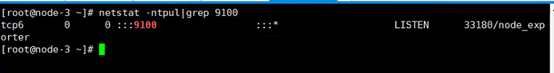
检查端口和服务是否正常,默认使用9100端口
systemctl status node_exporter.service

ps -ef | grep node_exporter

netstat -ntpul|grep 9100

重新修改prometheus配置文件,添加监控项目
cat /tmp/prometheus.yml
global:

  scrape_interval:     15s

  evaluation_interval: 15s

alerting:

  alertmanagers:

  - static_configs:

    - targets:

rule_files:

scrape_configs:

  - job_name: 'prometheus'

    static_configs:

    - targets: ['localhost:9090']

  - job_name: "docker"

    static_configs:

    - targets: ['192.168.10.113:8080']

  - job_name: "Linux"

    static_configs:

    - targets: ['192.168.10.113:9100']
重启服务
docker ps | grep prometheus

docker restart prometheus
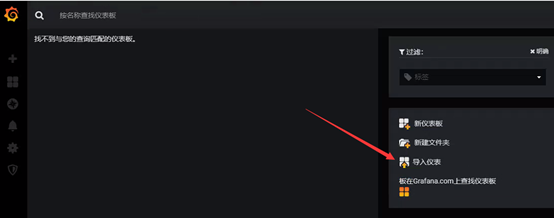
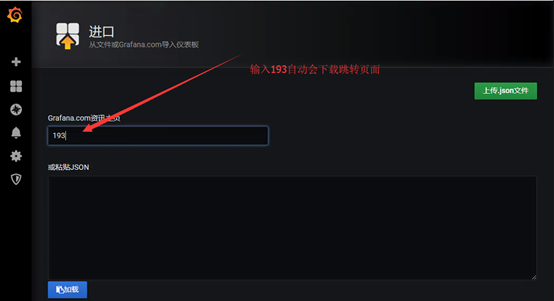
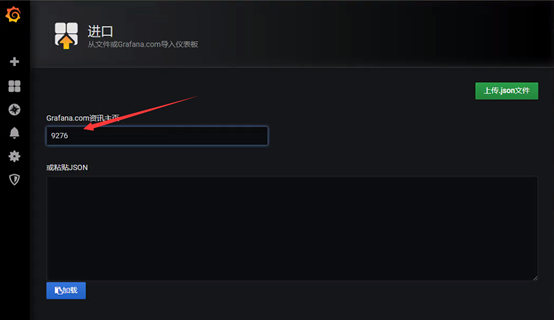
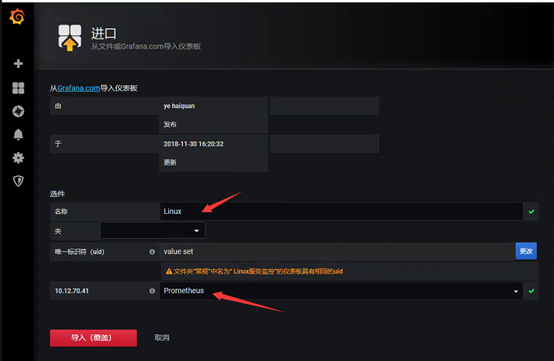
导入Linux模板,模板ID为:9276
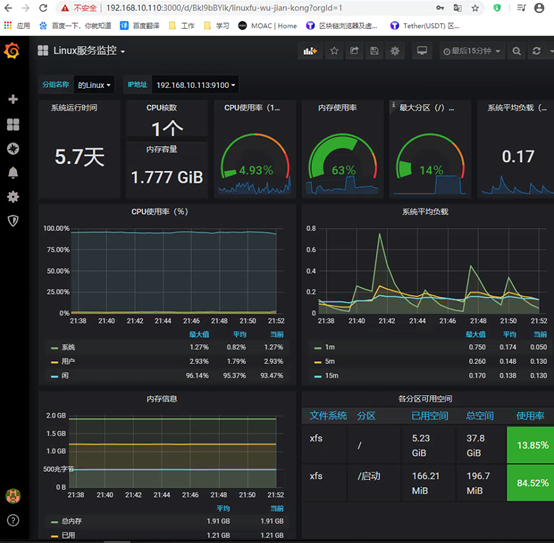
如果不出图:
1、网卡不出流量,可能是网卡名配置问题以前的eth0,现在可能是ens33等等

2、时间不对也会不出图

3、promql语句不正确,如网络没有数据:node_network_receive_bytes_total ,把这个语句拿到promtheus网页进行测试是否能获取到数据
部署Prometheus+Grafana监控的更多相关文章
- Rancher2.x 一键式部署 Prometheus + Grafana 监控 Kubernetes 集群
目录 1.Prometheus & Grafana 介绍 2.环境.软件准备 3.Rancher 2.x 应用商店 4.一键式部署 Prometheus 5.验证 Prometheus + G ...
- [转帖]Prometheus+Grafana监控Kubernetes
原博客的位置: https://blog.csdn.net/shenhonglei1234/article/details/80503353 感谢原作者 这里记录一下自己试验过程中遇到的问题: . 自 ...
- Prometheus + Grafana 监控系统搭
本文主要介绍基于Prometheus + Grafana 监控Linux服务器. 一.Prometheus 概述(略) 与其他监控系统对比 1 Prometheus vs. Zabbix Zabbix ...
- 【DB宝36】使用Docker分分钟搭建漂亮的prometheus+grafana监控
目录 一.部署Prometheus+grafana环境 1.1.下载Prometheus+grafana镜像 1.2.创建镜像 1.3.浏览器访问 二.监控Linux主机 2.1.在被监控主机上部署n ...
- Prometheus+Grafana监控Kubernetes
涉及文件下载地址:链接:https://pan.baidu.com/s/18XHK7ex_J0rzTtfW-QA2eA 密码:0qn6 文件中需要下载的镜像需要自己提前下载好,eg:prom/node ...
- Docker部署Zabbix+Grafana监控
Docker部署Zabbix+Grafana监控 环境 centos 7 ; Docker 17.12.0-ce ; docker-compose version 1.20.1 2018-4-1 当前 ...
- cAdvisor+Prometheus+Grafana监控docker
cAdvisor+Prometheus+Grafana监控docker 一.cAdvisor(需要监控的主机都要安装) 官方地址:https://github.com/google/cadvisor ...
- prometheus+grafana监控redis
prometheus+grafana监控redis redis安装配置 https://www.cnblogs.com/autohome7390/p/6433956.html redis_export ...
- prometheus+grafana监控mysql
prometheus+grafana监控mysql 1.安装配置MySQL官方的 Yum Repository(有mysql只需设置监控账号即可) [root@localhost ~]# wget - ...
随机推荐
- Unity 3D的版本控制问题
译林军 李慧爽|2014-02-13 11:21|9231次浏览|Unity(286)移动应用(19)技术开发(9)0 Unity中的源码控制并非和其他开发环境一样简单.我们可以从开发和美术两个角度讲 ...
- springboot @valid与@validated的参数校验使用总结
好久没在这平台写博客了,最近整理了这东西,先给出总结 // @Valid只能用在controller,@Validated可以用在其他被spring管理的类上 // @Valid可以加在成员变量上(本 ...
- mock之初体验
刚接触vue的时候,看到github上有人的开源项目介绍使用mock可以模拟接口调用,可以使用模拟数据避免跟后端交互也可以实现前端功能的完美展现,当时觉得卧槽,mock这个东西这么神奇的吗?那一定要学 ...
- 知识点干货——CSS动画
CSS动画 (transition.animation) //2D动画 transform:translate(); /*偏移*/ transform:rotate(); /*旋转角度*/ trans ...
- CentOS 7/8修改系统运行级别
CentOS 7/8修改系统运行级别 CentOS 5. CentOS 6可以通过修改配置文件/etc/inittab 参数,从而修改系统运行级别,切换系统的runlevel,但是从CentOS ...
- Agumaster 改善了pagination
页面越来越完善了.
- 解决 Mac 上 Docker 无法直接 ping 通的问题
解决 Mac 上 Docker 无法直接 ping 通的问题 原文连接 一.背景 Mac os Mojave 10.14.3 Docker Desktop community 2.3.0.4 二.问题 ...
- Table内部实现2
这一节介绍Lua唯一的数据结构table,相对于大部分语言提供数组和字典两种类型,Lua将其合二为一,颇为精巧的实现了table. table充分体现了Lua语言的特点,用最简练的语法表达丰富的信息, ...
- python中实现参数化的原理
k就是 <参数名>
- 【吴恩达课程使用】keras cpu版安装【接】- anaconda (python 3.7) win10安装 tensorflow 1.8 cpu版
一.确认tensorflow的版本: 接上一条tensorflow的安装,注意版本不匹配会出现很多问题!:[吴恩达课程使用]anaconda (python 3.7) win10安装 tensorfl ...