Method for Estimating the Number of Concurrent Users
1. Formula for Estimating the Average Number of Concurrent users
We begin by defining what the number of concurrent users means. But before we do, the term login session has to be clarified first.
A login session is a time interval defined by a start time and end time. Between the start time and end time, there are one or more system resources being held. Take any web application that requires user authentication as an example, a login session starts from the time the user logs on to the system and ends when the users logs out. A user session (which consumes system memory) is created for each login session. The length of a login session is the difference between the start time and the end time.
We are now ready to define the concept of concurrent users. We shall agree that the number of concurrent users at a particular time instant is defined as the number of login sessions into which the time instant falls. This is illustrated in the following example:
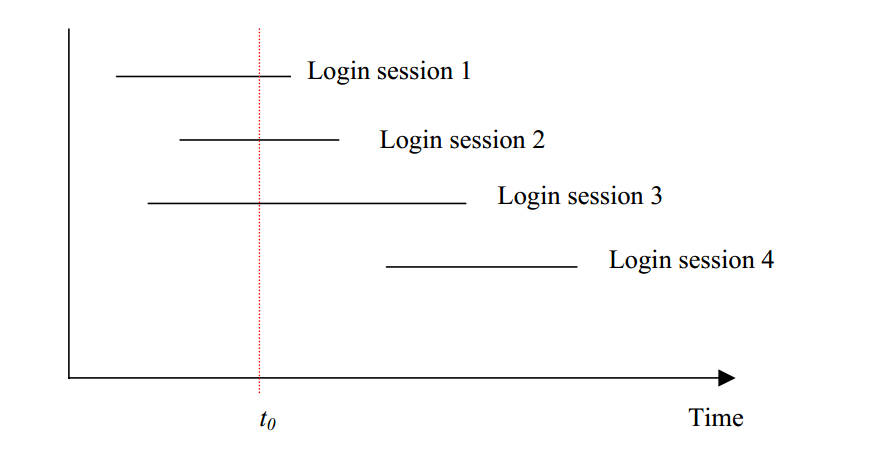
The horizontal axis is the time line. Each horizontal line segment represents a login session. Since the vertical line at time t0 intercepts with three login sessions, the number of concurrent users at time t0 is equal to three.
Let us focus on the time interval from 0 to an arbitrary time instant T. The following result can be mathematically proven:
Average number of concurrent users(C) = sum of the length of all login sesseions / T ...... (1)
Alternatively, if the total number of login sessions from time 0 to T equals n, and the average length of a login session equals L, then
C=nL/T ...... (2)
The formal proof is presented in the appendix. Intuitively, the formula can be shown this way: imagine that all the line segments representing the login sessions are joined end to end to form a long string. If the string is longer than T, then we have to wrap it round and round for a number of times in order to fill it in the space with length T. The number of times the string has to be wrapped is analogous to the average number of concurrent users. This is illustrated in the following figure:
2. Estimating the parameters
To calculate the average number of concurrent users (C) using the formula in section 3, a prerequisite is determining the values of the two parameters:
• the total number of login sessions (n)
• the average length of a login session (L)
in the time period of concern with length (T).
In this section, we give some advice about how these parameters could be estimated.
Firstly it should be pointed out that the result of the formula, C, is only an average value. It is possible that the number of concurrent users fluctuate widely in the concerned period of time. Hence, if we want the value of C to be as representative as possible, we should restrict the time period of concern so that the arrival rate of new login sessions (i.e. the ratio of n/T) is more or less steady in that time period. For example, if we know that a system is only used during office hours, we should limit the period of concern to the office hours only, instead of the whole day. The value of T is therefore equal to 8 (assuming 8-hour work) instead of 24. Otherwise, the value of C will be greatly dragged down by the fact that the system is not used during the non-officer hours.
The total number of login sessions (n) and the average length of a login session (L) can often be determined by the size of the user population and usage patterns. For example, if there are N potential users and we know that the probabilities that a user will use a system one time, two times and three times a day are p1, p2 and p3 respectively, and assume that a user will very unlikely use the system more than three times a day, then the total number of login sessions in one day is N(p1 + 2 p2 + 3 p3). On the other hand, the average length of a login session can be estimated by observing how a sample of users use the system.
In many systems, the frequency of usage and the average length of login sessions varies widely for different users. In this case, if we can group the users of similar usage patterns into a small number of classes, the above analysis can still be made. We can then calculate the number concurrent of users for each class and add the results together.
Undeniably, the usage patterns of users are often difficult to accurately predict. But for most systems, especially internal applications, some justifiable rough figures can usually be obtained. A example is presented in the next section to illustrate this.
3. An Example
The government of City H is going to launch the electronic payroll system for its 170,000 employees to view their own payroll information. Due to the varied levels of IT competency, the limited availability of PCs and the existence of other means for checking salary information, it is estimated that when the system is fully launched across the government, only 50% of the employees will regularly use the system. Of these users, it is also estimated that 70% will use the system once during the last week of each month. It was observed from the users who participated in the UAT that the average length of usage is about 5 minutes
We can now estimate the average concurrent number of users during the last week of a month. Let us restrict the period of concern to the office hours (9am – 5pm) of any one day.
n = 170,000 * 0.5 * 0.7 / 5 (assuming 5 days in a week)
= 11,900
L = 5 min
T = 8 hrs = 480 min ( 8 office hours each day)
C=nL/T = 11,900 * 5 / 480 = 124
So, it can be predicted that there will be an average of about 124 concurrent users accessing the system during the last week of each month
4. Estimating the Peak Number of Concurrent Users
 ...... (3)
C is the average number of the concurrent users.
4.1 In Practice
In the last section, we show that under the assumption that the arrival of new login sessions has a Poisson distribution, the peak number of concurrent users can be estimated. However, for many real world applications, the arrival of login sessions goes through the following states:
1. Sleeping state - during non-office hours there are no login sessions;
2. Transient state (rising) - the office hours start; people begin to login to the system; the rate of arrival of login sessions is increasing;
3. Steady state – the rate of arrival of login sessions becomes steady;
4. Transient state (falling) – the office hours is going to end; people are leaving the system; the rate of arrival of login sessions is decreasing;
State 4 is followed by state 1 and the cycle repeats.
For such applications, the assumption of section 6.1 is reasonable for state 3 only - that is, the steady state of the life cycle. Thus if we would like to more accurately predict the peak number of concurrent users, the following steps should be followed:
1. Estimate the time period of the steady state from experience.
2. Estimate the number of login sessions in the steady state.
3. Calculate the average number of concurrent users C using formula (2) of section 3.
4. Apply the formula (3) in section 6.1 to calculate the peak number of concurrent users.
The above steps are illustrated with the example in section 5 again as follows:
As a continuation of the example, assume further that 80% of users access the payroll system during the 5 hours period from 9:30am to 12:30am and 2:30pm to 4:30pm, despite the 8-hour working day. Also, the arrival of new login sessions is steady in these periods.
T = 5 hrs = 300 min
n = 11,900 * 0.8 = 9,520
L = 5 min
C = nL/T = 9520*5/300 = 159
 = 196
= 196
The reader may note that there is a discrepancy between the average number concurrent users calculated in section 5, and the average value calculated just above. In fact both of them are valid figures. This exemplifies what has been said in the beginning of section 4, that is, the average value of concurrent users can be very much dependent on the time period of concern. In section 5, our time period of concern is the whole working hours, so the average value is dragged down by the transient periods when there are few people using the system. In this section, we restrict the time period of concern to the peak hours only, so the value is larger. Although both values are valid, the latter figure is probably a better representation of the usage of the system.
Method for Estimating the Number of Concurrent Users的更多相关文章
- 执行tsung时报"Maximum number of concurrent users in a single VM reached
原创作品,允许转载,转载时请务必以超链接形式标明文章 原始出处 .作者信息和本声明.否则将追究法律责任.http://ovcer.blog.51cto.com/1145188/1581326 [roo ...
- Using the FutureRequestExecutionService Based on classic (blocking) I/O handle a great number of concurrent connections is more important than performance in terms of a raw data throughput
Chapter 7. Advanced topics http://hc.apache.org/httpcomponents-client-ga/tutorial/html/advanced.html ...
- The main method caused an error: java.util.concurrent.ExecutionException: org.apache.flink.runtime.client.JobSubmissionException: Failed to submit JobGraph.
在使用flink run命令提交任务可能会遇到如下错误: The program finished with the following exception: org.apache.flink.cli ...
- Estimating the number of receiving nodes in 802.11 networks via machine learning
来源:IEEE International Conference on Communications 作者:Matteo Maria 年份:2016 摘要: 现如今很多移动设备都配有多个无线接口,比如 ...
- 性能测试-并发和QPS
性能测试-并发和QPS 响应时间: cpu计算耗时 + cpu等待耗时 + 网络io耗时 + 磁盘io耗时 并发: 服务端并发和客户端并发不是同一个概念.客户端并发仅仅是为了模拟多用户访问,服务端并发 ...
- 【转】Eric's并发用户数估算与Little定律的等价性
转自:http://www.cnblogs.com/hundredsofyears/p/3360305.html 在国内性能测试的领域有一篇几乎被奉为大牛之作的经典文章,一个名叫Eric Man Wo ...
- Eric's并发用户数估算与Little定律的等价性
在国内性能测试的领域有一篇几乎被奉为大牛之作的经典文章,一个名叫Eric Man Wong 于2004年发表了名为<Method for Estimating the Number of Con ...
- 并发模式与 RPS 模式之争,性能压测领域的星球大战
本文是<如何做好性能压测>系列专题分享的第四期,该专题将从性能压测的设计.实现.执行.监控.问题定位和分析.应用场景等多个纬度对性能压测的全过程进行拆解,以帮助大家构建完整的性能压测的理论 ...
- jdk8中java.util.concurrent包分析
并发框架分类 1. Executor相关类 Interfaces. Executor is a simple standardized interface for defining custom th ...
随机推荐
- Node.js 打造实时多人游戏框架
在 Node.js 如火如荼发展的今天,我们已经可以用它来做各种各样的事情.前段时间UP主参加了极客松活动,在这次活动中我们意在做出一款让“低头族”能够更多交流的游戏,核心功能便是 Lan Party ...
- VM中python2.7运行skier游戏,shell重启问题!!!!!!
在虚拟机win7系统python2.7,在该python中运行了 父与子中的skier游戏(代码手写), 出现如下问题: ================ RESTART: C:\Python27\S ...
- 更新Svn客户端后,右键菜单中没有TortoiseSVN
环境: OS: Windows XP sp3 升级后SVNServer: VisualSVN Server 2.7.3 升级后SVNClient: 小乌龟: ...
- 广播接收者 BroadcastReceiver
1. 分为动态注册和静态注册, 静态注册在清单文件里配置即可.动态创建为代码手动添加. 在锁屏广播中, 使用静态创建消息接受不成功, 原因未知. 动态即可. 代码如下: 2. 创建类, 继承与Broa ...
- .net MVC下跨域Ajax请求(CORS)
二.CROS (Cross-origin Resource Sharing) CROS相当于一种协议,由浏览器.服务端共同完成安全验证,进行安全的跨域资源共享.对于开发人员来说就跟在本站AJAX请求一 ...
- StringMVCWeb接受前台值的几种方式
这些决定与request header 的Content-Type属性 1.通过@RequestParam @RequestParam Map<String, Object> pa ...
- 风格附加css
#header #blogTitle { background: url("http://images.cnblogs.com/cnblogs_com/aiwuxia/1249780/o_1 ...
- ios调试技巧
一.概述1.掌握调试技巧,调试技术最基本,最重要的调试手段包括:单步跟踪,断点,变量观察等.单步跟踪(Step)所谓单步跟踪是指一行一行地执行程序,每执行一行语句后就停下来等待指示,这样你就能够仔细了 ...
- HTML5开发手机应用--viewport的作用--20150216
在用HTML5开发手机应用或手机网页时,<head>部分总会有如下一段代码,这段代码到底什么意思呢.在网上,大家会得到很多答案.我从网上搜集了部分介绍,整理一下,以留备用. <met ...
- 微信小程序canvas实现圆形计时器功能
index.js import Canvas from '../../utils/canvas.js'Page({ ...Canvas.options, /** * 页面的初始数据 */ data: ...