Multivariate Linear Regression
Multiple Features

Linear regression with multiple variables is also known as "multivariate linear regression".
We now introduce notation for equations where we can have any number of input variables.
The multivariable form of the hypothesis function accommodating these multiple features is as follows:
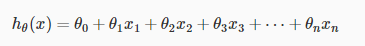
In order to develop intuition about this function, we can think about θ0 as the basic price of a house, θ1 as the price per square meter, θ2 as the price per floor, etc. x1 will be the number of square meters in the house, x2 the number of floors, etc.
Using the definition of matrix multiplication, our multivariable hypothesis function can be concisely represented as:
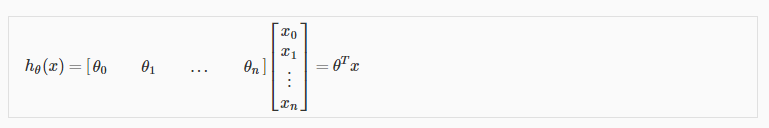
This is a vectorization of our hypothesis function for one training example; see the lessons on vectorization to learn more.
Remark: Note that for convenience reasons in this course we assume 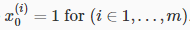 .This allows us to do matrix operations with theta and x. Hence making the two vectors 'θ' and
  match each other element-wise (that is, have the same number of elements: n+1).]
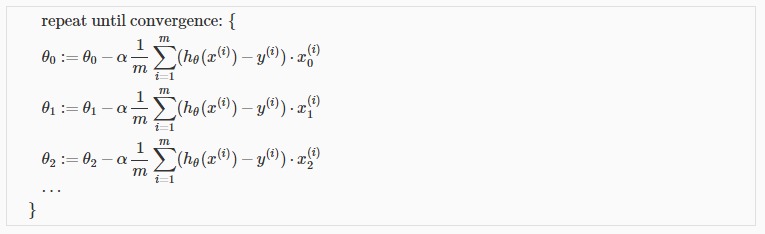
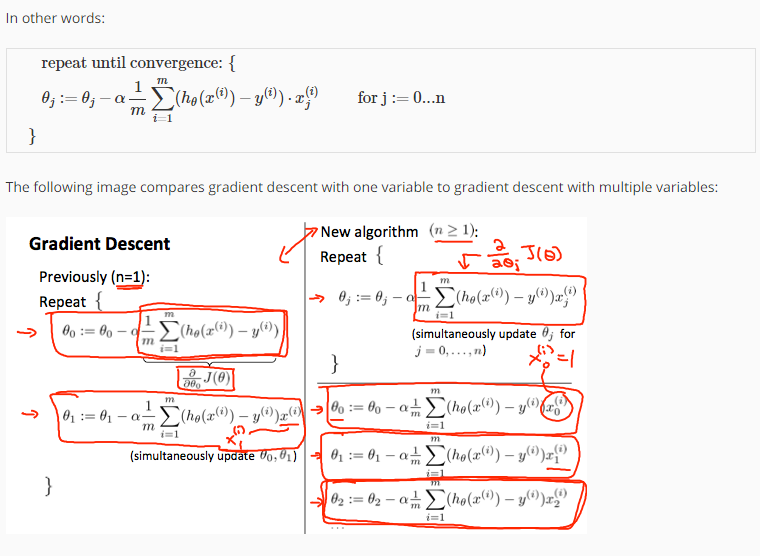
Gradient Descent For Multiple Variables
The gradient descent equation itself is generally the same form; we just have to repeat it for our 'n' features:
Gradient Descent in Practice I - Feature Scaling
Note: [6:20 - The average size of a house is 1000 but 100 is accidentally written instead]
We can speed up gradient descent by having each of our input values in roughly the same range. This is because θ will descend quickly on small ranges and slowly on large ranges, and so will oscillate inefficiently down to the optimum when the variables are very uneven.
The way to prevent this is to modify the ranges of our input variables so that they are all roughly the same. Ideally:
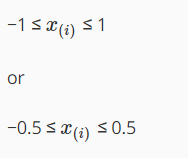
These aren't exact requirements; we are only trying to speed things up. The goal is to get all input variables into roughly one of these ranges, give or take a few.
Two techniques to help with this are feature scaling and mean normalization. Feature scaling involves dividing the input values by the range (i.e. the maximum value minus the minimum value) of the input variable, resulting in a new range of just 1. Mean normalization involves subtracting the average value for an input variable from the values for that input variable resulting in a new average value for the input variable of just zero. To implement both of these techniques, adjust your input values as shown in this formula:
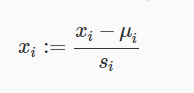
Where  is the average of all the values for feature (i) and s_i is the range of values (max - min), or s_i is the standard deviation.
Note that dividing by the range, or dividing by the standard deviation, give different results. The quizzes in this course use range - the programming exercises use standard deviation.
For example, if x_i represents housing prices with a range of 100 to 2000 and a mean value of 1000, then, x_i := \dfrac{price-1000}{1900}.
Gradient Descent in Practice II - Learning Rate
Note: [5:20 - the x -axis label in the right graph should be θ rather than No. of iterations ]
Debugging gradient descent. Make a plot with number of iterations on the x-axis. Now plot the cost function, J(θ) over the number of iterations of gradient descent. If J(θ) ever increases, then you probably need to decrease α.
Automatic convergence test. Declare convergence if J(θ) decreases by less than E in one iteration, where E is some small value such as 10−3. However in practice it's difficult to choose this threshold value.

It has been proven that if learning rate α is sufficiently small, then J(θ) will decrease on every iteration.

To summarize:
If α is too small: slow convergence.
If α is too large: may not decrease on every iteration and thus may not converge.
Features and Polynomial Regression
We can improve our features and the form of our hypothesis function in a couple different ways.
We can combine multiple features into one. For example, we can combine x1 and x2 into a new feature x3 by taking x1⋅x2.
Polynomial Regression
Our hypothesis function need not be linear (a straight line) if that does not fit the data well.
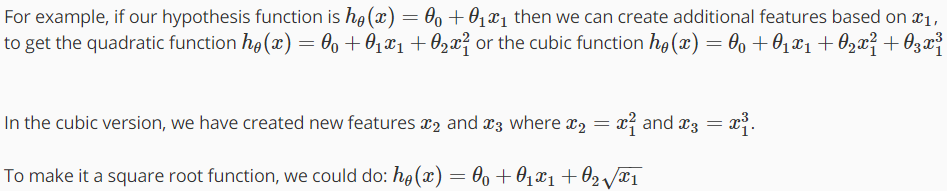
We can change the behavior or curve of our hypothesis function by making it a quadratic, cubic or square root function (or any other form).
One important thing to keep in mind is, if you choose your features this way then feature scaling becomes very important.

Multivariate Linear Regression的更多相关文章
- Machine Learning - week 2 - Multivariate Linear Regression
Multiple Features 上一章中,hθ(x) = θ0 + θ1x,表示只有一个 feature.现在,有多个 features,所以 hθ(x) = θ0 + θ1x1 + θ2x2 + ...
- 多元线性回归(Multivariate Linear Regression)简单应用
警告:本文为小白入门学习笔记 数据集: http://openclassroom.stanford.edu/MainFolder/DocumentPage.php?course=DeepLearnin ...
- Machine Learning – 第2周(Linear Regression with Multiple Variables、Octave/Matlab Tutorial)
Machine Learning – Coursera Octave for Microsoft Windows GNU Octave官网 GNU Octave帮助文档 (有900页的pdf版本) O ...
- 【转】Derivation of the Normal Equation for linear regression
I was going through the Coursera "Machine Learning" course, and in the section on multivar ...
- 机器学习---线性回归(Machine Learning Linear Regression)
线性回归是机器学习中最基础的模型,掌握了线性回归模型,有利于以后更容易地理解其它复杂的模型. 线性回归看似简单,但是其中包含了线性代数,微积分,概率等诸多方面的知识.让我们先从最简单的形式开始. 一元 ...
- Andrew Ng Machine Learning 专题【Linear Regression】
此文是斯坦福大学,机器学习界 superstar - Andrew Ng 所开设的 Coursera 课程:Machine Learning 的课程笔记. 力求简洁,仅代表本人观点,不足之处希望大家探 ...
- CheeseZH: Stanford University: Machine Learning Ex1:Linear Regression
(1) How to comput the Cost function in Univirate/Multivariate Linear Regression; (2) How to comput t ...
- Coursera machine learning 第二周 quiz 答案 Linear Regression with Multiple Variables
https://www.coursera.org/learn/machine-learning/exam/7pytE/linear-regression-with-multiple-variables ...
- Multivariate Adaptive Regression Splines (MARSplines)
Introductory Overview Regression Problems Multivariate Adaptive Regression Splines Model Selection a ...
随机推荐
- exit---退出目前的shell
exit命令 exit命令同于退出shell,并返回给定值.在shell脚本中可以终止当前脚本执行.执行exit可使shell以指定的状态值退出.若不设置状态值参数,则shell以预设值退出.状态 ...
- C++ static 静态成员变量 和 静态成员函数
静态(static) 成员 变量 1• 静态成员变量的初始化须要在类外完毕. 2• 静态成员不属于详细的某个对象,而属于整个类: 3• 全部对象共享本类中的静态成员: 4• 静态成员最好直接通 ...
- 徒弟们对话,遇到sb领导,离职吧
由于涉及私密,所以qq号做了干扰.见谅. 非常多人以为在公司,你优化了几十个sql老板就给你涨工资了.或者你bbed搞点特殊恢复就涨工资了. 或者解决某些棘手问题就涨工资了. 那是不正确的. 遇 ...
- 2.2 Consumer API官网剖析(博主推荐)
不多说,直接上干货! 一切来源于官网 http://kafka.apache.org/documentation/ 2.2 Consumer API 2.2.消费者API 随着0..0版本,我们已经增 ...
- jQuery高级选择器和其等价方法
jQuery选择器和css一样,但兼容性更好 <body> <p>p1</p> <p>p1</p> <p>p1</p> ...
- NOIP2015运输计划(二分答案)
题目描述 公元2044年,人类进入了宇宙纪元. L国有n个星球,还有n-1条双向航道,每条航道建立在两个星球之间,这n-1条航道连通了L国的所有星球. 小P掌管一家物流公司,该公司有很多个运输计划,每 ...
- 【Codeforces Round #452 (Div. 2) B】Months and Years
[链接] 我是链接,点我呀:) [题意] 在这里输入题意 [题解] 闰,平,平 平,闰,平 平,平,闰 平,平,平 4种情况都考虑到就好. 可能有重复的情况. 但是没关系啦. [代码] #includ ...
- 【Codeforces Round #452 (Div. 2) C】 Dividing the numbers
[链接] 我是链接,点我呀:) [题意] 在这里输入题意 [题解] n为偶数. l = 1, r = n (l,r)放在一组 l++,r-- 新的l,r放在另外一组 直到l+1==r 这个时候,判断两 ...
- 【2017"百度之星"程序设计大赛 - 初赛(B)】度度熊的交易计划
[链接]点击打开链接 [题意] 在这里写题意 [题解] 先设一个超级源点,向每个片区都建一条边,容量为b,费用为-a; 然后从每个片区再连一条边,指向一个超级汇点. 容量为d,费用为c; 然后从起点到 ...
- 怎样 TabHostFragment自己定义 tab键(indicator)
1 获得 tabHostFragment: ActionBarActivity activity2 = (ActionBarActivity) activity; mTabHost = new Fra ...