ELK实践
一、ElasticSearch+FileBeat+Kibana搭建平台
在C# 里面运行程序,输出日志(xxx.log 文本文件)到FileBeat配置的路径下面。
平台搭建,参考之前的随笔。
FileBeat配置如下:
###################### Filebeat Configuration Example #########################

# This file is an example configuration file highlighting only the most common

# options. The filebeat.reference.yml file from the same directory contains all the

# supported options with more comments. You can use it as a reference.

#

# You can find the full configuration reference here:

# https://www.elastic.co/guide/en/beats/filebeat/index.html

# For more available modules and options, please see the filebeat.reference.yml sample

# configuration file.

#=========================== Filebeat inputs =============================

filebeat.inputs:

# Each - is an input. Most options can be set at the input level, so

# you can use different inputs for various configurations.

# Below are the input specific configurations.

- type: log

# Paths that should be crawled and fetched. Glob based paths.

  #paths:

    #- E:\filebeat-6.6.2-windows-x86_64\data\logstash-tutorial.log\*.log

    #- c:\programdata\elasticsearch\logs\*

  paths:

    - E:\ELKLog\log\*.log

#- type: redis

  #hosts: ["localhost:6379"]

  #password: "hy900511@"

  # Change to true to enable this input configuration.

  enabled: true

  #scan_frequency: 5s

  # Exclude lines. A list of regular expressions to match. It drops the lines that are

  # matching any regular expression from the list.

  #exclude_lines: ['^DBG']

  # Include lines. A list of regular expressions to match. It exports the lines that are

  # matching any regular expression from the list.

  #include_lines: ['^ERR', '^WARN']

  # Exclude files. A list of regular expressions to match. Filebeat drops the files that

  # are matching any regular expression from the list. By default, no files are dropped.

  #exclude_files: ['.gz$']

  # Optional additional fields. These fields can be freely picked

  # to add additional information to the crawled log files for filtering

  #fields:

  #  level: debug

  #  review: 1

  ### Multiline options

  # Multiline can be used for log messages spanning multiple lines. This is common

  # for Java Stack Traces or C-Line Continuation

  # The regexp Pattern that has to be matched. The example pattern matches all lines starting with [

  #multiline.pattern: ^\[

  # Defines if the pattern set under pattern should be negated or not. Default is false.

  #multiline.negate: false

  # Match can be set to "after" or "before". It is used to define if lines should be append to a pattern

  # that was (not) matched before or after or as long as a pattern is not matched based on negate.

  # Note: After is the equivalent to previous and before is the equivalent to to next in Logstash

  #multiline.match: after

#============================= Filebeat modules ===============================

filebeat.config.modules:

  # Glob pattern for configuration loading

  path: ${path.config}/modules.d/*.yml

  # Set to true to enable config reloading

  reload.enabled: false

  # Period on which files under path should be checked for changes

  #reload.period: 10s

#==================== Elasticsearch template setting ==========================

setup.template.settings:

  index.number_of_shards: 3

  #index.codec: best_compression

  #_source.enabled: false

#================================ General =====================================

# The name of the shipper that publishes the network data. It can be used to group

# all the transactions sent by a single shipper in the web interface.

#name:

# The tags of the shipper are included in their own field with each

# transaction published.

#tags: ["service-X", "web-tier"]

# Optional fields that you can specify to add additional information to the

# output.

#fields:

#  env: staging

#============================== Dashboards =====================================

# These settings control loading the sample dashboards to the Kibana index. Loading

# the dashboards is disabled by default and can be enabled either by setting the

# options here, or by using the `-setup` CLI flag or the `setup` command.

#setup.dashboards.enabled: false

# The URL from where to download the dashboards archive. By default this URL

# has a value which is computed based on the Beat name and version. For released

# versions, this URL points to the dashboard archive on the artifacts.elastic.co

# website.

#setup.dashboards.url:

#============================== Kibana =====================================

# Starting with Beats version 6.0.0, the dashboards are loaded via the Kibana API.

# This requires a Kibana endpoint configuration.

setup.kibana:

  # Kibana Host

  # Scheme and port can be left out and will be set to the default (http and 5601)

  # In case you specify and additional path, the scheme is required: http://localhost:5601/path

  # IPv6 addresses should always be defined as: https://[2001:db8::1]:5601

  #host: "localhost:5601"

  # Kibana Space ID

  # ID of the Kibana Space into which the dashboards should be loaded. By default,

  # the Default Space will be used.

  #space.id:

#============================= Elastic Cloud ==================================

# These settings simplify using filebeat with the Elastic Cloud (https://cloud.elastic.co/).

# The cloud.id setting overwrites the `output.elasticsearch.hosts` and

# `setup.kibana.host` options.

# You can find the `cloud.id` in the Elastic Cloud web UI.

#cloud.id:

# The cloud.auth setting overwrites the `output.elasticsearch.username` and

# `output.elasticsearch.password` settings. The format is `<user>:<pass>`.

#cloud.auth:

#================================ Outputs =====================================

# Configure what output to use when sending the data collected by the beat.

#-------------------------- Elasticsearch output ------------------------------

output.elasticsearch:

  # Array of hosts to connect to.

  hosts: ["localhost:9200"]

  # Enabled ilm (beta) to use index lifecycle management instead daily indices.

  #ilm.enabled: false

  # Optional protocol and basic auth credentials.

  #protocol: "https"

  #username: "elastic"

  #password: "changeme"

#----------------------------- Logstash output --------------------------------

#output.logstash:

  # The Logstash hosts

  #hosts: ["localhost:5044"]

  # Optional SSL. By default is off.

  # List of root certificates for HTTPS server verifications

  #ssl.certificate_authorities: ["/etc/pki/root/ca.pem"]

  # Certificate for SSL client authentication

  #ssl.certificate: "/etc/pki/client/cert.pem"

  # Client Certificate Key

  #ssl.key: "/etc/pki/client/cert.key"

#================================ Processors =====================================

# Configure processors to enhance or manipulate events generated by the beat.

processors:

  - add_host_metadata: ~

  - add_cloud_metadata: ~

#================================ Logging =====================================

# Sets log level. The default log level is info.

# Available log levels are: error, warning, info, debug

#logging.level: debug

# At debug level, you can selectively enable logging only for some components.

# To enable all selectors use ["*"]. Examples of other selectors are "beat",

# "publish", "service".

#logging.selectors: ["*"]

#============================== Xpack Monitoring ===============================

# filebeat can export internal metrics to a central Elasticsearch monitoring

# cluster.  This requires xpack monitoring to be enabled in Elasticsearch.  The

# reporting is disabled by default.

# Set to true to enable the monitoring reporter.

#xpack.monitoring.enabled: false

# Uncomment to send the metrics to Elasticsearch. Most settings from the

# Elasticsearch output are accepted here as well. Any setting that is not set is

# automatically inherited from the Elasticsearch output configuration, so if you

# have the Elasticsearch output configured, you can simply uncomment the

# following line.

#xpack.monitoring.elasticsearch:
以上程序都在 服务启动着。
然后在C#中,执行程序将 日志保存到 E:\ELKLog\log\
【注意:Filebeat是以行来识别日志的更改,所以将日志的同一段话以行写入】
在Kibana中看到:
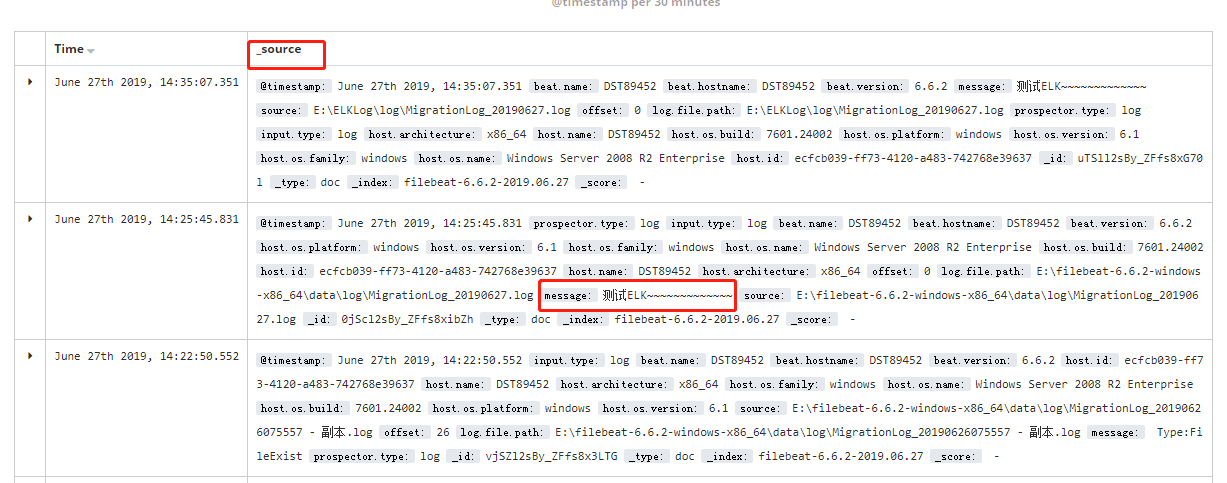
_source字段拆分需要用到logstash。
二、配置Filebeat多行合并
一些错误日志,都是自动换行的。不配置的话 本来是一条日志的,在ES中就显示成了多条
于是配置multiline参数;
###################### Filebeat Configuration Example #########################

# This file is an example configuration file highlighting only the most common

# options. The filebeat.reference.yml file from the same directory contains all the

# supported options with more comments. You can use it as a reference.

#

# You can find the full configuration reference here:

# https://www.elastic.co/guide/en/beats/filebeat/index.html

# For more available modules and options, please see the filebeat.reference.yml sample

# configuration file.

#=========================== Filebeat inputs =============================

filebeat.inputs:

# Each - is an input. Most options can be set at the input level, so

# you can use different inputs for various configurations.

# Below are the input specific configurations.

- type: log

# Paths that should be crawled and fetched. Glob based paths.

  #paths:

    #- E:\filebeat-6.6.2-windows-x86_64\data\logstash-tutorial.log\*.log

    #- c:\programdata\elasticsearch\logs\*

  paths:

    - E:\ELKLog\log\*.log

#- type: redis

  #hosts: ["localhost:6379"]

  #password: "hy900511@"

  # Change to true to enable this input configuration.

  enabled: true

  #scan_frequency: 5s

  # Exclude lines. A list of regular expressions to match. It drops the lines that are

  # matching any regular expression from the list.

  #exclude_lines: ['^DBG']

  # Include lines. A list of regular expressions to match. It exports the lines that are

  # matching any regular expression from the list.

  #include_lines: ['^ERR', '^WARN']

  # Exclude files. A list of regular expressions to match. Filebeat drops the files that

  # are matching any regular expression from the list. By default, no files are dropped.

  #exclude_files: ['.gz$']

  # Optional additional fields. These fields can be freely picked

  # to add additional information to the crawled log files for filtering

  #fields:

  #  level: debug

  #  review: 1

  ### Multiline options

  # Multiline can be used for log messages spanning multiple lines. This is common

  # for Java Stack Traces or C-Line Continuation

  # The regexp Pattern that has to be matched. The example pattern matches all lines starting with [

  multiline.pattern: '^Time'

  # Defines if the pattern set under pattern should be negated or not. Default is false.

  multiline.negate: true

  # Match can be set to "after" or "before". It is used to define if lines should be append to a pattern

  # that was (not) matched before or after or as long as a pattern is not matched based on negate.

  # Note: After is the equivalent to previous and before is the equivalent to to next in Logstash

  multiline.match: after

  # max_lines: 500

  # timeout: 5s

#============================= Filebeat modules ===============================

filebeat.config.modules:

  # Glob pattern for configuration loading

  path: ${path.config}/modules.d/*.yml

  # Set to true to enable config reloading

  reload.enabled: false

  # Period on which files under path should be checked for changes

  #reload.period: 10s

#==================== Elasticsearch template setting ==========================

setup.template.settings:

  index.number_of_shards: 3

  #index.codec: best_compression

  #_source.enabled: false

#================================ General =====================================

# The name of the shipper that publishes the network data. It can be used to group

# all the transactions sent by a single shipper in the web interface.

#name:

# The tags of the shipper are included in their own field with each

# transaction published.

#tags: ["service-X", "web-tier"]

# Optional fields that you can specify to add additional information to the

# output.

#fields:

#  env: staging

#============================== Dashboards =====================================

# These settings control loading the sample dashboards to the Kibana index. Loading

# the dashboards is disabled by default and can be enabled either by setting the

# options here, or by using the `-setup` CLI flag or the `setup` command.

#setup.dashboards.enabled: false

# The URL from where to download the dashboards archive. By default this URL

# has a value which is computed based on the Beat name and version. For released

# versions, this URL points to the dashboard archive on the artifacts.elastic.co

# website.

#setup.dashboards.url:

#============================== Kibana =====================================

# Starting with Beats version 6.0.0, the dashboards are loaded via the Kibana API.

# This requires a Kibana endpoint configuration.

setup.kibana:

  # Kibana Host

  # Scheme and port can be left out and will be set to the default (http and 5601)

  # In case you specify and additional path, the scheme is required: http://localhost:5601/path

  # IPv6 addresses should always be defined as: https://[2001:db8::1]:5601

  #host: "localhost:5601"

  # Kibana Space ID

  # ID of the Kibana Space into which the dashboards should be loaded. By default,

  # the Default Space will be used.

  #space.id:

#============================= Elastic Cloud ==================================

# These settings simplify using filebeat with the Elastic Cloud (https://cloud.elastic.co/).

# The cloud.id setting overwrites the `output.elasticsearch.hosts` and

# `setup.kibana.host` options.

# You can find the `cloud.id` in the Elastic Cloud web UI.

#cloud.id:

# The cloud.auth setting overwrites the `output.elasticsearch.username` and

# `output.elasticsearch.password` settings. The format is `<user>:<pass>`.

#cloud.auth:

#================================ Outputs =====================================

# Configure what output to use when sending the data collected by the beat.

#-------------------------- Elasticsearch output ------------------------------

output.elasticsearch:

  # Array of hosts to connect to.

  hosts: ["localhost:9200"]

  # Enabled ilm (beta) to use index lifecycle management instead daily indices.

  #ilm.enabled: false

  # Optional protocol and basic auth credentials.

  #protocol: "https"

  #username: "elastic"

  #password: "changeme"

#----------------------------- Logstash output --------------------------------

#output.logstash:

  # The Logstash hosts

  #hosts: ["localhost:5044"]

  # Optional SSL. By default is off.

  # List of root certificates for HTTPS server verifications

  #ssl.certificate_authorities: ["/etc/pki/root/ca.pem"]

  # Certificate for SSL client authentication

  #ssl.certificate: "/etc/pki/client/cert.pem"

  # Client Certificate Key

  #ssl.key: "/etc/pki/client/cert.key"

#================================ Processors =====================================

# Configure processors to enhance or manipulate events generated by the beat.

processors:

  - add_host_metadata: ~

  - add_cloud_metadata: ~

#================================ Logging =====================================

# Sets log level. The default log level is info.

# Available log levels are: error, warning, info, debug

#logging.level: debug

# At debug level, you can selectively enable logging only for some components.

# To enable all selectors use ["*"]. Examples of other selectors are "beat",

# "publish", "service".

#logging.selectors: ["*"]

#============================== Xpack Monitoring ===============================

# filebeat can export internal metrics to a central Elasticsearch monitoring

# cluster.  This requires xpack monitoring to be enabled in Elasticsearch.  The

# reporting is disabled by default.

# Set to true to enable the monitoring reporter.

#xpack.monitoring.enabled: false

# Uncomment to send the metrics to Elasticsearch. Most settings from the

# Elasticsearch output are accepted here as well. Any setting that is not set is

# automatically inherited from the Elasticsearch output configuration, so if you

# have the Elasticsearch output configured, you can simply uncomment the

# following line.

#xpack.monitoring.elasticsearch:
配置中表示:
以Time开头的行是一条完整日志的开始,它和后面多个不以Time开头的行组成一条完整日志;【因为我的日志message都是以Time= 开头,所以这样配置】
参考:应该怎样正确配置filebeat文件(包括multiline、input_type等)
结果如下:

ELK实践的更多相关文章
- 大雄的elk实践
目录 一.ElK环境搭建 1.1.elasticsearch 1..kibana 1..logstash二.elk实践 2.1 使用elk分析nginx日志 一.ElK环境搭建 1.1 elast ...
- Node 框架接入 ELK 实践总结
本文由云+社区发表 作者:J2X 我们都有过上机器查日志的经历,当集群数量增多的时候,这种原始的操作带来的低效率不仅给我们定位现网问题带来极大的挑战,同时,我们也无法对我们服务框架的各项指标进行有效的 ...
- ELK实践-Kibana定制化扩展
纵观任何一家大数据平台的技术架构,总少不了ElasticSearch:ES作为溶合了后端存储.快速检索.OLAP分析等功能的一套开源组件,更绝的是提供了一套集数据采集与前端展现为一体的框架(即ELK) ...
- ELK实践(二):收集Nginx日志
Nginx访问日志 这里补充下Nginx访问日志使用的说明.一般在nginx.conf主配置文件里需要定义一种格式: log_format main '$remote_addr - $remote_u ...
- ELK实践(一):基础入门
虽然用了ELK很久了,但一直苦于没有自己尝试搭建过,所以想抽时间尝试尝试.原本打算按照教程 <ELK集中式日志平台之二 - 部署>(作者:樊浩柏科学院) 进行测试的,没想到一路出了很多坑, ...
- logstash 学习小记
logstash 学习小记 标签(空格分隔): 日志收集 Introduce Logstash is a tool for managing events and logs. You can use ...
- springcloud --- spring cloud sleuth和zipkin日志管理(spring boot 2.18)
前言 在spring cloud分布式架构中,系统被拆分成了许多个服务单元,业务复杂性提高.如果出现了异常情况,很难定位到错误位置,所以需要实现分布式链路追踪,跟进一个请求有哪些服务参与,参与的顺序如 ...
- Nginx双机主备(Keepalived实现)
前言 首先介绍一下Keepalived,它是一个高性能的服务器高可用或热备解决方案,起初是专为LVS负载均衡软件设计的,Keepalived主要来防止服务器单点故障的发生问题,可以通过其与Nginx的 ...
- ELK初步实践
ELK是一个日志分析和统计框架,是Elasticsearch.Logstash和Kibana三个核心开源组件的首字母缩写,实践中还需要filebeat.redis配合完成日志的搜集. 组件一览 名称 ...
随机推荐
- Linux jdk8 安装
wegt 命令安装 wget --no-cookies --no-check-certificate --header "Cookie: gpw_e24=http%3A%2F%2Fwww.o ...
- mybatis关键映射的另一种写法
- AS3.0频谱-01
AS3.0频谱系列-01: package fengzi.spectrum { //import fengzi.colors.GetColor; import flash.display.Sprite ...
- go 学习笔记(2)go test
Test 的写法: 每一个test文件必须import 一个"testing" test文件下的每一个test case均必须以Test开头并且符合TestXxx形式,否则go t ...
- Spring Boot 五种热部署方式
[推荐]2019 Java 开发者跳槽指南.pdf(吐血整理)>>> 1.模板热部署 在SpringBoot中,模板引擎的页面默认是开启缓存的,如果修改了页面的内容,则刷新页面是得不 ...
- ZFS文件系统及Freenas介绍
一.简介 1.什么是zfs文件系统 ZFS文件系统的英文名称为Zettabyte File System,也叫动态文件系统(Dynamic File System),是第一个128位文件系统.最初是由 ...
- web API .net - .net core 对比学习-依赖注入
今天我们来看一下 .net web api 和 .net core web api依赖注入机制的差异. 首先我们分别在.net web api 和 .net core web api新建文件夹Serv ...
- 常用的MySQL命令
1.新建数据库: create database person; 2.使用数据库 use person: 3.创建一个表格 create table student ( id int(10) not ...
- Java中使用HttpPost上传文件以及HttpGet进行API请求(包含HttpPost上传文件)
Java中使用HttpPost上传文件以及HttpGet进行API请求(包含HttpPost上传文件) 一.HttpPost上传文件 public static String getSuffix(fi ...
- go语言实现限流器
本文:https://chai2010.cn/advanced-go-programming-book/ch5-web/ch5-06-ratelimit.html Ratelimit 服务流量限制 计 ...