ArcGIS JS 学习笔记2 实现仿百度的拖拽画圆
一、前言
吐槽一下,百度在国内除了百度地图是良心产品外,其他的真的不敢恭维。在上一篇笔记里,我已经实现了自定义的地图测量模块。在百度地图里面(其他地图)都有一个周边搜索的功能,拖拽画一个圆,然后以圆半径进行搜索(也就是缓冲区╮(╯_╰)╭)。

这次的目标,就是要山寨这个拖拽画圆的功能,我先放一个效果图。

二、开始山寨
我们先想一想要实现这个功能需要哪些步骤。
- 拖拽
- 画圆
- 通知拖拽结束
2.1 实现拖拽
关于拖拽,有graphicslayer的拖拽事件和map的拖拽事件,如何选择呢?先来看一看官方文档。

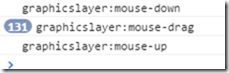
graphicslayer 的鼠标事件

map的鼠标事件
在graphic的鼠标事件里面,鼠标事件触发的条件是鼠标必须在一个graphic上(红色标记处),但是graphicslayer的mouse-drag事件好像并不要这个条件,而且事件说明和map的一样。我们在仔细看一下文档,Arcgis文档在这个细节处理上特别值得学习。graphicslayer和map的鼠标事件文档中,开头都是mouse-down(mouse button is pressed down),结尾都是mouse-up(mouse button is released)。现在大家都发现了吧,两者的drag事件都是和mouse-down、mouse-up有关联的。首先,按下鼠标(mouse-down)是触发drag 的前提条件。然后,松开鼠标(mouse-up)是drag事件结束的标识。也就是说,如果要触发drag事件,就一定会触发mouse-down和mouse-up事件,所以graphicslayer的drag事件也需要鼠标在graphic上才能触发。
解释的不错,我选择map!下面先上两段代码来说一下为什么要选择map的drag事件原因。
map的鼠标事件,添加了一个graphicslayer和一个graphic
require([

                "dojo/dom", "dojo/on",

                "esri/map","esri/layers/GraphicsLayer", "esri/geometry/Point", "esri/symbols/SimpleMarkerSymbol",

                "esri/symbols/SimpleLineSymbol", "esri/graphic", "esri/Color",

                "dojo/domReady!"],

            function (dom, on, Map, GraphicsLayer,Point,

                      SimpleMarkerSymbol, SimpleLineSymbol, Graphic, Color) {

                var map = new Map("map", {

                    center: [103, 24.5],

                    zoom: 9,

                    basemap: "osm"

                });

                var graphicsLayer=new GraphicsLayer();

                map.addLayer(graphicsLayer);

                map.on("load", function () {

                    var sms = new SimpleMarkerSymbol(SimpleMarkerSymbol.STYLE_SQUARE, 20,

                            new SimpleLineSymbol(SimpleLineSymbol.STYLE_SOLID,

                                    new Color([255, 0, 0]), 1),

                            new Color([0, 255, 0, 0.25]));

                    var point = new Point(103, 24.5);

                    var graphic = new Graphic(point, sms);

                    map.graphics.add(graphic);

                    graphicsLayer.add(graphic);

                });

                map.on("mouse-down", function (evt) {

                    console.log("map:mouse-down");

                });

                map.on("mouse-drag", function (evt) {

                    console.log("map:mouse-drag");

                });

                map.on("mouse-up", function (evt) {

                    console.log("map:mouse-up");

                });

            });
当在map上进行拖拽时,控制台的输出如下:

当把鼠标移动到graphic上进行拖拽时,控制台输出如下:

它也触发了地图的拖拽事件。
接着在看一看graphicslayer的鼠标事件,我添加了一个graphicslayer和一个graphic。
require([

                "dojo/on",

                "esri/map", "esri/layers/GraphicsLayer", "esri/geometry/Point", "esri/symbols/SimpleMarkerSymbol",

                "esri/symbols/SimpleLineSymbol", "esri/graphic", "esri/Color",

                "dojo/domReady!"],

            function (on, Map, GraphicsLayer, Point,

                      SimpleMarkerSymbol, SimpleLineSymbol, Graphic, Color) {

                var map = new Map("map", {

                    center: [102, 24.5],

                    zoom: 9,

                    basemap: "osm"

                });

                var graphicsLayer=new GraphicsLayer();
var graphic;

                map.addLayer(graphicsLayer);

                map.on("load", function () {

                    var sms = new SimpleMarkerSymbol(SimpleMarkerSymbol.STYLE_SQUARE, 20,

                            new SimpleLineSymbol(SimpleLineSymbol.STYLE_SOLID,

                                    new Color([255, 0, 0]), 1),

                            new Color([0, 255, 0, 0.25]));

                    var point = new Point(102, 24.5);

                    graphic = new Graphic(point, sms);

                    graphicsLayer.add(graphic);

                    console.log(map.graphics)

                });

                graphicsLayer.on("mouse-down", function (evt) {

                    console.log("graphicslayer:mouse-down");

                });

                graphicsLayer.on("mouse-drag", function (evt) {

                    console.log("graphicslayer:mouse-drag");

                });

                graphicsLayer.on("mouse-up", function (evt) {

                    console.log("graphicslayer:mouse-up");

                });

            });
当在map上拖拽时候,这时候给人的感觉应该是,graphicslayer也在地图上,也应该会触发graphicslayer的拖拽事件,然而并没有,这时候控制台的输出为:

当把鼠标移动到graphic上进行拖拽时,控制台输出如下:
这时终于触发了graphicslayer的拖拽事件。
到现在为止,感觉好像二者区别不大。但是在进行拖拽时,移动的是地图,我们要实现的效果是移动graphic,这时就要用到如下方法:

我们先来实现在graphicslayer上移动graphic。
graphicsLayer.on("mouse-down", function (evt) {

      console.log("graphicslayer:mouse-down");

      map.disableMapNavigation();

     });

 graphicsLayer.on("mouse-drag", function (evt) {

       console.log("graphicslayer:mouse-drag");

       graphic.setGeometry(evt.mapPoint);

     });

graphicsLayer.on("mouse-up", function (evt) {

       console.log("graphicslayer:mouse-up");

       map.enableMapNavigation();

     });
我们把graphic移动到昆明市,看看控制台的输出:


这时在拖拽事件里移动了graphic,而且事件也按预期的顺序发生了。但是!但是!但是!这是鼠标一直在graphic上的时候才能触发的事件,当我们飞快的移动鼠标,使鼠标不在graphic上,这时就会有奇怪的行为发生了。
还是把graphic移动到昆明市(以很快的速度),看看控制台的输出:


当鼠标移动到昆明市的时候,松开鼠标,并没有触发mous-up事件。现在在吧鼠标移到graphic上,你会发现不用点击鼠标graphic也会随着鼠标一起移动,要停止的话只有再次点击鼠标并松开,这时控制台输出如下:

所以如果选用graphiclayer的drag事件来实现拖拽按钮的话,用户体验会很糟糕,所以graphicslayer的drag事件不能用!
接下来实现map的drag事件,删除原来map的mouse-donw 事件,替换成graphicslayerdmouse-down。接着在graphic上加了个
isMouseDown属性,判断是否要拖拽这个graphic。
graphicsLayer.on("mouse-down", function (evt) {

     console.log("graphicslayer:mouse-down");

     graphic.isMouseDown=true;

     map.disableMapNavigation();

   });

map.on("mouse-drag", function (evt) {

     console.log("map:mouse-drag");

     if( graphic.isMouseDown){

     graphic.setGeometry(evt.mapPoint);

     }

  });

map.on("mouse-up", function (evt) {

      console.log("map:mouse-up");

      map.enableMapNavigation();

      graphic.isMouseDown=false;

   });
这次就能很好的解决在graphicslayer上遇到的问题。
2.2画圆
解决了拖拽的问题,接下来就可以实现拖拽画圆了。我们传入中心点绘制制初始化圆,默认半径为500米,
startDrawCircle: function (centerPoint) {

                this._unregistMapEvents();

                this.centerPoint = centerPoint;

                this.circle = this._createCircle(centerPoint, 500);

                var dragPoint = this._createDragBtnPoint(this.circle, centerPoint);

                this.circleGraphic = new Graphic(this.circle, this.defaults.fillSymbol);

                this.labelGraphic = new Graphic(dragPoint, this._createDistanceSymbol(500));

                var dragGraphic = new Graphic(dragPoint, this.defaults.dragButtonSymbol);

                this._measureLayer.add(this.circleGraphic);

                this._measureLayer.add(dragGraphic);

                this._measureLayer.add(this.labelGraphic);

                this._initialMapEvents();

            },
第一步我们先取消上一次的画圆注册的map鼠标事件,第二步添加初始化圆,第三添加拖拽按钮和半径文描述。在计算拖拽按钮的为止时,可以用圆的extent来进行计算。
_createDragBtnPoint: function (geometry, center) {

                var extent = geometry.getExtent();

                var xmax = extent.xmax;

                return new Point([xmax, center.y], center.spatialReference)

            },
好了,现在所有的准备工作已经就绪,在结合前面的graphic拖拽,就可以轻松愉快的完成拖拽画圆了。
2.3通知拖拽结束
当每一次拖拽结束是,发出一次通知告诉用户绘制结束是很有必要的。这次就借助map的drag-end事件来通知用户
map.on("mouse-drag-end", lang.hitch(this, function (evt) {

  if (this.dragGraphic && this.dragGraphic.isMouseDown) {

   this.emit("drag-end", {circle: this.circle});

   this.dragGraphic.isMouseDown = false;

   this.defaults.map.enableMapNavigation();

   this.defaults.map.setMapCursor("default");

   }

})
通过 this.emit("drag-end", {circle: this.circle}); 我们就可以向外部发出拖拽结束的通知。
2.4 源码
/**

 * Created by Extra

 * Description:实现拖拽绘制圆,仿百度缓冲区搜索样式

 * version: 1.0.0

 */

define("dextra/dijit/DrawDragCircle", [

        "require",

        "dojo/dom",

        "dojo/query",

        "dojo/_base/declare",

        "dojo/_base/lang",

        "dojo/Evented",

        "dojo/on",

        "esri/graphic",

        "esri/layers/GraphicsLayer",

        "esri/Color",

        "esri/symbols/Font",

        "esri/geometry/Point",

        "esri/geometry/Circle",

        "esri/geometry/Polyline",

        "esri/symbols/SimpleMarkerSymbol",

        "esri/symbols/PictureMarkerSymbol",

        "esri/symbols/SimpleLineSymbol",

        "esri/symbols/SimpleFillSymbol",

        "esri/symbols/TextSymbol",

        "esri/geometry/geometryEngine",

    ],

    function (require, dom, query, declare, lang, Evented, on,

              Graphic, GraphicsLayer,

              Color, Font, Point, Circle, Polyline, MarkerSymbol, PictureMarkerSymbol, LineSymbol, FillSymbol, TextSymbol, geometryEngine) {

        return declare(Evented, {

            declaredClass: "dextra.dijit.DrawDragCircle",

            defaults: {

                map: null,

                maxRadius: 5000,

                markerSymbol: new MarkerSymbol(MarkerSymbol.STYLE_SQUARE, 20,

                    new LineSymbol(LineSymbol.STYLE_SOLID,

                        new Color("#DC143C"), 2),

                    new Color("#FFA500")),

                dragButtonSymbol: new PictureMarkerSymbol({

                    "url": require.toUrl("./images/dragButton.png"),

                    "height": 21,

                    "width": 33

                }),

                lineSymbol: new LineSymbol(

                    LineSymbol.STYLE_SOLID,

                    new Color("#FFA500"), 2),

                fillSymbol: new FillSymbol(FillSymbol.STYLE_SOLID,

                    new LineSymbol(LineSymbol.STYLE_SOLID,

                        new Color([0, 155, 255, 0.55]), 2), new Color([0, 155, 255, 0.55])),

            },

            circleGraphic: null,

            circle: null,

            labelGraphic: null,

            dragGraphic: null,

            _measureLayer: null,

            _mapEvents: [],

            constructor: function (options) {

                declare.safeMixin(this.defaults, options);

                this._measureLayer = new GraphicsLayer();

                this.defaults.map.addLayer(this._measureLayer);

                this._initialMeasureLayer();

            },

            //初始化测量图层事件

            _initialMeasureLayer: function () {

                //开始拖拽绘制圆

                this._measureLayer.on("mouse-down", lang.hitch(this, function (evt) {

                    var graphic = evt.graphic;

                    if (graphic.symbol.type == "picturemarkersymbol") {

                        this.dragGraphic = graphic;

                        this.dragGraphic.isMouseDown = true;

                        this.defaults.map.disableMapNavigation();

                        graphic.getDojoShape().moveToFront();

                        this.defaults.map.setMapCursor("pointer");

                    }

                }));

                //提示可以拖拽

                this._measureLayer.on("mouse-over", lang.hitch(this, function (evt) {

                    var graphic = evt.graphic;

                    if (graphic.symbol.type == "picturemarkersymbol") {

                        this.defaults.map.setMapCursor("pointer");

                    }

                }));

               //恢复鼠标状态

                this._measureLayer.on("mouse-out", lang.hitch(this, function (evt) {

                    this.defaults.map.setMapCursor("default");

                }));

            },

            _initialMapEvents: function () {

                this._mapEvents = [];

                //拖拽绘制圆

                this._mapEvents.push(this.defaults.map.on("mouse-drag", lang.hitch(this, function (evt) {

                    if (this.dragGraphic != null && this.dragGraphic.isMouseDown) {

                        var dragGraphic = this.dragGraphic;

                        var dragPoint = evt.mapPoint;

                        if (this.centerPoint.y != dragPoint.y) {

                            dragPoint.setY(this.centerPoint.y);

                        }

                        var radius = this._calDistance(this.centerPoint, dragPoint);

                        if (radius <= this.defaults.maxRadius) {

                            this._measureLayer.remove(this.circleGraphic);

                            this.circle = this._createCircle(this.centerPoint, radius);

                            this.circleGraphic = new Graphic(this.circle, this.defaults.fillSymbol);

                            dragGraphic.setGeometry(dragPoint);

                            this.labelGraphic.setGeometry(dragPoint).setSymbol(this._createDistanceSymbol(radius))

                            this._measureLayer.add(this.circleGraphic);

                            this.circleGraphic.getDojoShape().moveToBack();

                            dragGraphic.getDojoShape().moveToFront();

                        }

                    }

                })));

                //触发"mouse-drag-end,通知拖拽结束

                this._mapEvents.push(this.defaults.map.on("mouse-drag-end", lang.hitch(this, function (evt) {

                    if (this.dragGraphic && this.dragGraphic.isMouseDown) {

                        this.emit("drag-end", {circle: this.circle});

                        this.dragGraphic.isMouseDown = false;

                        this.defaults.map.enableMapNavigation();

                        this.defaults.map.setMapCursor("default");

                    }

                })));

            },

            //取消上一次注册的map鼠标事件

            _unregistMapEvents: function () {

                for (var i = 0; i < this._mapEvents; i++) {

                    if (this._mapEvents[i]) {

                        this._mapEvents[i].remove();

                    }

                }

                this._mapEvents=[];

            },

            startDrawCircle: function (centerPoint) {

                this._unregistMapEvents();

                this.centerPoint = centerPoint;

                this.circle = this._createCircle(centerPoint, 500);

                var dragPoint = this._createDragBtnPoint(this.circle, centerPoint);

                this.circleGraphic = new Graphic(this.circle, this.defaults.fillSymbol);

                this.labelGraphic = new Graphic(dragPoint, this._createDistanceSymbol(500));

                var dragGraphic = new Graphic(dragPoint, this.defaults.dragButtonSymbol);

                this._measureLayer.add(this.circleGraphic);

                this._measureLayer.add(dragGraphic);

                this._measureLayer.add(this.labelGraphic);

                this._initialMapEvents();

            },

            removeCircle: function () {

                this.centerPoint = null;

                this.circleGraphic = null;

                this.labelGraphic = null;

                this._measureLayer.clear();

            },

            _createCircle: function (point, distance) {

                return new Circle(point, {

                    "radius": distance

                });

            },

            _createDragBtnPoint: function (geometry, center) {

                var extent = geometry.getExtent();

                var xmax = extent.xmax;

                return new Point([xmax, center.y], center.spatialReference)

            },

            _createDistanceSymbol: function (distance) {

                distance = distance.toFixed(0) + "m";

                var fontColor = new Color("#696969");

                var holoColor = new Color("#fff");

                var font = new Font("10pt", Font.STYLE_ITALIC, Font.VARIANT_NORMAL, Font.WEIGHT_BOLD, "Courier");

                var textSymbol = new TextSymbol(distance, font, fontColor);

                textSymbol.setOffset(10, 20).setHaloColor(holoColor).setHaloSize(2);

                textSymbol.setAlign(TextSymbol.ALIGN_MIDDLE);

                return textSymbol;

            },

            _calDistance: function (point1, point2) {

                var line = new Polyline(this.defaults.map.spatialReference);

                line.addPath([point1, point2]);

                return geometryEngine.distance(point1, point2, "meters");

            },

        });

    })
3.小结
本次功能最重要的地方就是实现graphic的拖拽。在拖拽graphic的时候,一定要关闭地图的导航,把graphic的geomtry设置成当前鼠标的位置。最后,如有不对的地方还请大家批评指正,欢迎转载!http://www.cnblogs.com/deliciousExtra/p/5503929.html
预告:下一期山寨百度的BubblePopup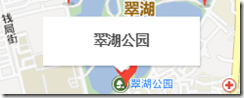
ArcGIS JS 学习笔记2 实现仿百度的拖拽画圆的更多相关文章
- ArcGIS JS 学习笔记1 用ArcGIS JS 实现仿百度地图的距离量测和面积量测
一.开篇 在博客注册了三年,今天才决定写第一篇博客,警告自己不要懒!!! 二.关于ArcGIS JS 版本选择 在写这篇博客时ArcGIS JS 4.0正式版已经发布.它和3.x版本的不同是,Map不 ...
- ArcGIS JS 学习笔记3 实现百度风格的BubblePopup
1. 开篇 模仿是最好的学习,这次我们继续山寨百度,通过自定义Infowindow来实现百度风格的BubblePopup 2.准备 2.1 Copy模板 先打开百度地图,按下f12吧BubblePop ...
- ArcGIS JS 学习笔记4 实现地图联动
1.开篇 守望屁股实在太好玩了,所以最近有点懒,这次就先写个简单的来凑一下数.这次我的模仿目标是天地图的地图联动. 天地的地图联动不仅地图有联动,而且鼠标也有联动,我就照着这个目标进行山寨. 2.准备 ...
- QML学习笔记(七)— 实现可拖拽、编辑、选中的ListView
鼠标单击可选中当前项,头部呈绿色显示:按压当前项可进行拖拽更换列表项位置:点击数据可以进行编辑: GitHub:八至 作者:狐狸家的鱼 这里是自己定义的model,有些字体和颜色都是使用的全局属性, ...
- Chrome扩展,应用开发学习笔记之2---恶搞百度一下
Chrome扩展,应用开发学习笔记之2 恶搞百度一下 前面我们介绍了一个最简单的chrome扩展时钟,如今我来介绍一下一个恶搞百度一下的chrome扩展程序. 前面说过,manifest.json文件 ...
- WebGL three.js学习笔记 加载外部模型以及Tween.js动画
WebGL three.js学习笔记 加载外部模型以及Tween.js动画 本文的程序实现了加载外部stl格式的模型,以及学习了如何把加载的模型变为一个粒子系统,并使用Tween.js对该粒子系统进行 ...
- Java web与web gis学习笔记(二)——百度地图API调用
系列链接: Java web与web gis学习笔记(一)--Tomcat环境搭建 Java web与web gis学习笔记(二)--百度地图API调用 JavaWeb和WebGIS学习笔记(三)-- ...
- js学习笔记:webpack基础入门(一)
之前听说过webpack,今天想正式的接触一下,先跟着webpack的官方用户指南走: 在这里有: 如何安装webpack 如何使用webpack 如何使用loader 如何使用webpack的开发者 ...
- Vue.js学习笔记(2)vue-router
vue中vue-router的使用:
随机推荐
- 新版本来袭:Apache Spark 1.5新特性介绍
年9月9日发布了1.5版本,该版本由230+开发人员和80+机构参与,修复了1400多个补丁,该版本可以通过 http://spark.apache.org/downloads.html进行下载.Sp ...
- 使用Html5+C#+微信 开发移动端游戏详细教程: (四)游戏中层的概念与设计
众所周知,网站的前端页面结构一般是由div组成,父div包涵子div,子div包涵各种标签和项, 同理,游戏中我们也将若干游戏模块拆分成层,在后续的代码维护和游戏程序逻辑中将更加清晰和便于控制. We ...
- Tools - Git与GitHub
Git Wiki - Git 开源的分布式版本控制系统,用于敏捷高效地管理项目版本. Git - HomePage Git - CHEAT SHEET git_cheat_sheet.pdf GitH ...
- 35款加速网站开发的 CSS 开发工具
网络有很很多的 CSS 工具和教程可用,它可以帮助设计人员和开发人员轻松.快速地学习 CSS 技术.这些工具中在高效开发 Web 应用程序中发挥重要作用. 在这篇文章中,我们收集了35个最好的 CSS ...
- Azure上七层负载均衡APP Gateway
Azure的SLB和ILB是最常用的4层负载均衡工具.但有些场景是7层的负载均衡,SLB和ILB就无能为力了. Azure上已经推出了APP Gateway的服务,就是7层负载均衡的负载均衡器. 如上 ...
- 谷歌插件Image downloader开发之popup
Image downloader的交互逻辑是这样的:用户点击Image downloader的图标,会向页面(content script,见上一篇文章:谷歌插件Image downloader开发之 ...
- Laravel4中的Validator
不管写接口还是写web页面,实质都是传入参数,然后进行业务逻辑,然后再输出具体内容.所以,对参数的验证是不可避免的一个环节,比如传过来的email是不是为空,是不是合法的email格式?laravel ...
- 基于HTML5树组件延迟加载技术实现
HT for Web的HTML5树组件有延迟加载的功能,这个功能对于那些需要从服务器读取具有层级依赖关系数据时非常有用,需要获取数据的时候再向服务器发起请求,这样可减轻服务器压力,同时也减少了浏览器的 ...
- 关于Entity Framework中的Attached报错的完美解决方案
我们在使用Entity Framework进行CRUD时,为了提升查询效率,一般均会启动NoTracking,即不追踪变化,设置代码如下: //这是DB First模式下设置方法: aTestEnti ...
- C++二维码相关库编译
一.瞎想 坐在地铁上闲来无聊,突然想到了二维码,顺手就百度了下相关的资料,目前C++二维码相关的库不多,也就zbar(开源中国上下了半天也没下载下来).zxing,不过这两个库据说都是解析二维码的,不 ...