
Collectd+InfluxDB+Grafana监控系统搭建
环境配置
| 节点 | 配置 | 类型 | 操作系统 |
|---|---|---|---|
| Sched | 2G 2CPU 50GB ens3=>192.168.200.11 | KVM虚拟机 | CentOS 7 |
| Nova | 4G 2CPU 50GB ens3=>192.168.2000.12 | KVM虚拟机 | CentOS 7 |
Nova节点配置
安装Collectd
# yum install epel-release

# yum makecache

# yum install collectd -y

# systemctl start collectd

# systemctl enable collectd
配置Collectd
# vim /etc/collectd.conf

LoadPlugin network

<Plugin network>

        <Server "192.168.200.11" "25826">

        </Server>

</Plugin>

# systemctl restart collectd

# scp /usr/share/collectd/types.db root@192.168.200.11:~/
Sched节点配置
配置软件源
# cat <<EOF | sudo tee /etc/yum.repos.d/influxdb.repo

[influxdb]

name = InfluxDB Repository - RHEL \$releasever

baseurl = https://repos.influxdata.com/rhel/\$releasever/\$basearch/stable

enabled = 1

gpgcheck = 1

gpgkey = https://repos.influxdata.com/influxdb.key

EOF

# yum makecache
安装InfluxDB
# yum install influxdb -y

### 设置开机启动

# systemctl start influxdb

# systemctl enable influxdb

### 查询InfluxDB默认配置

# influxd config

### 如果不是使用标准的默认目录,需要手动修改目录权限

# chown -R influxdb:influxdb /mnt/influx

# chown -R influxdb:influxdb /mnt/db
配置InfluxDB
# mkdir -p /usr/share/collectd/

# mv types.db /usr/share/collectd/

# vim /etc/influxdb/influxdb.conf

[[collectd]]

  enabled = true

  bind-address = "0.0.0.0:25826"

### 查询配置是否生效

# influxd config

# systemctl restart influxdb

# systemctl stop firewalld

# systemctl disable firewalld

### 查询数据插入是否正常

> SHOW DATABASES

name: databases

name

----

_internal

collectd

> use collectd

Using database collectd

>
安装Grafana
# yum install https://s3-us-west-2.amazonaws.com/grafana-releases/release/grafana-4.2.0-1.x86_64.rpm

### 设置开机启动

# systemctl daemon-reload

# systemctl start grafana-server

# systemctl status grafana-server

# systemctl enable grafana-server

### 访问http://192.168.200.11:3000/login,默认用户名密码admin:admin,默认配置信息可查询/etc/grafana/grafana.ini文件
配置Grafana
### 数据库默认用户名密码root:root
配置数据源
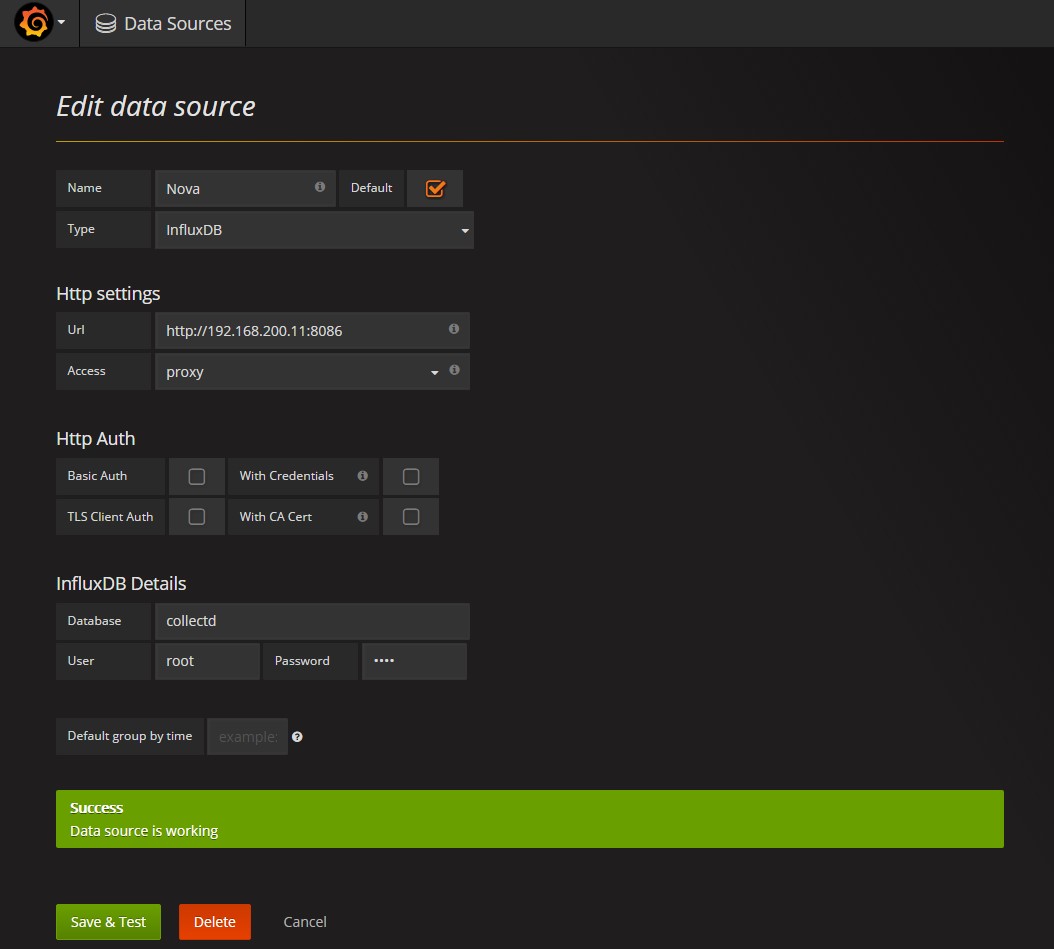
配置控制面板

添加表格到控制面板
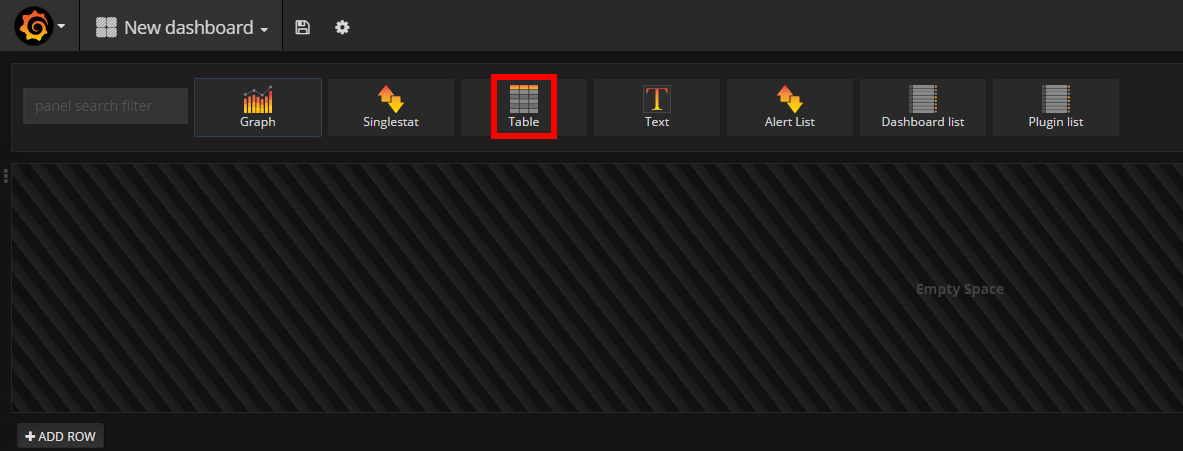
配置表格显示规则
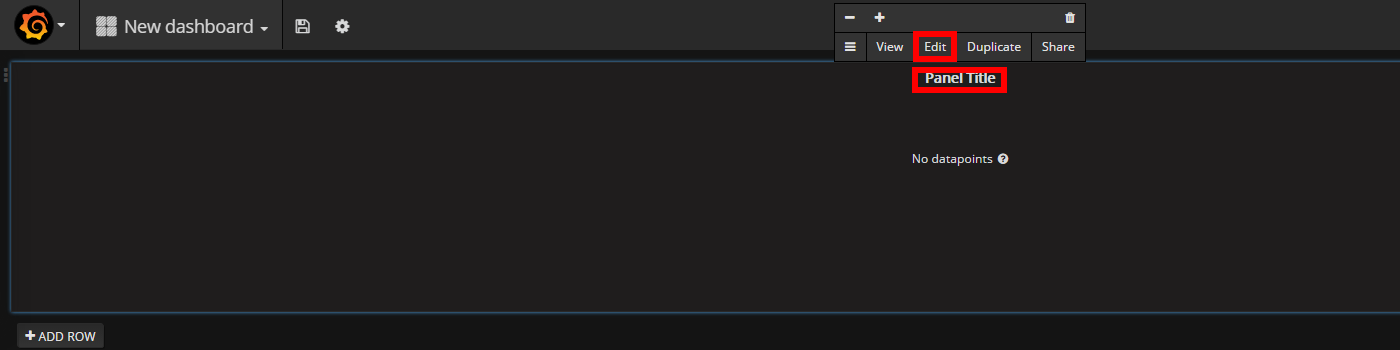
设置查询规则
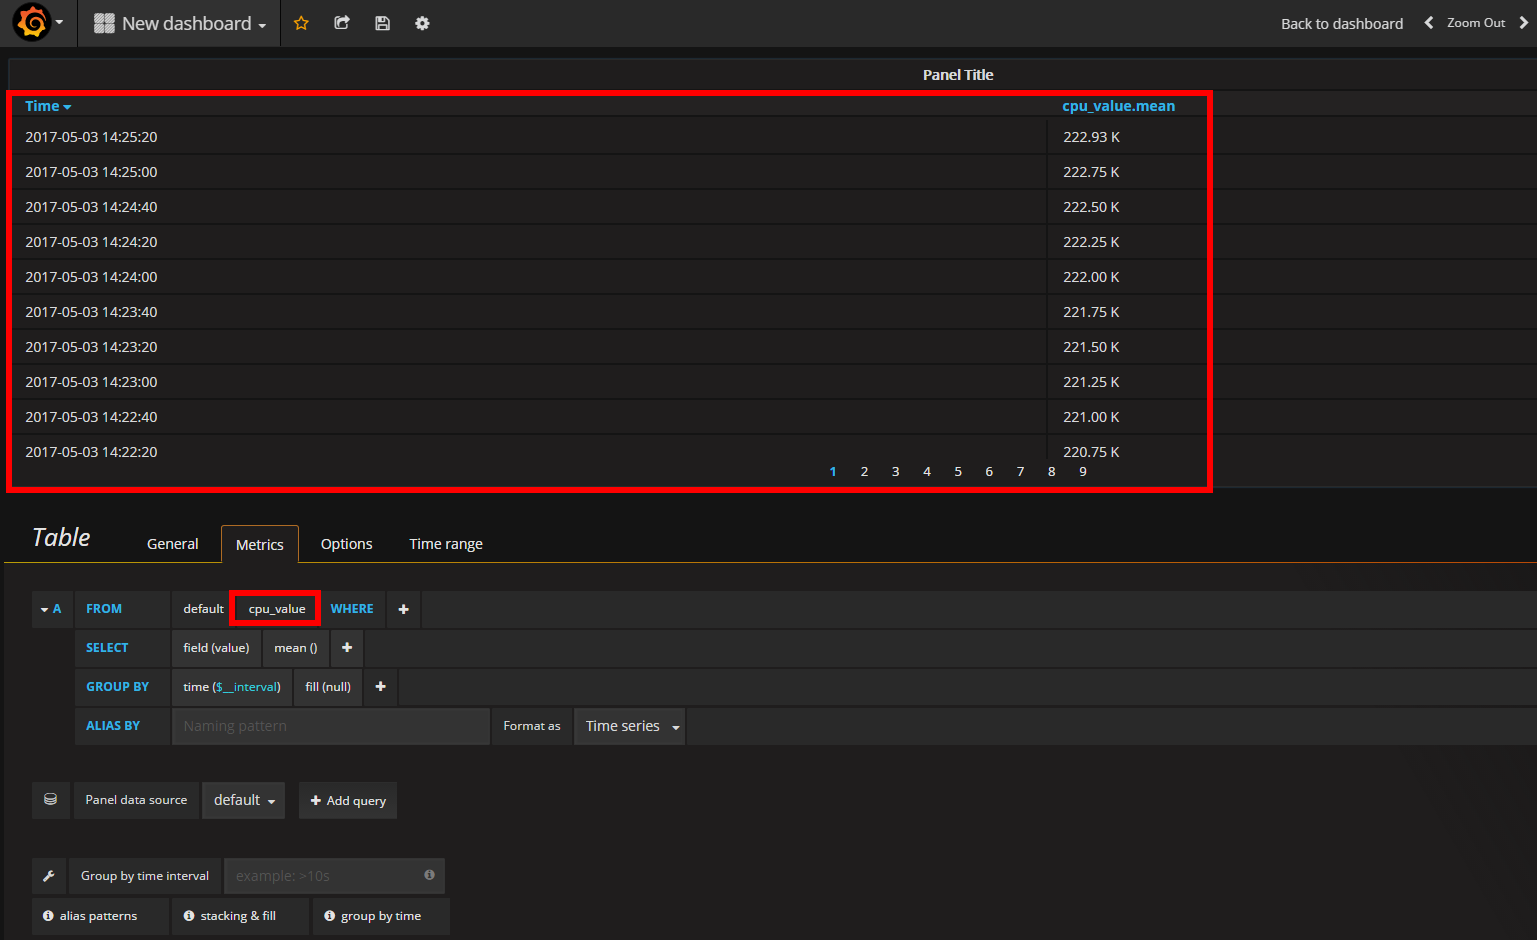
保存控制面板

参考文档
Collectd+InfluxDB+Grafana监控系统搭建的更多相关文章
- 使用cAdvisor+Influxdb+Grafana监控系统
今天准备开始研究研究当前非常流行的Grafana+Influxdb监控系统,两者都是非常轻量级的应用但是功能却异常强大,可以说Grafana在作图显示方面真的毫不逊色与Cacti. 组件介绍 cA ...
- 初试 Prometheus + Grafana 监控系统搭建并监控 Mysql
转载自:https://cloud.tencent.com/developer/article/1433280 文章目录1.Prometheus & Grafana 介绍1.1.Prometh ...
- collectd+influxDB+Grafana搭建性能监控平台
网上查看了很多关于环境搭建的文章,都比较久远了很多安装包源都不可用了,今天收集了很多资料组合尝试使用新版本来搭建,故在此记录. 采集数据(collectd)-> 存储数据(influxdb) - ...
- 使用Telegraf + Influxdb + Grafana 监控SQLserver服务器的运行状况
使用Telegraf + Influxdb + Grafana 监控SQLserver服务器的运行状况 前言 本文在Debian9下采用Docker的方式安装Telegraf + Influxdb + ...
- Windows下本机简易监控系统搭建(Telegraf+Influxdb+Grafana)
一.文件准备 1.1 文件名称 telegraf-1.2.1_windows_amd64.zip influxdb-1.2.2_windows_amd64.zip grafana-4.2.0.wind ...
- Windows下本机简易监控系统搭建(Telegraf+Influxdb+Grafana)--转
原文地址:http://www.cnblogs.com/liugh/p/6683488.html 一.文件准备 1.1 文件名称 telegraf-1.2.1_windows_amd64.zip in ...
- WIndows下使用Grafana+InfluxDB打造监控系统
前言 对于一个运维DBA来说,了解数据库的TPS.QPS很有必要(QPS:每秒查询数,即对数据库每秒的DML的操作数:TPS:每秒事物处理,即对数据库每秒DDL操作数),通过了解他们,可以掌握一个实 ...
- Docker搭建zabbix+grafana监控系统
一.准备工作 1.mysql数据库:192.168.1.5 2.nginx服务:192.168.1.10 3.docker服务器:192.168.1.20 4.zabbix客户端若干 二.docker ...
- docker-compose 搭建 Prometheus+Grafana监控系统
有关监控选型之前有写过一篇文章: 监控系统选型,一文轻松搞定! 监控对象 Linux服务器 Docker Redis MySQL 数据采集 1).prometheus: 采集数据 2).node-ex ...
随机推荐
- Android GreenDao 中文表名,中文字段DAO生成乱码的问题
在gradle.properties 文件中加入编码类型 # Project-wide Gradle settings. # IDE (e.g. Android Studio) users: # Gr ...
- Cannot find class [org.apache.commons.dbcp.BasicDataSource] for bean with name 'dataSource' defined in class path resource [applicationContext.xml]
Cannot find class [org.apache.commons.dbcp.BasicDataSource] for bean with name 'dataSource' defined ...
- 分享知识-快乐自己:mybatis 主键回调
以下两种方式实现 主键回掉方式. <!--添加用户信息:主键回调--> <insert id="insertUser" useGeneratedKeys=&quo ...
- 1.start
1. react-native init Helloworld // 创建 helloworld 工程 2. 进入 helloworld ->android, 运行 react-navite ...
- Vue从接口请求数据
<!doctype html> <html> <head> <meta charset="UTF-8"> <title> ...
- 串行总线 —— I2C、UART、SPI
I2C,也叫 IIC,是一种常见的串行总线,它只需要两根线即可在连接于总线上的器件之间传送信息. 0. 电气知识 开漏输出:Open drain output,不输出电压,低电平时接地,高电平时不接地 ...
- H264视频编码成MP4文件
firehood的专栏 Wince嵌入式开发 目录视图 摘要视图 订阅 赠书 | AI专栏(AI圣经!<深度学习>中文版) 每周荐书:Kotlin.分布式.Keras ...
- ACM学习历程—HDU1695 GCD(容斥原理 || 莫比乌斯)
Description Given 5 integers: a, b, c, d, k, you're to find x in a...b, y in c...d that GCD(x, y) = ...
- ACM学习历程—HDU5490 Simple Matrix (数学 && 逆元 && 快速幂) (2015合肥网赛07)
Problem Description As we know, sequence in the form of an=a1+(n−1)d is called arithmetic progressio ...
- 【ML】关于神经网络优化问题的随笔记
1. 为什么不去试着最大化正确分类的图像数量而使用二次代价函数? 在神经网络中,被正确分类的图像数量所关于权重和偏置的函数并不是一个平滑的函数.大多数情况下,对权重和偏执做出的微小变动完全不会影响被正 ...