
Springboot+actuator+prometheus+Grafana集成
本次示例以Windows示例
推荐到官网去下载:Windows版的应用程序
下载最新版 prometheus-2.37.8.windows-amd64 压缩包:解压就行

下载最新版 grafana-9.5.2 压缩包:解压就行

准备一个Springboot的项目:
导入相关的监控依赖
        <!--监控站点开启-->

        <dependency>

            <groupId>org.springframework.boot</groupId>

            <artifactId>spring-boot-starter-actuator</artifactId>

        </dependency>

        <!-- prometheus -->

        <dependency>

            <groupId>io.micrometer</groupId>

            <artifactId>micrometer-registry-prometheus</artifactId>

            <version>1.10.5</version>

        </dependency>

        <!--SpringSecurity 安全访问-->

        <dependency>

            <groupId>org.springframework.boot</groupId>

            <artifactId>spring-boot-starter-security</artifactId>

        </dependency>
springSecurity的配置
#springSecurity 配置

spring.security.user.name=root

spring.security.user.password=root

spring.security.user.roles=ADMIN
spring-actuator配置
#增加开启springboot actuator监控的配置

management:

  endpoint:

    shutdown:

      enabled: true # 开启端点

    health:

      show-details: always # 是否展示健康检查详情

  endpoints:

    web:

      exposure:

        include:

          - prometheus

          - health

  metrics:

    tags:

      application: ${spring.application.name}
springSecurity的白名单接口配置-SecurityConfig
package com.gton.config;

import org.springframework.context.annotation.Configuration;

import org.springframework.security.config.annotation.web.builders.HttpSecurity;

import org.springframework.security.config.annotation.web.builders.WebSecurity;

import org.springframework.security.config.annotation.web.configuration.WebSecurityConfigurerAdapter;

/**

 * @description:

 * @author: GuoTong

 * @createTime: 2023-06-01 21:44:49

 * @since JDK 1.8 OR 11

 **/

@Configuration

public class SecurityConfig extends WebSecurityConfigurerAdapter {

    @Override

    protected void configure(HttpSecurity http) throws Exception {

        http.formLogin().and().authorizeRequests()

                .antMatchers("/actuator/**", "/favicon.ico", "/doc.html").permitAll()

                .antMatchers("/static/**").permitAll()

                .antMatchers("/favicon.ico").permitAll()

                // swagger

                .antMatchers("/swagger**/**").permitAll()

                .antMatchers("/webjars/**").permitAll()

                .antMatchers("/v2/**").permitAll()

                .anyRequest().authenticated().and().csrf().disable();    //关闭csrf保护

    }

    /**

     * Description: 忽略一些借口

     *

     * @author: GuoTong

     * @date: 2023-06-01 21:44:49

     * @return:

     */

    @Override

    public void configure(WebSecurity web) throws Exception {

        web.ignoring()

                .antMatchers(

                        "/doc.html",

                        "/swagger-resources/configuration/ui",

                        "/swagger*",

                        "/swagger**/**",

                        "/webjars/**",

                        "/favicon.ico",

                        "/**/*.css",

                        "/**/*.js",

                        "/**/*.png",

                        "/**/*.gif",

                        "/v2/**",

                        "/**/*.ttf",

                        "/actuator/**"

                );

    }

}
springboot的相关的配置
    @Value("${auth.global.enable:false}")

    private boolean enableGlobalAuth;

    @Bean

    @LoadBalanced

    public RestTemplate restTemplate() {

        return new RestTemplate();

    }

    /**

     * Description:  添加全局跨域CORS处理

     */

    @Override

    public void addCorsMappings(CorsRegistry registry) {

        // 设置允许跨域的路径

        registry.addMapping("/**")

                //设置允许跨域请求的域名

                .allowedOrigins("http://127.0.0.1:8787")

                // 是否允许证书

                .allowCredentials(true)

                // 设置允许的方法

                .allowedMethods("GET", "POST", "DELETE", "PUT")

                // 设置允许的header属性

                .allowedHeaders("*")

                // 跨域允许时间

                .maxAge(3600);

    }

    /**

     * Description: 静态资源过滤

     */

    @Override

    public void addResourceHandlers(ResourceHandlerRegistry registry) {

        //ClassPath:/Static/** 静态资源释放

        registry.addResourceHandler("/**").addResourceLocations("classpath:/static/");

        //释放swagger

        registry.addResourceHandler("doc.html").addResourceLocations("classpath:/META-INF/resources/");

        //释放webjars

        registry.addResourceHandler("/webjars/**").addResourceLocations("classpath:/META-INF/resources/webjars/");

    }

    /**

     * 解决springboot升到2.6.x之后,knife4j报错

     *

     * @param webEndpointsSupplier        the web endpoints supplier

     * @param servletEndpointsSupplier    the servlet endpoints supplier

     * @param controllerEndpointsSupplier the controller endpoints supplier

     * @param endpointMediaTypes          the endpoint media types

     * @param corsEndpointProperties      the cors properties

     * @param webEndpointProperties       the web endpoints properties

     * @param environment                 the environment

     * @return the web mvc endpoint handler mapping

     */

    @Bean

    public WebMvcEndpointHandlerMapping webMvcEndpointHandlerMapping(WebEndpointsSupplier webEndpointsSupplier, ServletEndpointsSupplier servletEndpointsSupplier,

                                                                     ControllerEndpointsSupplier controllerEndpointsSupplier, EndpointMediaTypes endpointMediaTypes, CorsEndpointProperties corsEndpointProperties, WebEndpointProperties webEndpointProperties,

                                                                     Environment environment) {

        List<ExposableEndpoint<?>> allEndpoints = new ArrayList<>();

        Collection<ExposableWebEndpoint> webEndpoints = webEndpointsSupplier.getEndpoints();

        allEndpoints.addAll(webEndpoints);

        allEndpoints.addAll(servletEndpointsSupplier.getEndpoints());

        allEndpoints.addAll(controllerEndpointsSupplier.getEndpoints());

        String basePath = webEndpointProperties.getBasePath();

        EndpointMapping endpointMapping = new EndpointMapping(basePath);

        boolean shouldRegisterLinksMapping = shouldRegisterLinksMapping(webEndpointProperties, environment, basePath);

        return new WebMvcEndpointHandlerMapping(endpointMapping, webEndpoints, endpointMediaTypes, corsEndpointProperties.toCorsConfiguration(), new EndpointLinksResolver(

                allEndpoints, basePath), shouldRegisterLinksMapping, null);

    }

    /**

     * shouldRegisterLinksMapping

     *

     * @param webEndpointProperties

     * @param environment

     * @param basePath

     * @return

     */

    private boolean shouldRegisterLinksMapping(WebEndpointProperties webEndpointProperties, Environment environment, String basePath) {

        return webEndpointProperties.getDiscovery().isEnabled() && (StringUtils.hasText(basePath) || ManagementPortType.get(environment).equals(ManagementPortType.DIFFERENT));

    }

    /**

     * Description:  过滤器

     *

     * @param registry

     * @author: GuoTong

     * @date: 2023-06-03 12:32:39

     * @return:void

     */

    @Override

    public void addInterceptors(InterceptorRegistry registry) {

        registry.addInterceptor(new MicrometerTPSInterceptor()).addPathPatterns("/**")

                .excludePathPatterns("/doc.html")

                .excludePathPatterns("/swagger-resources/**")

                .excludePathPatterns("/webjars/**")

                .excludePathPatterns("/v2/**")

                .excludePathPatterns("/favicon.ico")

                .excludePathPatterns("/sso/**")

                .excludePathPatterns("/swagger-ui.html/**");

    }

    /**

     * Description:  Bean 如下来监控 JVM 性能指标信息:

     * http://localhost:8889/actuator/prometheus 指标地址

     *

     * @param applicationName

     * @author: GuoTong

     * @date: 2023-06-03 12:34:36

     * @return:org.springframework.boot.actuate.autoconfigure.metrics.MeterRegistryCustomizer<io.micrometer.core.instrument.MeterRegistry>

     */

    @Bean

    MeterRegistryCustomizer<MeterRegistry> configurer(@Value("${spring.application.name}") String applicationName) {

        return registry -> registry.config().commonTags("application", applicationName);

    }
启动访问监控
-actuator的看板:http://localhost:port/actuator

-prometheus的看板:http://localhost:port/actuator/prometheus
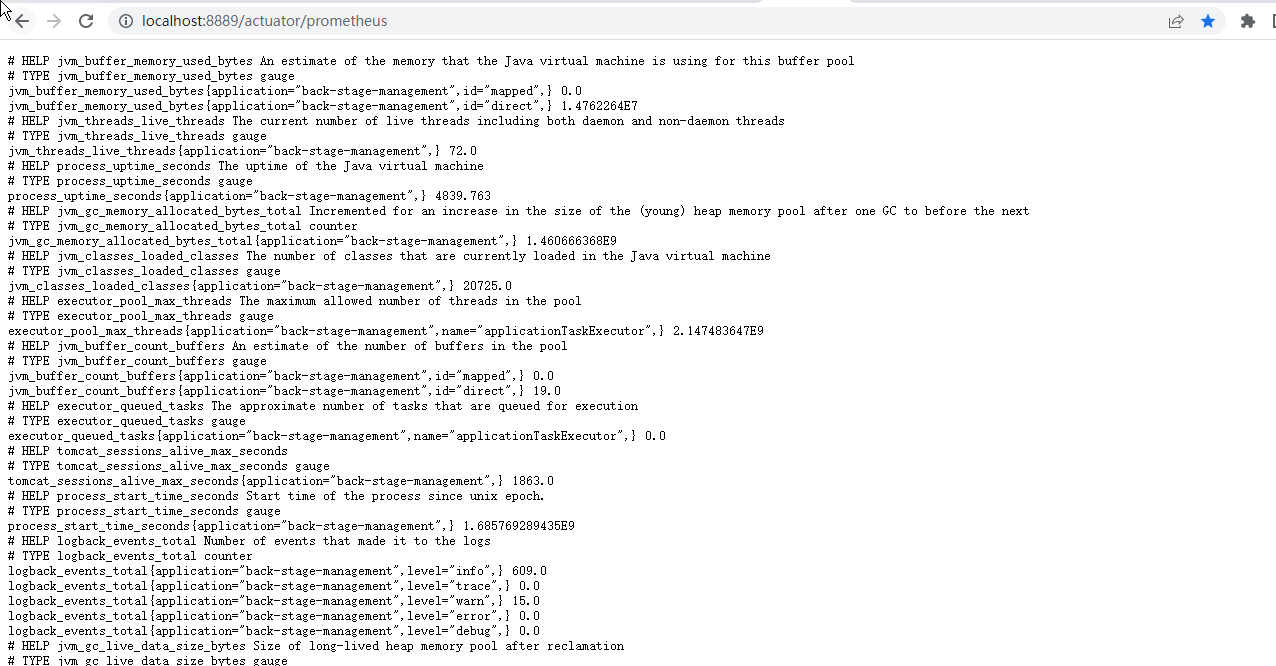
配置Prometheus的对于本Springboot微服务站点的监控

添加配置 以下内容为SpringBoot应用配置
# Prometheus  启动完成之后 http://localhost:9090/targets

# my global config

global:

  scrape_interval:     15s # Set the scrape interval to every 15 seconds. Default is every 1 minute.

  evaluation_interval: 15s # Evaluate rules every 15 seconds. The default is every 1 minute.

  # scrape_timeout is set to the global default (10s).

# Alertmanager configuration

alerting:

  alertmanagers:

    - static_configs:

        - targets:

          # - alertmanager:9093

# Load rules once and periodically evaluate them according to the global 'evaluation_interval'.

rule_files:

# - "first_rules.yml"

# - "second_rules.yml"

# A scrape configuration containing exactly one endpoint to scrape:

# Here it's Prometheus itself.

scrape_configs:

  - job_name: 'prometheus'

    static_configs:

      - targets: ['127.0.0.1:9090']

  ###以下内容为SpringBoot应用配置

  - job_name: 'BackStageApp'

    scrape_interval: 5s

    metrics_path: '/actuator/prometheus'

    static_configs:

      - targets: ['127.0.0.1:8889']

        labels:

          instance: "BackStageApp-prometheus"

          service: "BackStageApp-8889-prometheus"
点击这个执行:prometheus的应用

启动成功如下
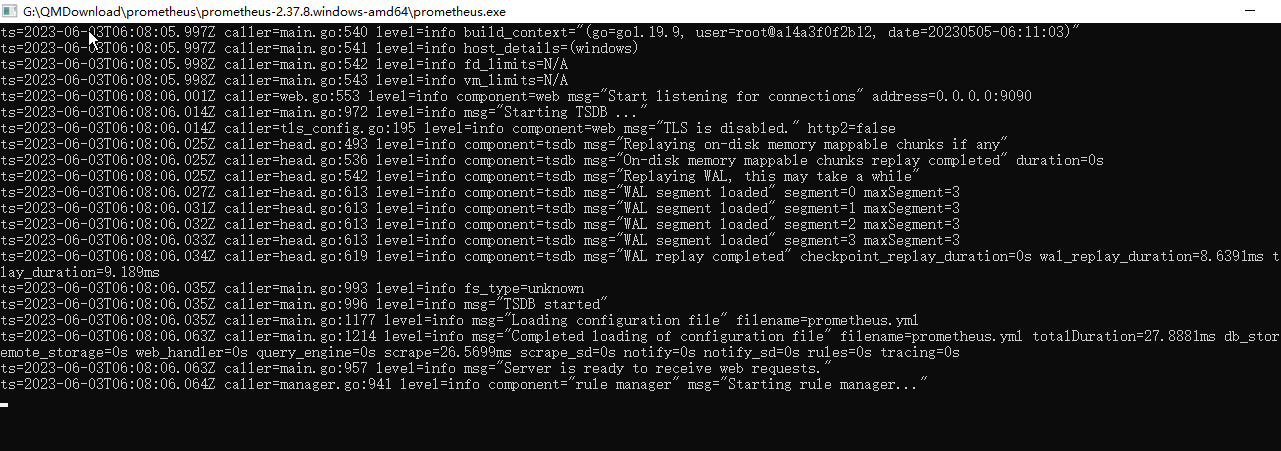
访问prometheus的应用:http://localhost:9090/

可以点击链接跳转

显示的是:http://sky-20200720fyp:8889/actuator/prometheus
说明Prometheus配置完成
然后启动Grafana

启动成功如下:初始化--启动有点久,耐性一点

打开Grafana看板:http://localhost:3000/login
首次登录使用 admin:admin 然后可以设置自己的账号密码,也可以跳过Skip

第一次进入如下

配置Prometheus的数据源
第一步选这个管理配置菜单

第二步选这个Datasorce

第三步选这个添加新的Datasorce

第四步选这个Prometheus数据源

第五步配置Prometheus数据源的地址和名称,然后保存

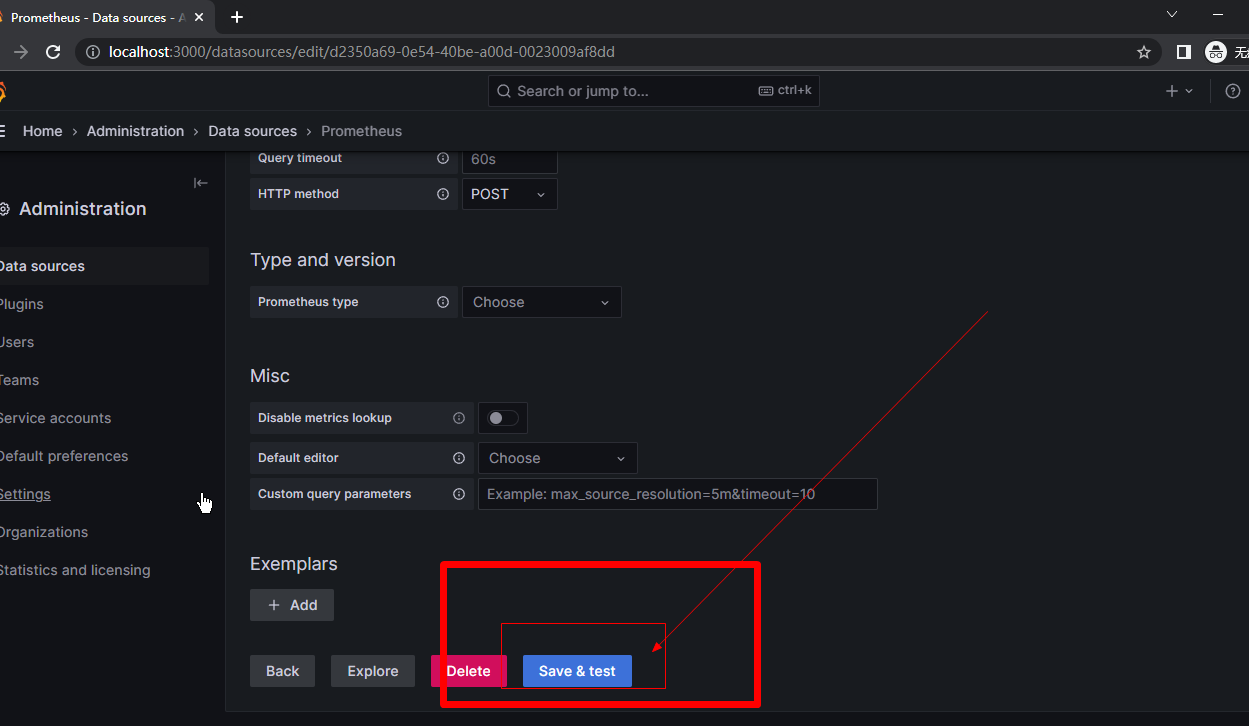
第六步配置Prometheus的看板

导入对应的监控 JVM 的 Dashboard 模板,模板编号为 4701。,点击load


填写这些必填项;导入自动加载后其他可以不用管,必须选择下面的刚刚配置的prometheus数据源,然后选择import

第七步监控JVM
上一步点击然后选择import,会进入这个界面,什么都没有

选择自己项目的站点配置的application和instance就行了,刷新左上角的时间

很多看板自己研究把

创建文件组

可以把监控看板移加入分类分组

Springboot+actuator+prometheus+Grafana集成的更多相关文章
- Spring Boot 2.x监控数据可视化(Actuator + Prometheus + Grafana手把手)
TIPS 本文基于Spring Boot 2.1.4,理论支持Spring Boot 2.x所有版本 众所周知,Spring Boot有个子项目Spring Boot Actuator,它为应用提供了 ...
- 基于Docker+Prometheus+Grafana监控SpringBoot健康信息
在微服务体系当中,监控是必不可少的.当系统环境超过指定的阀值以后,需要提醒指定的运维人员或开发人员进行有效的防范,从而降低系统宕机的风险.在CNCF云计算平台中,Prometheus+Grafana是 ...
- SpringCloud微服务实战——搭建企业级开发框架(四十五):【微服务监控告警实现方式二】使用Actuator(Micrometer)+Prometheus+Grafana实现完整的微服务监控
无论是使用SpringBootAdmin还是使用Prometheus+Grafana都离不开SpringBoot提供的核心组件Actuator.提到Actuator,又不得不提Micrometer ...
- Prometheus + Grafana 监控SpringBoot应用
一.用到的工具 Prometheus Grafana Micrometer Grafana Dashboard (4701) 二.安装和运行Prometheus 官网下载prometheus- ...
- 【Springboot】用Prometheus+Grafana监控Springboot应用
1 简介 项目越做越发觉得,任何一个系统上线,运维监控都太重要了.关于Springboot微服务的监控,之前写过[Springboot]用Springboot Admin监控你的微服务应用,这个方案可 ...
- SpringBoot+Prometheus+Grafana实现应用监控和报警
一.背景 SpringBoot的应用监控方案比较多,SpringBoot+Prometheus+Grafana是目前比较常用的方案之一.它们三者之间的关系大概如下图: 关系图 二.开发SpringBo ...
- Prometheus+Grafana监控SpringBoot
Prometheus+Grafana监控SpringBoot 一.Prometheus监控SpringBoot 1.1 pom.xml添加依赖 1.2 修改application.yml配置文件 1. ...
- Spring Boot 微服务应用集成Prometheus + Grafana 实现监控告警
Spring Boot 微服务应用集成Prometheus + Grafana 实现监控告警 一.添加依赖 1.1 Actuator 的 /prometheus端点 二.Prometheus 配置 部 ...
- SpringBoot进阶教程(七十一)详解Prometheus+Grafana
随着容器技术的迅速发展,Kubernetes已然成为大家追捧的容器集群管理系统.Prometheus作为生态圈Cloud Native Computing Foundation(简称:CNCF)中的重 ...
- Prometheus+Grafana+Alertmanager实现告警推送教程 ----- 图文详解
前言 本文主要介绍的是Prometheus采集数据,通过Grafana加上PromQL语句实现数据可视化以及通过Alertmanage实现告警推送功能.温馨提示,本篇文章特长,2w多的文字加上几十张图 ...
随机推荐
- SpringBoot 整合Quartz 定时任务框架
更多内容,前往 IT-BLOG 一.Scheduled 定时任务 [1]添加 Scheduled相关依赖,它是 Spring自带的一个 jar包因此引入 Spring的依赖: 1 <depend ...
- CSAPP-Attack Lab
目录 Code Injection Attacks Level 1 Level 2 Level_3 Return-Oriented Programming Level_4 Level_5 获取栈顶地址 ...
- [CTF]Caser-Pass-Tool1-C++工具
刷pico遇到一个凯撒密码加密题,顺手写了个解密工具,但是暂时没有解决到边界字母的升降档问题 #include<iostream> using namespace std; int mai ...
- # SpringBoot使用Validation校验参数 ##
SpringBoot使用Validation校验参数 一.简介 参考 (14条消息) 1. 不吹不擂,第一篇就能提升你对Bean Validation数据校验的认知_@decimalmax和@max_ ...
- 实现和CSS一样的easing动画?直接看Mozilla、Chromium源码!
前言 在上一篇丝滑的贝塞尔曲线:从数学原理到应用介绍贝塞尔曲线实现动画时给自己留了一个坑,实现的动画效果和CSS的transition-timing-function: cubic-bezier差别较 ...
- 二进制安装Kubernetes(k8s) v1.21.13 IPv4/IPv6双栈
二进制安装Kubernetes(k8s) v1.21.13 IPv4/IPv6双栈 Kubernetes 开源不易,帮忙点个star,谢谢了 介绍 kubernetes二进制安装 后续尽可能第一时间更 ...
- 二进制安装Kubernetes(k8s) v1.24.0 IPv4/IPv6双栈 (三主俩从)
二进制安装Kubernetes(k8s) v1.24.0 IPv4/IPv6双栈 (三主俩从) Kubernetes 开源不易,帮忙点个star,谢谢了 介绍 kubernetes二进制安装 后续尽可 ...
- Let's Encrypt 泛域名证书申请
泛域名 泛域名证书又名通配符证书是SSL证书中的其中一种形式,一般会以通配符的形式(如:*.domain.com)来指定证书所要保护的域名. OV证书和DV证书都会有通配符的域名形式提供,而EV证书一 ...
- pysimplegui之画布,图形,表格和树结构元素
画布元素 在我看来,tkinter Canvas 小部件是 tkinter 小部件中功能最强大的.虽然我尽我所能将用户与任何与 tkinter 相关的东西完全隔离,但 Canvas 元素是一个例外.它 ...
- sync.Pool:提高Go语言程序性能的关键一步
1. 简介 本文将介绍 Go 语言中的 sync.Pool并发原语,包括sync.Pool的基本使用方法.使用注意事项等的内容.能够更好得使用sync.Pool来减少对象的重复创建,最大限度实现对象的 ...