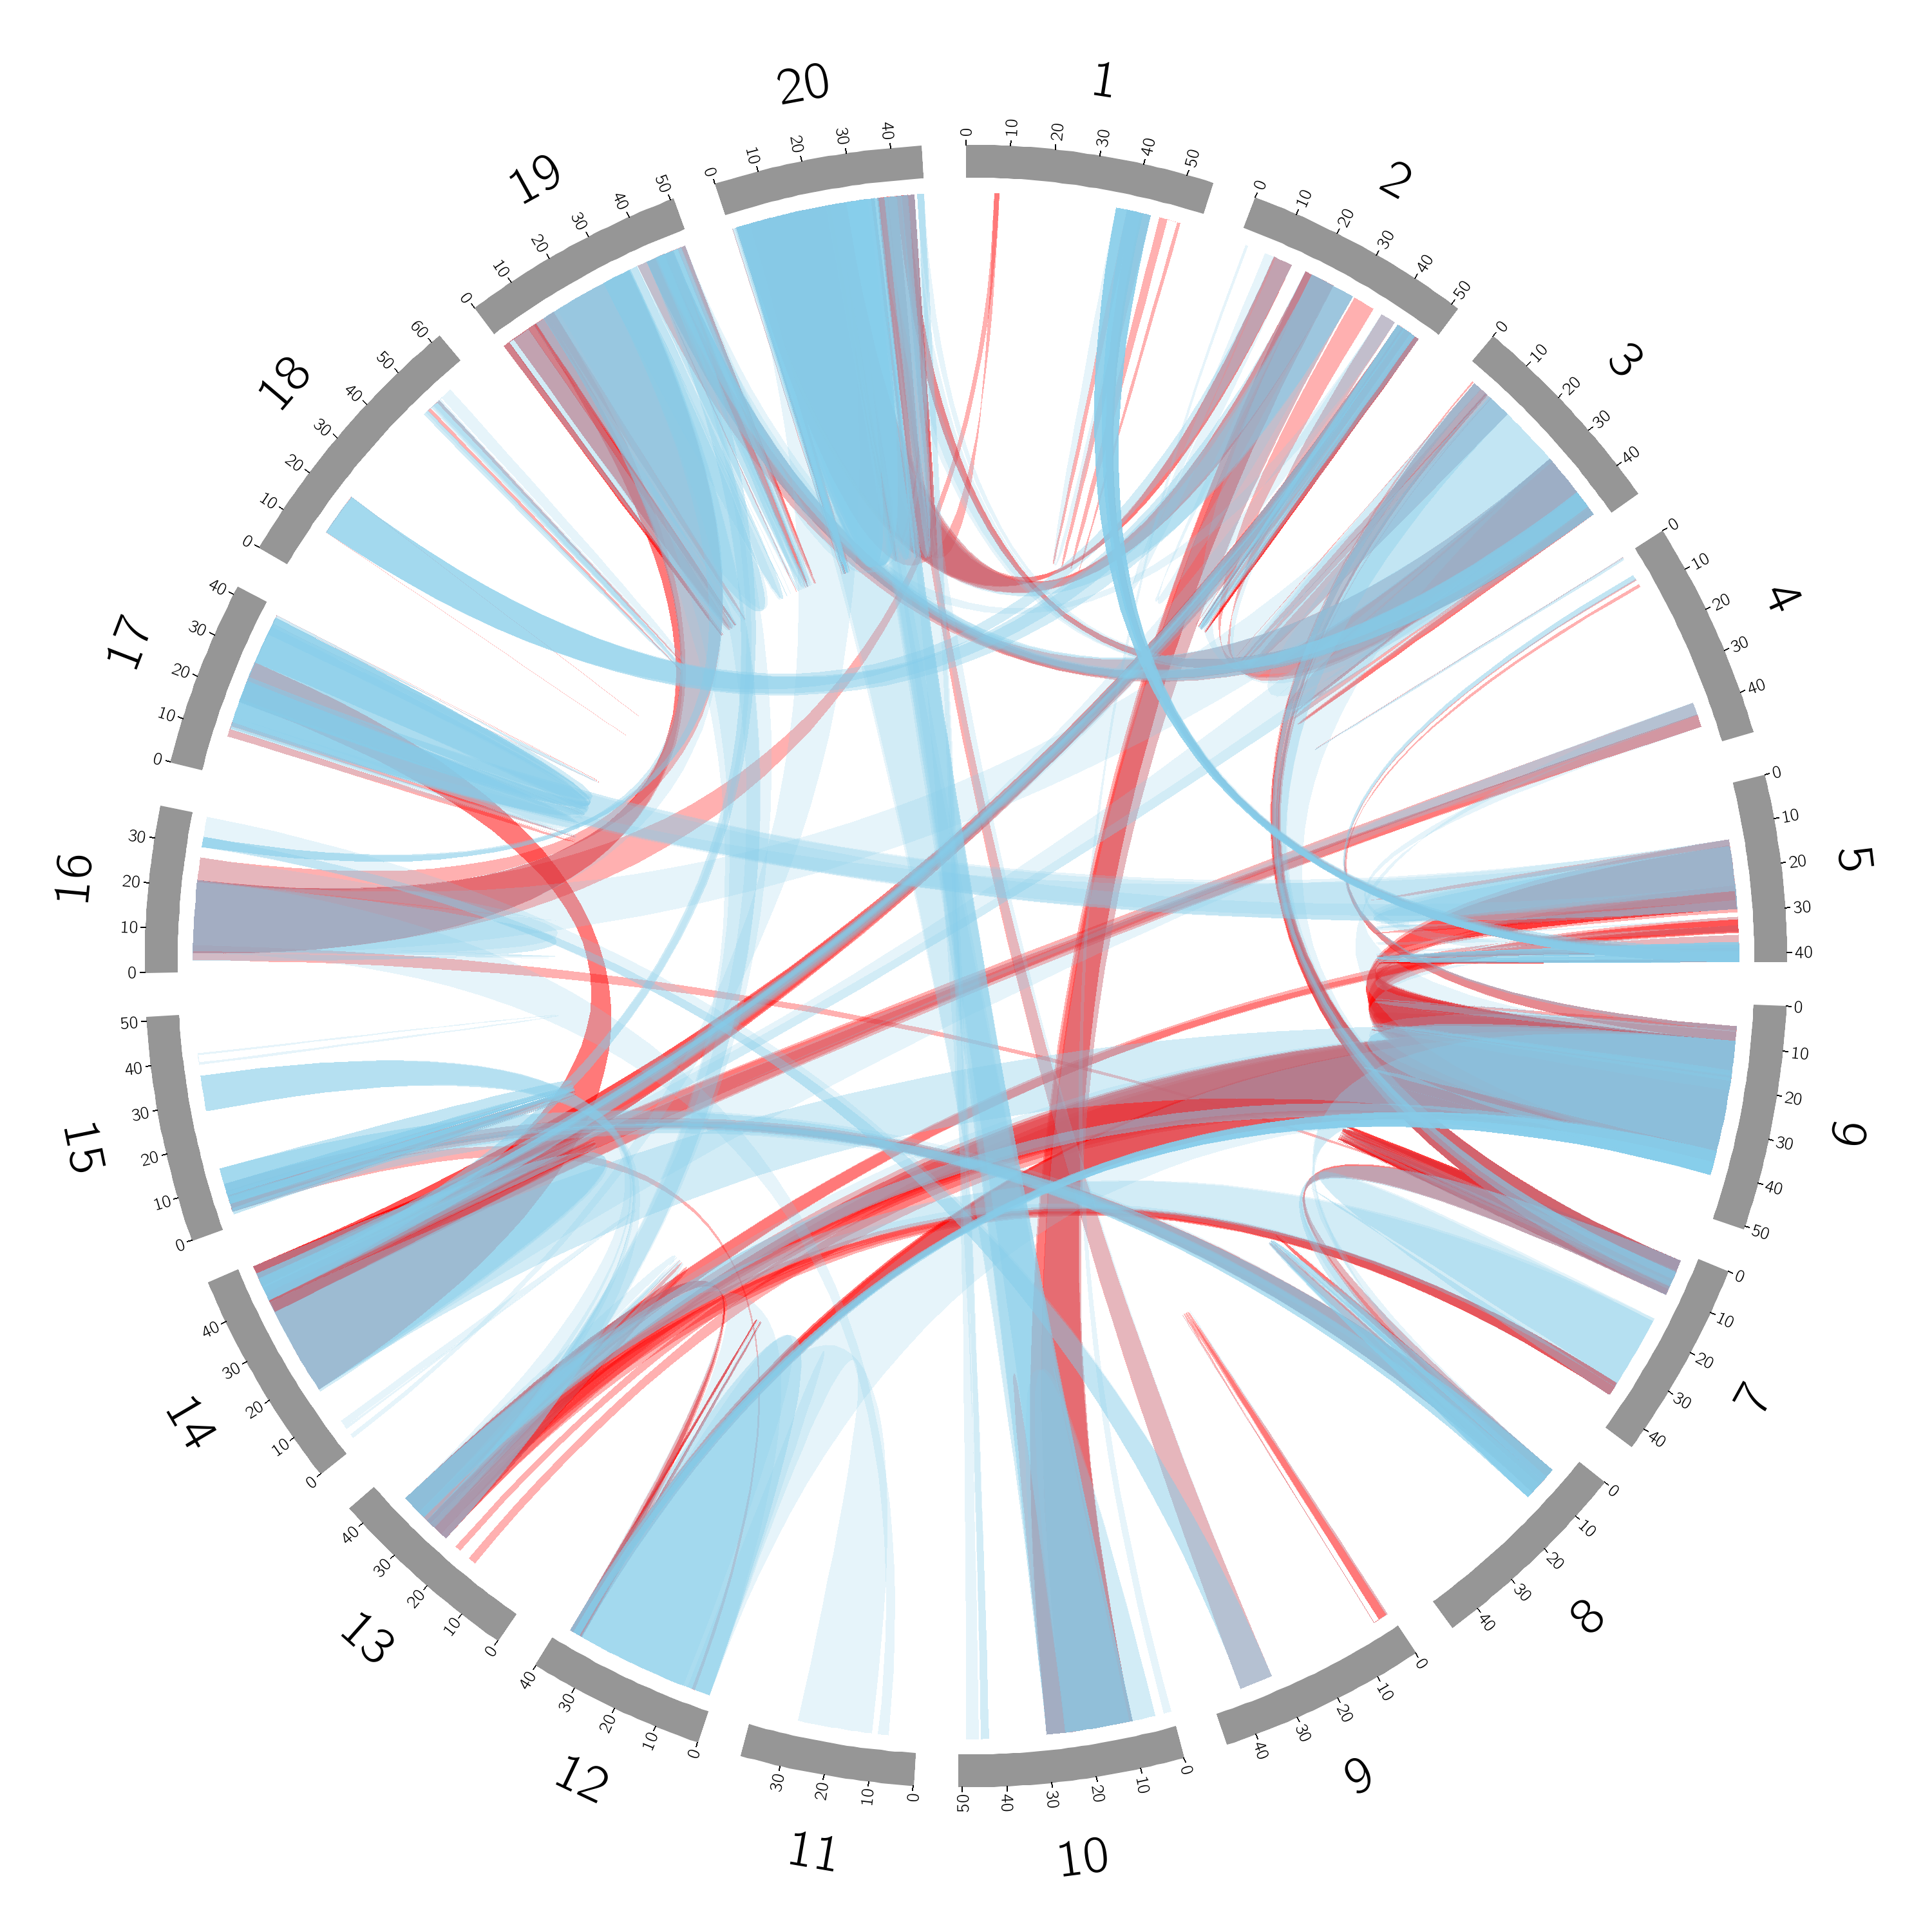
circos 绘制关系型图ribbon,并加入透明度
luminance = lum80
<<include colors_fonts_patterns.conf>>
<colors>
# r,g,b,a color definition
# a = 0 fully opaque
# a = 1 fully transparent
</colors>
<<include ideogram.conf>>
<<include ticks.conf>>
karyotype = karyotype.soybean.txt
<image>
<<include etc/image.conf>>
24bit = yes
</image>
chromosomes_units = 1000000
chromosomes_color = gm01=grey,gm02=grey,gm03=grey,gm04=grey,gm05=grey,gm06=grey,gm07=grey,gm08=grey,gm09=grey,gm10=grey,gm11=grey,gm12=grey,gm13=grey,gm14=grey,gm15=grey,gm16=grey,gm17=grey,gm18=grey,gm19=grey,gm20=grey
<links>
<link>
file = baohan.txt
ribbon = yes
flat = yes # untwist all ribbons
radius = 0.98r
color = 255,0,0,0.3
bezier_radius = 0r
stroke_color = no
stroke_thickness = 2
</link>
<link>
file = xiangjiao.txt
ribbon = yes
flat = yes # untwist all ribbons
radius = 0.98r
color = 135,206,235,0.2 # 透明度设置说明; RGB颜色由三位数三组组成(网页可以查询);0.2是0-1直接的一个数字,越趋于0,透明度越高
bezier_radius = 0r
stroke_color = no
stroke_thickness = 2
<rules>
<rule>
condition = 1
z = eval(average(var(size1),var(size2)))
</rule>
</rules>
</link>
</links>
<<include etc/housekeeping.conf>>
data_out_of_range* = trim
#============================== 图片效果 =================================
circos 绘制关系型图ribbon,并加入透明度的更多相关文章
- R绘图 第六篇:绘制线图(ggplot2)
线图是由折线构成的图形,线图是把散点从左向右用直线连接起来而构成的图形,在以时间序列为x轴的线图中,可以看到数据增长的趋势. geom_line(mapping = NULL, data = NULL ...
- Python游戏引擎开发(七):绘制矢量图
今天来完毕绘制矢量图形. 没有读过前几章的同学,请先阅读前几章: Python游戏引擎开发(一):序 Python游戏引擎开发(二):创建窗体以及重绘界面 Python游戏引擎开发(三):显示图片 P ...
- 用canvas绘制折线图
<!DOCTYPE html> <html lang="en"> <head> <meta charset="UTF-8&quo ...
- php中用GD绘制折线图
php中用GD绘制折线图,代码如下: Class Chart{ private $image; // 定义图像 private $title; // 定义标题 private $ydata; // 定 ...
- 使用Canvas绘制背景图
原文 http://www.imququ.com/post/use-canvas-as-background-image.html 最近iCloud Web的Beta版换了UI,整体风格变得和iOS ...
- Excel应该这么玩——7、我是预言家:绘制趋势图
让我们先看一个场景:你是公司销售部的员工,你手里有公司最近几年的销售额相关的数据,经理希望你预测下个月的销售额.盯着一堆数据,你或许会想到画一张XY坐标图,然后将每个月份的销售额标定为一个坐标.但是下 ...
- 使用Excel 2007绘制甘特图
本文将教大家如何使用Excel 2007制作甘特图.Excel并未提供甘特图类型,但还是可以绘制甘特图的,方法就是通过对堆积条形图类型进行自定义,使之显示任务.任务工期和层次结构. 下面的过程可帮助创 ...
- 【python】pandas & matplotlib 数据处理 绘制曲面图
Python matplotlib模块,是扩展的MATLAB的一个绘图工具库,它可以绘制各种图形 建议安装 Anaconda后使用 ,集成了很多第三库,基本满足大家的需求,下载地址,对应选择pytho ...
- 利用Flex组件birdeye绘制拓扑关系图
birdeye绘制拓扑关系图 1.flex简单介绍 Flex 是一个高效.免费的开源框架,可用于构建具有表现力的 Web应用程序,这些应用程序利用Adobe Flash Player和Adobe AI ...
随机推荐
- zabbix微信报警
[root@LinuxS04 jiaoben]# ./weixin 联系人 baojing baojingok[root@LinuxS04 jiaoben]# pwd/usr/local/zabbix ...
- clip-path的任意元素的碎片拼接动效
看了张大神的这篇文章后自己写的,兼容性不好clip-path要加-webkit- css #test img{position: absolute;} .active .clip{ will-chan ...
- JS转义解码方法
之前只知道可以解决传值乱码问题,今天刚好看到,从新补充下: JavaScript中有三个可以对字符串编码的函数,分别是: 转义方法: escape();//函数可对字符串进行编码 encodeURI( ...
- js 层随着滚动条上下移动
var tips; var theTop = 10; /*这是默认高度,越大越往下*/ var old = theTop; function moveTips() { var tt = 0; if ( ...
- as3的全屏功能的实现主要是舞台stage的displayState属性
StageDisplayState.NORMAL 正常 StageDisplayState.FULL_SCR ...
- dll is in timestamps but is not known in guidmapper… 错误
解决方法是:在Assets下右键,Reimport All
- The 2018 Nobel prizesThe Nobel prize for economics is awarded for work on the climate and economic growth
The 2018 Nobel prizesThe Nobel prize for economics is awarded for work on the climate and economic g ...
- delphi修改QQ快捷方式的目标地址达到在启动QQ的同时也能运行自己想要启动的EXE可执行文件
delphi修改QQ快捷方式的目标地址达到在启动QQ的同时也能运行自己想要启动的EXE可执行文件. 直接上代码,自已体会 !! Unit1.pas代码如下: unit Unit1; interface ...
- afinal框架下 ViewInject的使用
1.可以在BaseActivity界面onCreate 方法setContentView后加上该语句. initInjectedView(this); 2.@ViewInject(id=R.id.v_ ...
- easypanel api 文档
easypanel api 文档 Easypanel的api通信安全码在easypanel的服务器设置处设置. 接口名称有: add_vh 创建空间和修改空间 update_vh 暂停空间和恢复空间 ...