prometheus+grafana监控Linux和kubernetes的例子
1.安装和配置prometheus
tar zxvf prometheus-2.3..linux-amd64.tar.gz -C /usr/local/

ln -sv /usr/local/prometheus-2.3..linux-amd64/ /usr/local/prometheus

cd /usr/local/prometheus

[root@do1cloud03 prometheus]# cat prometheus.yml |egrep -v '#'

global:

alerting:

  alertmanagers:

  - static_configs:

    - targets:

rule_files:

scrape_configs:

  - job_name: linux

    static_configs:

      - targets: ['192.168.1.46:9100']

        labels:

          instance: db1

  - job_name: node45

    static_configs:

      - targets: ['192.168.1.45:9100']

        labels:

          instance: node45

/data/prometheus-2.3.0.linux-amd64/prometheus --config.file=/data/prometheus-2.3.0.linux-amd64/prometheus.yml --web.listen-address=10.253.124.27:9090
2.安装node-exporter
tar -zxvf node_exporter-0.16..linux-arm64.tar.gz

mv node_exporter-0.16..linux-amd64 /usr/local/node_exporter

./node_exporter --web.listen-address="10.253.124.7:50002" &
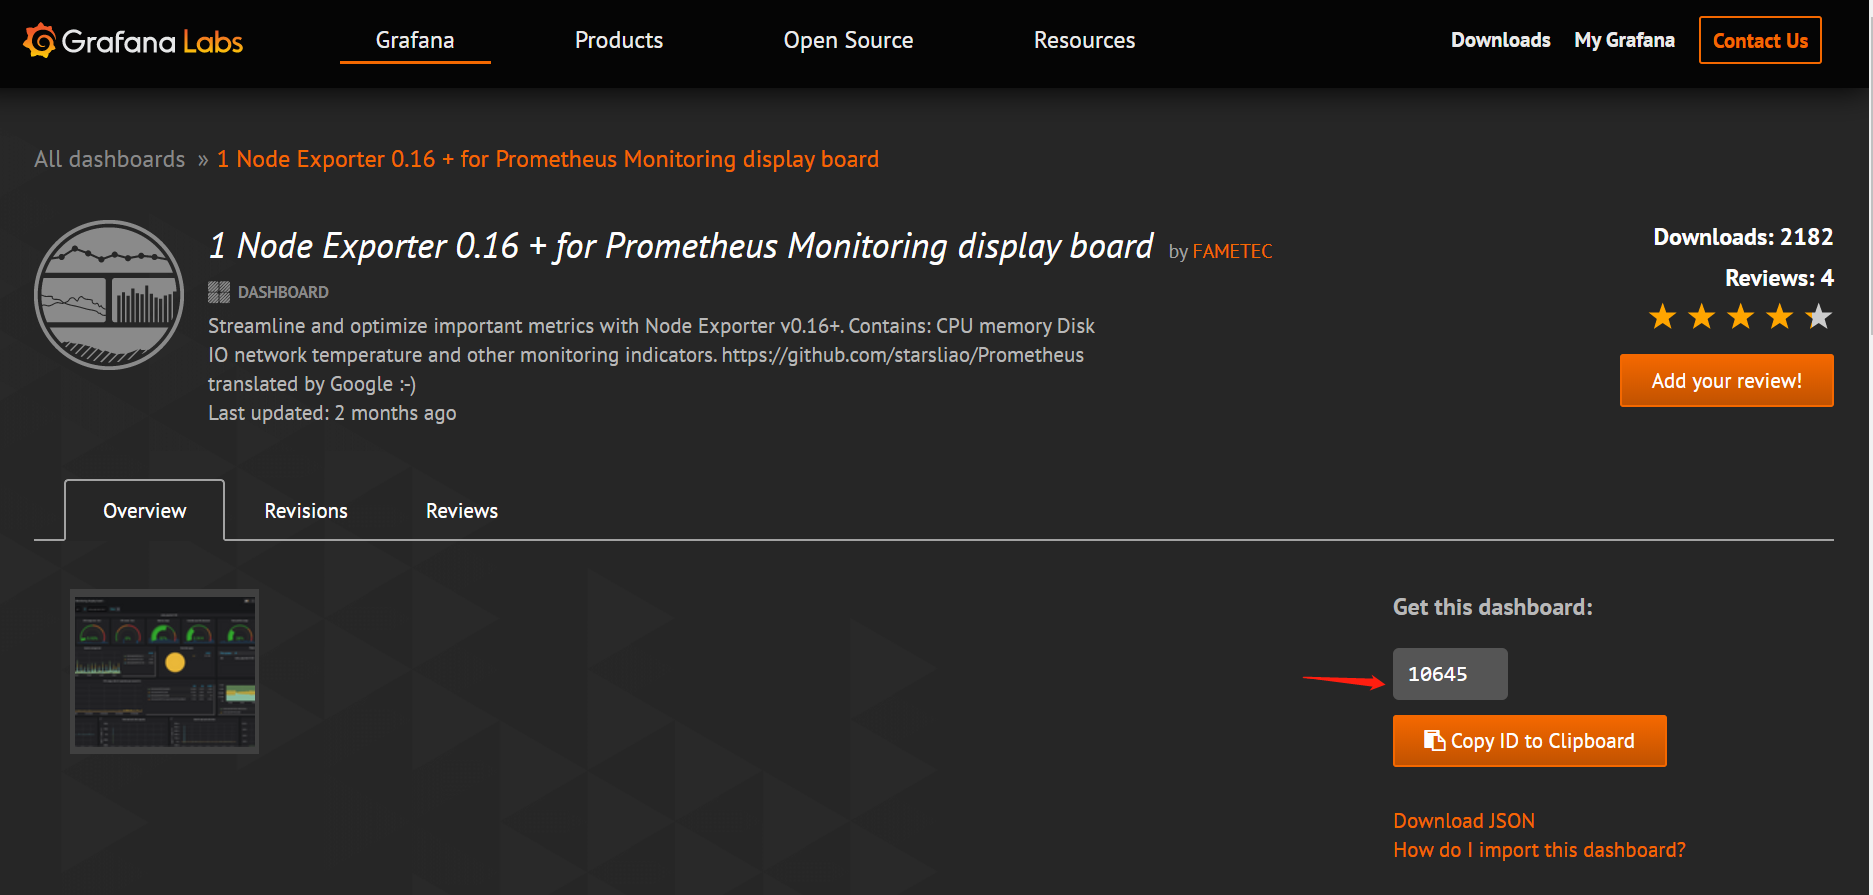
3.去官网下载node-exporter-1.6.0对应的dashboard
https://grafana.com/grafana/dashboards
4.去dashboard设置
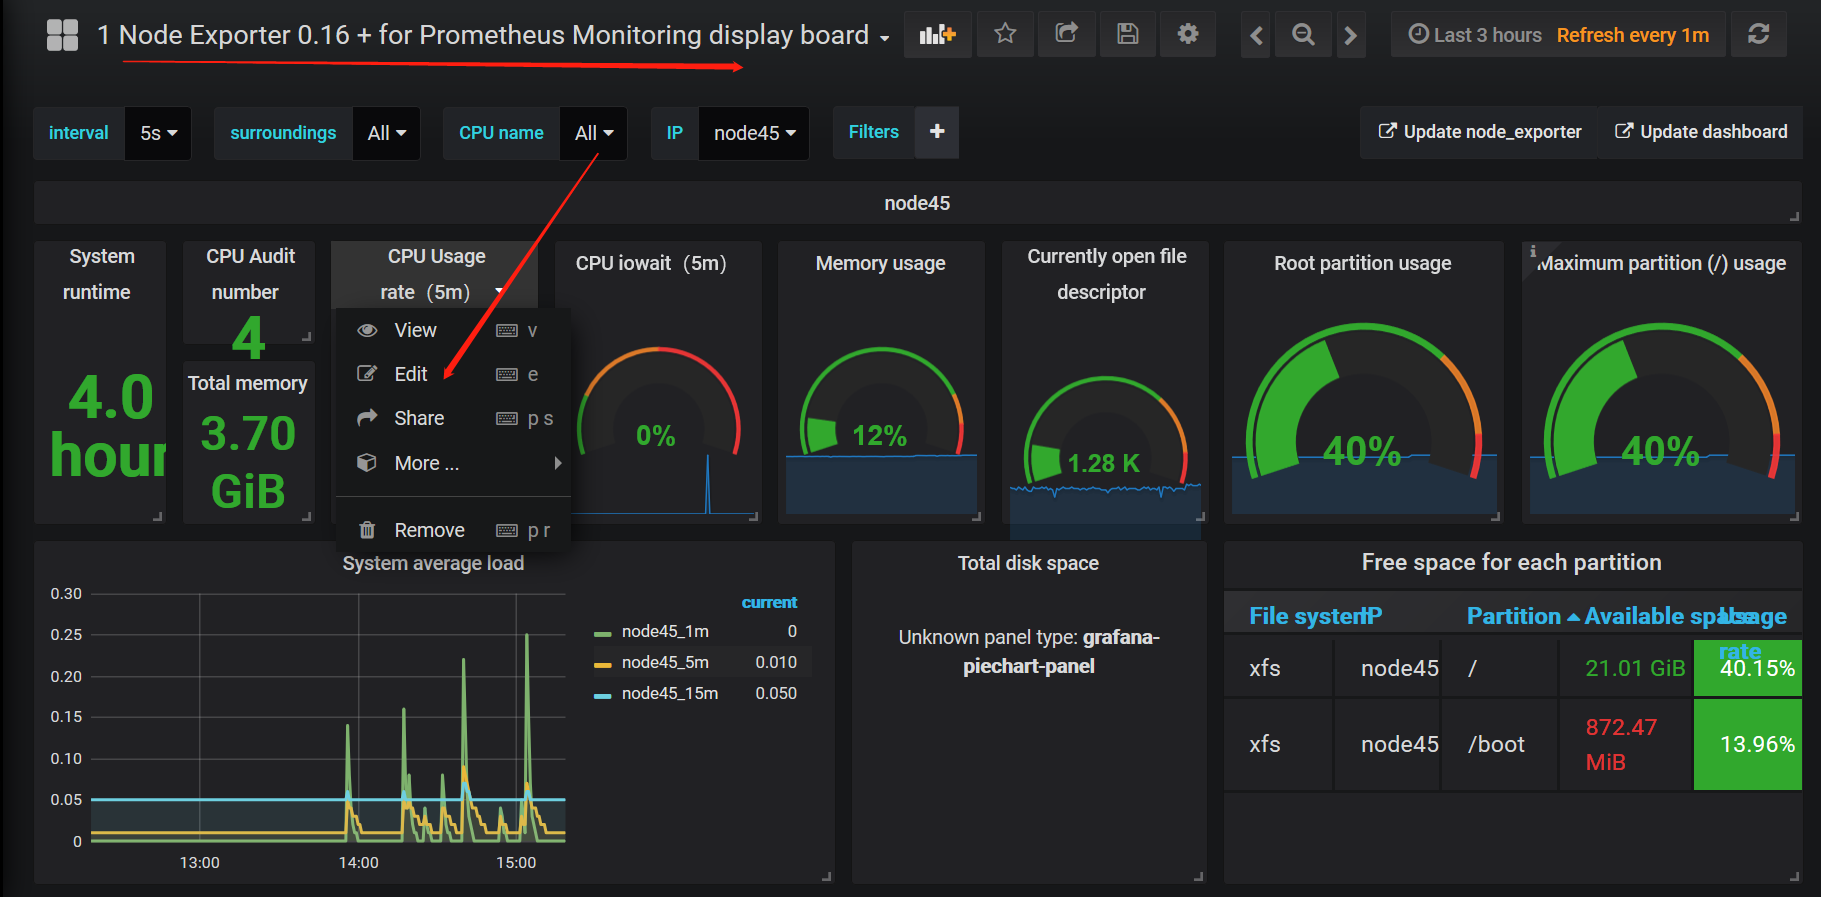
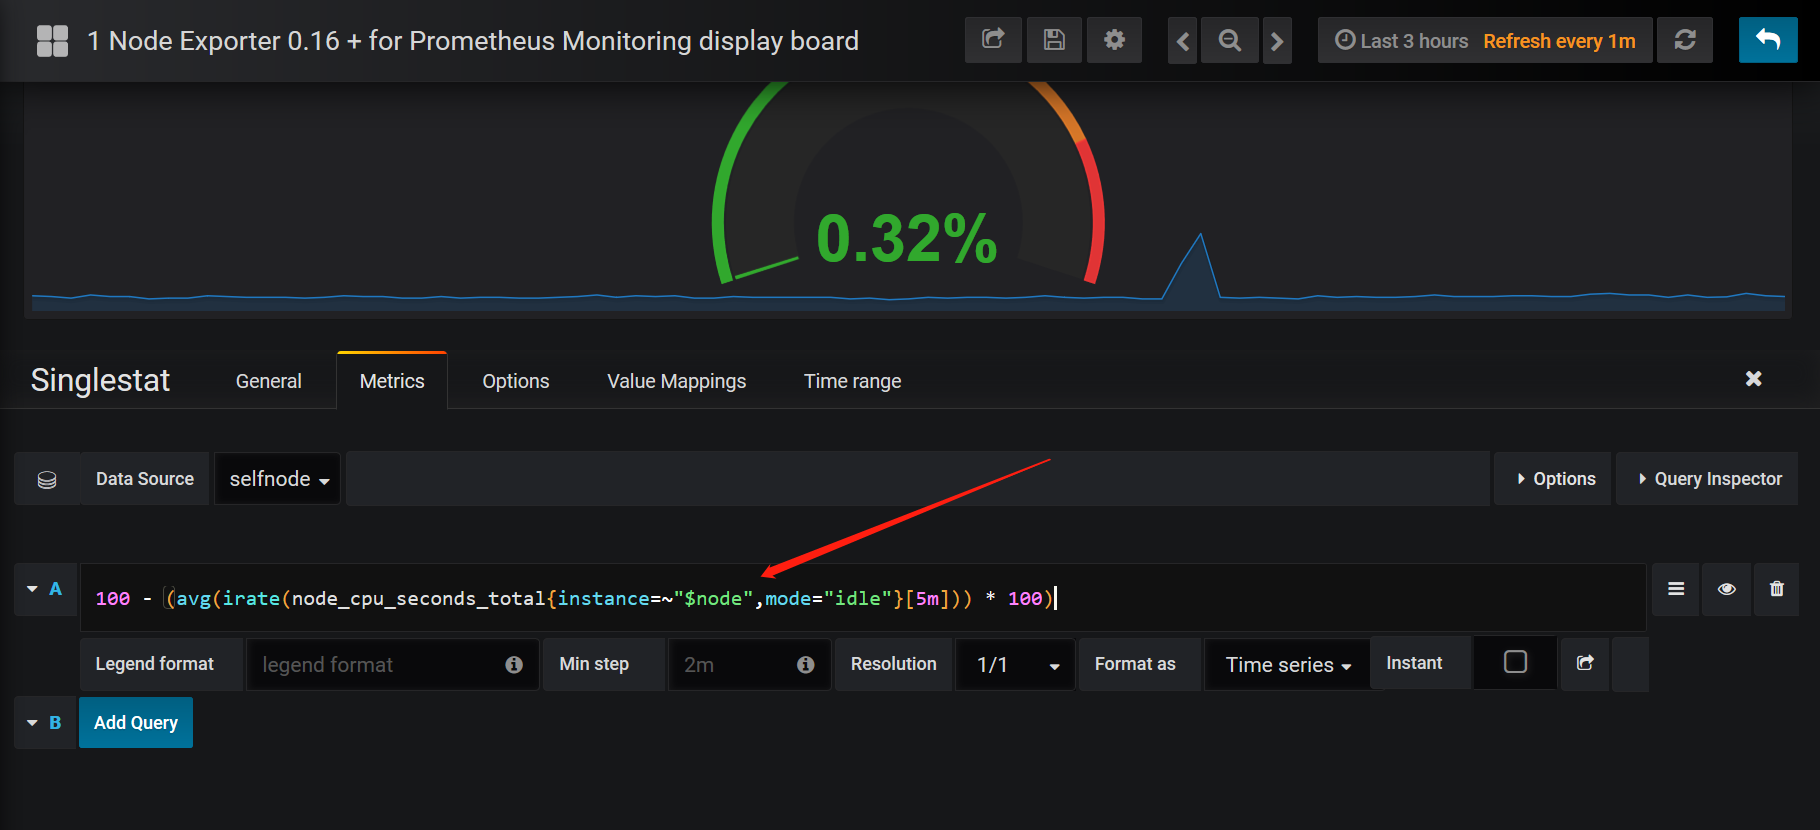
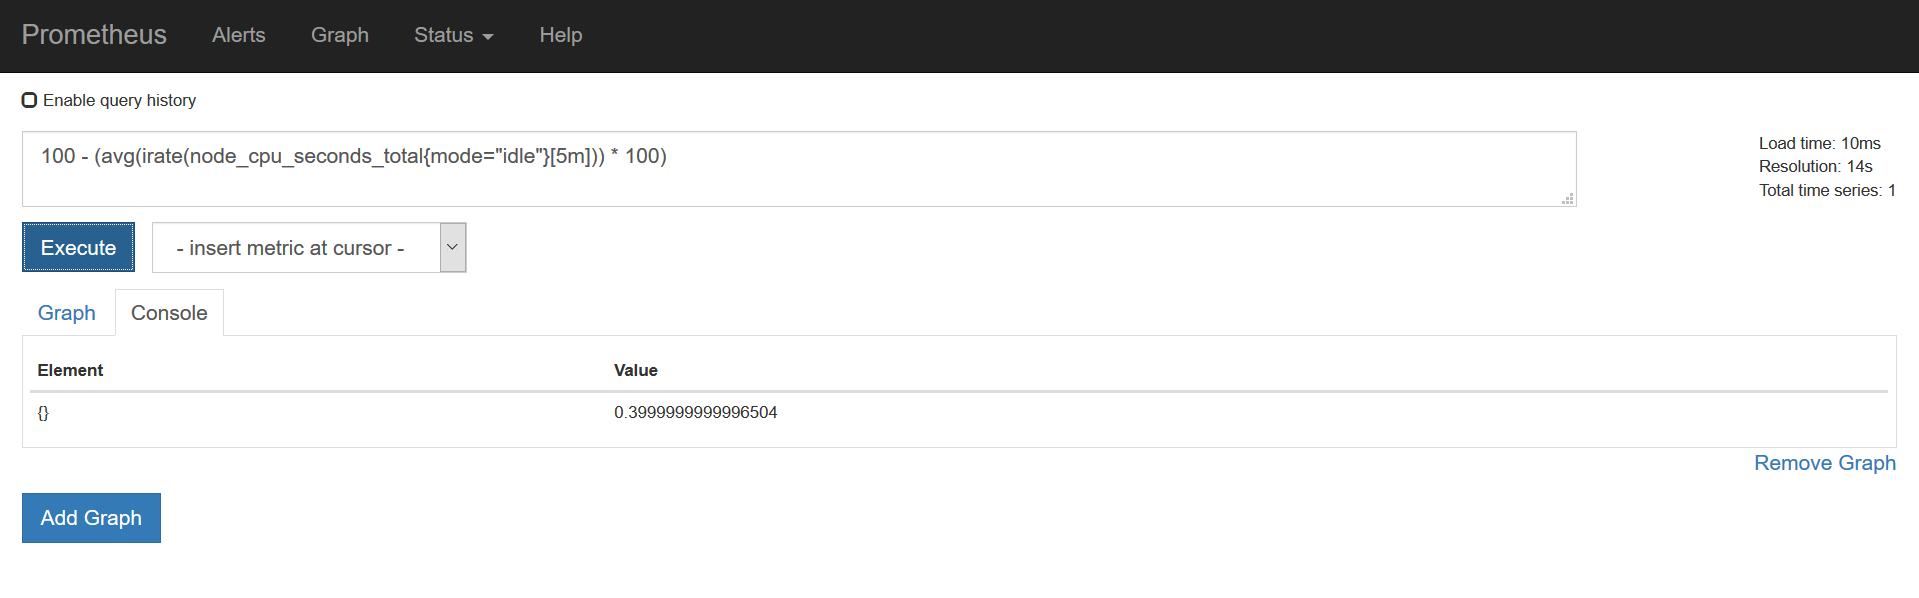
5.排错思路:在这里获取到prom sql,去Prometheus的graph查询
对于已经存储的历史数据,Prometheus提供了PromQL语言进行查询,并自带了一个简易的UI界面,可以在界面上进行查询、绘图、查看配置、告警等等。
需要学习简单的PromQL语言,在grafana里面根据业务自定义dashboard
prometheus+grafana监控Linux和kubernetes的例子的更多相关文章
- [转帖]安装prometheus+grafana监控mysql redis kubernetes等
安装prometheus+grafana监控mysql redis kubernetes等 https://www.cnblogs.com/sfnz/p/6566951.html plug 的模式进行 ...
- 安装prometheus+grafana监控mysql redis kubernetes等
1.prometheus安装 wget https://github.com/prometheus/prometheus/releases/download/v1.5.2/prometheus-1.5 ...
- Prometheus + Grafana 监控系统搭
本文主要介绍基于Prometheus + Grafana 监控Linux服务器. 一.Prometheus 概述(略) 与其他监控系统对比 1 Prometheus vs. Zabbix Zabbix ...
- [转帖]Prometheus+Grafana监控Kubernetes
原博客的位置: https://blog.csdn.net/shenhonglei1234/article/details/80503353 感谢原作者 这里记录一下自己试验过程中遇到的问题: . 自 ...
- Prometheus+Grafana监控Kubernetes
涉及文件下载地址:链接:https://pan.baidu.com/s/18XHK7ex_J0rzTtfW-QA2eA 密码:0qn6 文件中需要下载的镜像需要自己提前下载好,eg:prom/node ...
- 【Springboot】用Prometheus+Grafana监控Springboot应用
1 简介 项目越做越发觉得,任何一个系统上线,运维监控都太重要了.关于Springboot微服务的监控,之前写过[Springboot]用Springboot Admin监控你的微服务应用,这个方案可 ...
- 部署Prometheus+Grafana监控
Prometheus 1.不是很友好,各种配置都手写 2.对docker和k8s监控有成熟解决方案 Prometheus(普罗米修斯) 是一个最初在SoudCloud上构建的监控系统,开源项目,拥有非 ...
- cAdvisor+Prometheus+Grafana监控docker
cAdvisor+Prometheus+Grafana监控docker 一.cAdvisor(需要监控的主机都要安装) 官方地址:https://github.com/google/cadvisor ...
- prometheus+grafana监控redis
prometheus+grafana监控redis redis安装配置 https://www.cnblogs.com/autohome7390/p/6433956.html redis_export ...
随机推荐
- 洛谷P1006 传纸条【dp】
题目:https://www.luogu.org/problemnew/show/P1006 题意: 给定一个m*n的矩阵,从(1,1)向下或向右走到(m,n)之后向上或向左走回(1,1),要求路径中 ...
- centos7部署mysql5.7一主多从
/usr/share/mysql/charsets/ 服务器 ip 操作系统 mysql Mysql_master 192.168.188.11 centos7 5.7 Mysql_slave1 19 ...
- Clone failed: Could not read from remote repository
问题: 使用idea下载项目代码时报错,内容如下: Clone failed: Could not read from remote repository 解决方案: 把 SSH切换成 HTTP重新c ...
- [引用]MATLAB中的fft后为何要用fftshift
原文地址:MATLAB中的fft后为何要用fftshift fft是一维傅里叶变换,即将时域信号转换为频域. fftshift是针对频域的,将FFT的DC分量移到频谱中心,重新排列fft,fft1和… ...
- 使用ImageProcessor、CodeCarvings.Piczard组件生成缩略图和添加水印
技术栈: 1.ImageProcessor(专业图像处理,不能合成水印,NetCore中有它的升级版ImageSharp目前是预览包) 2.CodeCarvings.Piczard(缩略图,水印都能搞 ...
- Spring Cloud Eureka(一): 开篇说明及目录汇总
开篇简述 基于Spring Boot 和 Spring Cloud 的微服务应用,本人在工作中已经使用两年有余了,伴随着个人学习计划的实施,希望借助博文的方式,将工作中使用到的技术点体系化的总结出来, ...
- Hdu 5884
hdu 5884 Sort 题意: n个有序序列的归并排序.每次可以选择不超过k个序列进行合并,合并代价为这些序列的长度和,总的合并代价不能超过T, 问k最小是多少. 解法: 1:首先想到的是二分这个 ...
- 预处理、const、static、sizeof-为什么inline能很好地取代表达式形式的预定义
1:有如下几种原因: (1)inline定义的类的内联函数,函数的代码被放在符号表中,在使用时直接进行替换(像宏一样展开),没有了调用的开销,效率也很高. (2)类的内联函数也是一个真正的函数.编译器 ...
- Nginx之进程间的通信机制(Nginx频道)
1. Nginx 频道 ngx_channel_t 频道是 Nginx master 进程与 worker 进程之间通信的常用工具,它是使用本机套接字实现的,即 socketpair 方法,它用于创建 ...
- jquery中mouseover和mouseenter的区别
jquery中mouseover和mouseenter的区别 一.总结 一句话总结: 见名知意:enter(进入)和over(在上方)的意思好好思考一下 mouseover就是从子元素回到自己的时候也 ...