Spring Cloud学习笔记【五】Hystrix Dashboard监控面板
ystrix除了隔离依赖服务的调用以外,Hystrix 还提供了准实时的调用监控(Hystrix Dashboard),Hystrix 会持续地记录所有通过 Hystrix 发起的请求的执行信息,并以统计报表和图形的形式展示给用户,包括每秒执行多少请求多少成功,多少失败等。
下面我们基于之前的示例来结合 Hystrix Dashboard 实现 Hystrix 指标数据的可视化面板,这里我们将用到下之前实现的几个应用,包括:
- eureka-server:服务注册中心
- service-producer:服务提供者
- service-hystrix-feign:使用 Feign 和 Hystrix 实现的服务消费者
创建 Hystrix Dashboard
创建一个标准的 Spring Boot 工程,命名为:service-hystrix-dashboard
POM依赖
 <dependency>

     <groupId>org.springframework.cloud</groupId>

     <artifactId>spring-cloud-starter-netflix-hystrix</artifactId>

 </dependency>

 <dependency>

     <groupId>org.springframework.cloud</groupId>

     <artifactId>spring-cloud-starter-netflix-hystrix-dashboard</artifactId>

 </dependency>
属性配置(application.yml)
spring:

  application:

    name: service-hystrix-dashboard

server:

  port: 11000
启动类
在 Spring Boot 的启动类上面引入注解@EnableHystrixDashboard,启用 Hystrix Dashboard 功能
 package com.carry.springcloud;

 import org.springframework.boot.SpringApplication;

 import org.springframework.boot.autoconfigure.SpringBootApplication;

 import org.springframework.cloud.netflix.hystrix.dashboard.EnableHystrixDashboard;

 @EnableHystrixDashboard

 @SpringBootApplication

 public class ServiceHystrixDashboardApplication {

     public static void main(String[] args) {

         SpringApplication.run(ServiceHystrixDashboardApplication.class, args);

     }

 }
启动应用,然后再浏览器中输入 http://localhost:11000/hystrix 可以看到如下界面
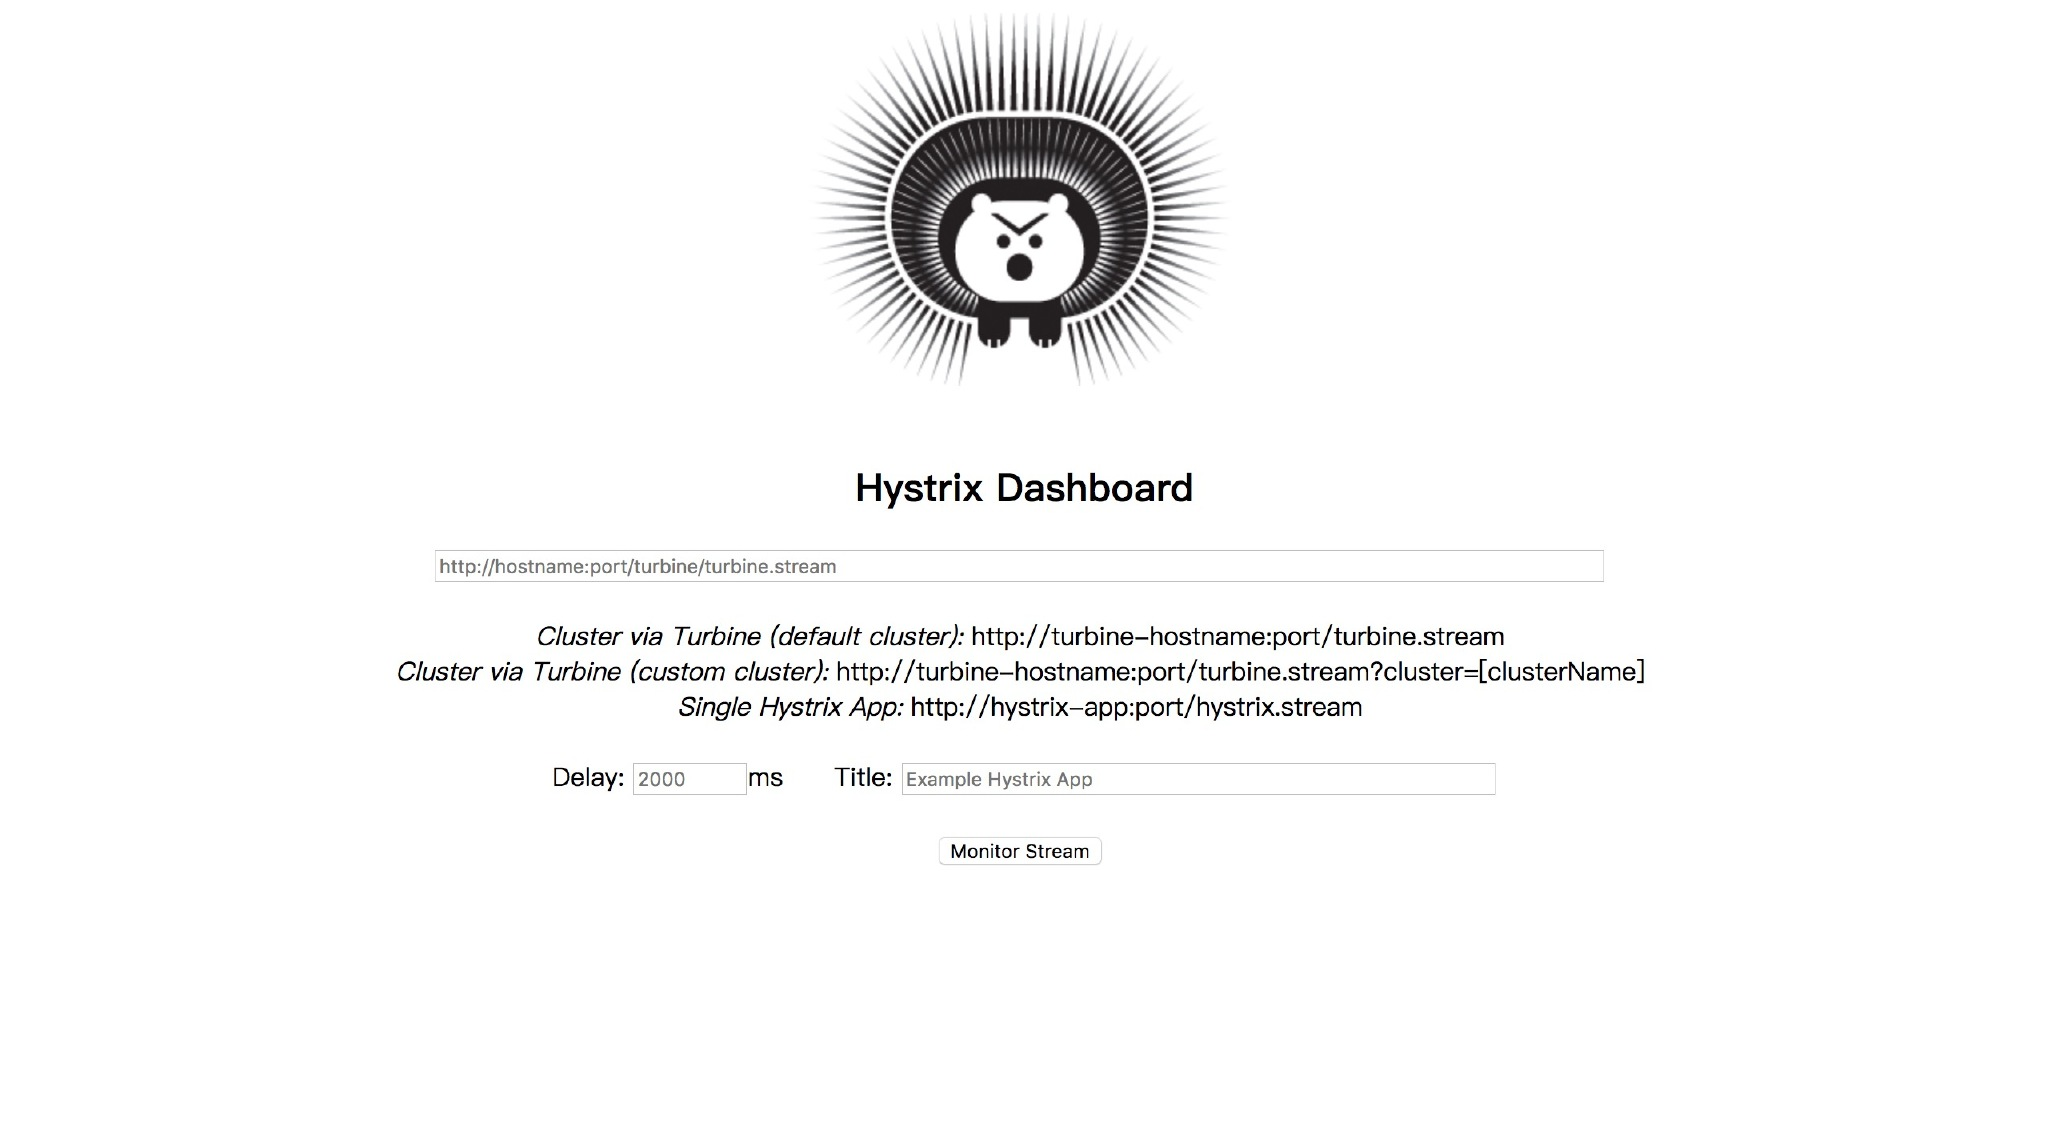
通过 Hystrix Dashboard 主页面的文字介绍,我们可以知道,Hystrix Dashboard 共支持三种不同的监控方式:
- 默认的集群监控:通过 URL:http://turbine-hostname:port/turbine.stream 开启,实现对默认集群的监控。
- 指定的集群监控:通过 URL:http://turbine-hostname:port/turbine.stream?cluster=[clusterName] 开启,实现对 clusterName 集群的监控。
- 单体应用的监控: 通过 URL:http://hystrix-app:port/actuator/hystrix.stream 开启,实现对具体某个服务实例的监控。(可通过
management.endpoints.web.base-path修改)
前两者都对集群的监控,需要整合 Turbine 才能实现。这一部分我们先实现对单体应用的监控,这里的单体应用就用我们之前使用 Feign 和 Hystrix 实现的服务消费者——service-hystrix-feign。
页面上的另外两个参数:
- Delay:控制服务器上轮询监控信息的延迟时间,默认为 2000 毫秒,可以通过配置该属性来降低客户端的网络和 CPU 消耗。
- Title:该参数可以展示合适的标题。
为服务实例service-hystrix-feign添加 endpoint
Hystrix Dashboard 监控单实例节点需要通过访问实例的/actuator/hystrix.stream接口来实现,所以我们需要为服务实例添加这个 endpoint
POM依赖
在服务实例pom.xml中的dependencies节点中新增spring-boot-starter-actuator监控模块以开启监控相关的端点,并确保已经引入断路器的依赖spring-cloud-starter-netflix-hystrix
 <dependency>

     <groupId>org.springframework.boot</groupId>

     <artifactId>spring-boot-starter-actuator</artifactId>

 </dependency>
启动类
为启动类添加@EnableCircuitBreaker或@EnableHystrix注解,开启断路器功能
 package com.carry.springcloud;

 import org.springframework.boot.SpringApplication;

 import org.springframework.boot.autoconfigure.SpringBootApplication;

 import org.springframework.cloud.netflix.hystrix.EnableHystrix;

 import org.springframework.cloud.openfeign.EnableFeignClients;

 @EnableHystrix

 @EnableFeignClients

 @SpringBootApplication

 public class ServiceHystrixFeignApplication {

     public static void main(String[] args) {

         SpringApplication.run(ServiceHystrixFeignApplication.class, args);

     }

 }
配置文件
在配置文件 application.yml 中添加
management:

  endpoints:

    web:

      exposure:

        include: hystrix.stream
management.endpoints.web.exposure.include这个是用来暴露 endpoints 的,由于 endpoints 中会包含很多敏感信息,除了 health 和 info 两个支持 web 访问外,其他的默认不支持 web 访问。详情请看官方文档 50. Endpoints
测试
在Hystrix-Dashboard 的主界面上输入service-hystrix-feign对应的地址 http://localhost:9002/actuator/hystrix.stream 然后点击 Monitor Stream 按钮,进入页面如果没有请求会一直显示 “Loading…”,这时访问 http://localhost:9002/actuator/hystrix.stream 也是不断的显示“ping”,然后访问一下 http://localhost:9002/getPoducerInfoByFeign,可以看到 Hystrix Dashboard 中出现了类似下面的效果
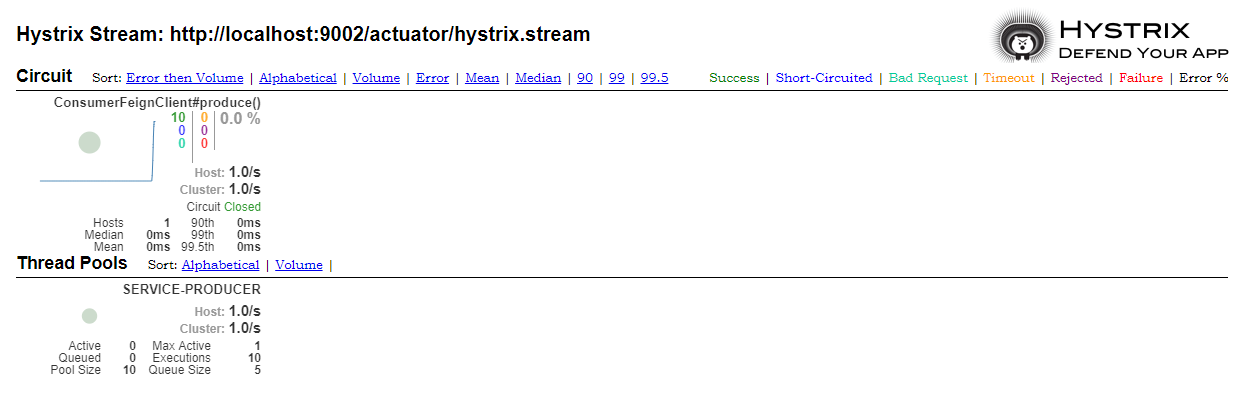
提示:如果在这个页面看到报错:Unable to connect to Command Metric Stream.,可以参考这个 Issue 解决
停掉服务生产者service-producer,继续多次访问http://localhost:9002/getPoducerInfoByFeign,最终发现Circuit的值变成Open,此时说明断路器已经打开

界面解读
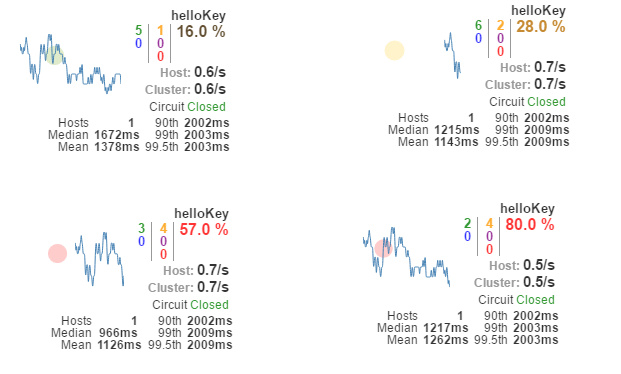
以上图来说明其中各元素的具体含义:
- 实心圆:它有颜色和大小之分,分别代表实例的监控程度和流量大小。如上图所示,它的健康度从绿色、黄色、橙色、红色递减。通过该实心圆的展示,我们就可以在大量的实例中快速的发现故障实例和高压力实例。
- 曲线:用来记录 2 分钟内流量的相对变化,我们可以通过它来观察到流量的上升和下降趋势。
- 其他一些数量指标如下图所示

Spring Cloud学习笔记【五】Hystrix Dashboard监控面板的更多相关文章
- spring cloud学习笔记五 网关服务zuul
网关服务是指,客户端发送的请求不用直接访问特定的微服务接口,而且是经过网关服务的接口进行交互,网关服务再去到特定的微服务中进行调用. 网关服务的路由功能和Nginx的反向代理一样,所有的服务都先会 ...
- spring cloud 2.x版本 Hystrix Dashboard断路器教程
前言 本文采用Spring cloud本文为2.1.8RELEASE,version=Greenwich.SR3 本文基于前两篇文章eureka-server.eureka-client.eureka ...
- Spring Cloud学习笔记【六】Hystrix 监控数据聚合 Turbine
上一篇我们介绍了使用 Hystrix Dashboard 来展示 Hystrix 用于熔断的各项度量指标.通过 Hystrix Dashboard,我们可以方便的查看服务实例的综合情况,比如:服务调用 ...
- Spring Cloud第六篇 | Hystrix仪表盘监控Hystrix Dashboard
本文是Spring Cloud专栏的第六篇文章,了解前五篇文章内容有助于更好的理解本文: Spring Cloud第一篇 | Spring Cloud前言及其常用组件介绍概览 Spring Cloud ...
- spring cloud学习笔记四 熔断器Hystrix
我们知道分布式服务有这样一个特点,每一个微服务都有自己的业务,并且很多时候一个微服务的业务要依赖于其他微服务,如果这些相互关联的微服务中其中某个微服务请求失败时,就会导致其他调用它的微服务也会请求失败 ...
- Spring Cloud学习笔记--Spring Boot初次搭建
1. Spring Boot简介 初次接触Spring的时候,我感觉这是一个很难接触的框架,因为其庞杂的配置文件,我最不喜欢的就是xml文件,这种文件的可读性很不好.所以很久以来我的Spring学习都 ...
- Spring Cloud 系列之 Netflix Hystrix 服务监控
Actuator Hystrix 除了可以实现服务容错之外,还提供了近乎实时的监控功能,将服务执行结果和运行指标,请求数量成功数量等等这些状态通过 Actuator 进行收集,然后访问 /actuat ...
- Spring Cloud学习笔记-006
服务容错保护:Spring Cloud Hystrix 在微服务架构中,我们将系统拆分成了很多服务单元,各单元的应用间通过服务注册与订阅的方式互相依赖.由于每个单元都在不同的进程中运行,依赖通过远程调 ...
- Spring Cloud 学习笔记(二)——Netflix
4 Spring Cloud Netflix Spring Cloud 通过自动配置和绑定到Spring环境和其他Spring编程模型惯例,为Spring Boot应用程序提供Netflix OSS集 ...
随机推荐
- nginx的location 匹配的规则问题
正则解释: ~ #匹配一个正则匹配,区分大小写~* #匹配一个正则,不区分大小写^~ #普通字符匹配,如果该选择匹配不匹配别的选项,一般用来匹配目录= #精确匹配 匹配案例:location = / ...
- iF.svnadmin 安装遇到的坑
iF.svnadmin 官网:http://svnadmin.insanefactory.com/ 安装配置iF.svnadmin : http://blog.linhere.com/archives ...
- Java可以远程操作服务器的协议笔记
1.SCPClient(本地复制到远程.远程复制到本地.目前未看到可以远程操作文件) 2.SMB协议(可以远程操作文件:新增.修改) 3.SFTPv3Client(可以远程操作文件:新增.修改)
- NOIp2018模拟赛四十
今天太晚了...题解到时候补吧(flag立好) 成绩:100+0+0=100 感觉A题本质暴力贪心?C题一道水题我居然没做...亏爆 A:[agc011e]increasing numbers B:[ ...
- JQ 添加节点和插入节点的方法总结
转载来源:http://blog.csdn.net/ss1106404013/article/details/49274345 添加节点的jQuery方法: append().prepend().ap ...
- POJ-3159 Candies 最短路应用(差分约束)
题目链接:https://cn.vjudge.net/problem/POJ-3159 题意 给出一组不等式 求第一个变量和最后一个变量可能的最大差值 数据保证有解 思路 一个不等式a-b<=c ...
- docker系列之一 image和container
docker images往往不知不觉就占满了硬盘空间,为了清理冗余的image,可采用以下方法: 1.进入root权限 sudo su 2.停止所有的container,这样才能够删除其中的imag ...
- 【codeforces 65A】Harry Potter and Three Spells
[题目链接]:http://codeforces.com/problemset/problem/65/A [题意] 你有3种魔法; 1.可以将a单位的石头变成b单位的铅 2.可以将c单位的铅变成d单位 ...
- Android Camera子系统之Linux C应用开发人员View
Android Camera HAL通过V4L2接口与内核Camera Driver交互.本文从Linux应用开发人员的角度审视Android Camera子系统. V4L2应用开发一般流程: 1. ...
- 最快的方式清除Chrome浏览器DNS缓存
最快的方式就是直接数据url,然后清除不须要的dns缓存. chrome://net-internals/#dns 一般步骤.要经过下列几项. Chrome - > 扳手 - > 选项 - ...