
Spring Cloud 系列之 Netflix Hystrix 服务监控
Actuator
Hystrix 除了可以实现服务容错之外,还提供了近乎实时的监控功能,将服务执行结果和运行指标,请求数量成功数量等等这些状态通过 Actuator 进行收集,然后访问 /actuator/hystrix.stream 即可看到实时的监控数据。
添加依赖
在需要开启数据监控的项目中添加 actuator 依赖。
<!-- spring boot actuator 依赖 -->

<dependency>

    <groupId>org.springframework.boot</groupId>

    <artifactId>spring-boot-starter-actuator</artifactId>

</dependency>
配置文件
在配置文件中开启 hystrix.stream 端点。如果希望所有端点暴露,配置为 '*'。
# 度量指标监控与健康检查

management:

  endpoints:

    web:

      exposure:

        include: hystrix.stream
启动类
package com.example;

import org.springframework.boot.SpringApplication;

import org.springframework.boot.autoconfigure.SpringBootApplication;

import org.springframework.cloud.client.circuitbreaker.EnableCircuitBreaker;

import org.springframework.cloud.client.loadbalancer.LoadBalanced;

import org.springframework.context.annotation.Bean;

import org.springframework.web.client.RestTemplate;

// 开启熔断器注解 2 选 1,@EnableHystrix 封装了 @EnableCircuitBreaker

// @EnableHystrix

@EnableCircuitBreaker

@SpringBootApplication

public class OrderServiceRestApplication {

    @Bean

    @LoadBalanced

    public RestTemplate restTemplate() {

        return new RestTemplate();

    }

    public static void main(String[] args) {

        SpringApplication.run(OrderServiceRestApplication.class, args);

    }

}
访问
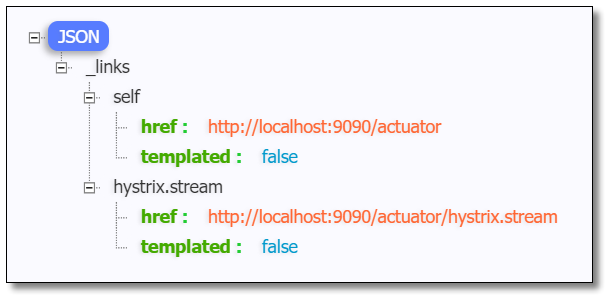
访问:http://localhost:9090/actuator 可以看到已经开启了 hystrix.stream 端点。
访问:http://localhost:9090/actuator/hystrix.stream 结果如下:
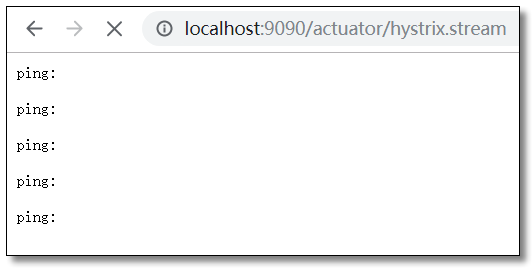
此时并没有获取到 Hystrix 的数据。接下来请求一个肯定会出错的方法产生服务熔断降级处理后,结果如下:

对于这种纯 JSON 的查看方式非常不方便我们直观的观察到服务的运行状态。我们可以使用 Hystrix 监控中心来进行查看。
监控中心
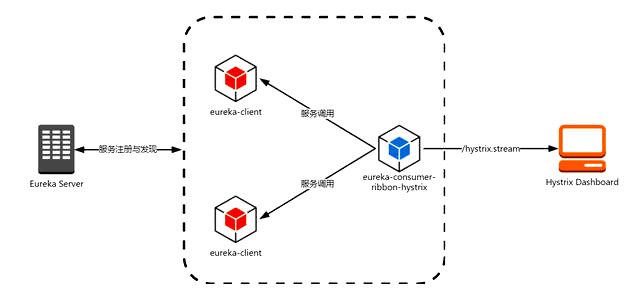
所谓的监控中心就是 Hystrix 提供的一套可视化系统 Hystrix-Dashboard ,可以非常友好的看到当前环境中服务运行的状态。Hystrix-Dashboard 是一款针对 Hystrix 进行实时监控的工具,通过 Hystrix-Dashboard 我们可以直观地看到各 Hystrix Command 的请求响应时间,请求成功率等数据。
添加依赖
在需要开启数据监控的项目中添加 dashboard 依赖。
<!-- spring boot actuator 依赖 -->

<dependency>

    <groupId>org.springframework.boot</groupId>

    <artifactId>spring-boot-starter-actuator</artifactId>

</dependency>

<!-- spring cloud netflix hystrix 依赖 -->

<dependency>

    <groupId>org.springframework.cloud</groupId>

    <artifactId>spring-cloud-starter-netflix-hystrix</artifactId>

</dependency>

<!-- spring cloud netflix hystrix dashboard 依赖 -->

<dependency>

    <groupId>org.springframework.cloud</groupId>

    <artifactId>spring-cloud-starter-netflix-hystrix-dashboard</artifactId>

</dependency>
启动类
在需要开启数据监控的项目启动类中添加 @EnableHystrixDashboard 注解。
package com.example;

import org.springframework.boot.SpringApplication;

import org.springframework.boot.autoconfigure.SpringBootApplication;

import org.springframework.cloud.client.circuitbreaker.EnableCircuitBreaker;

import org.springframework.cloud.client.loadbalancer.LoadBalanced;

import org.springframework.cloud.netflix.hystrix.dashboard.EnableHystrixDashboard;

import org.springframework.context.annotation.Bean;

import org.springframework.web.client.RestTemplate;

// 开启熔断器注解 2 选 1,@EnableHystrix 封装了 @EnableCircuitBreaker

// @EnableHystrix

@EnableCircuitBreaker

// 开启数据监控注解

@EnableHystrixDashboard

@SpringBootApplication

public class OrderServiceRestApplication {

    @Bean

    @LoadBalanced

    public RestTemplate restTemplate() {

        return new RestTemplate();

    }

    public static void main(String[] args) {

        SpringApplication.run(OrderServiceRestApplication.class, args);

    }

}
访问
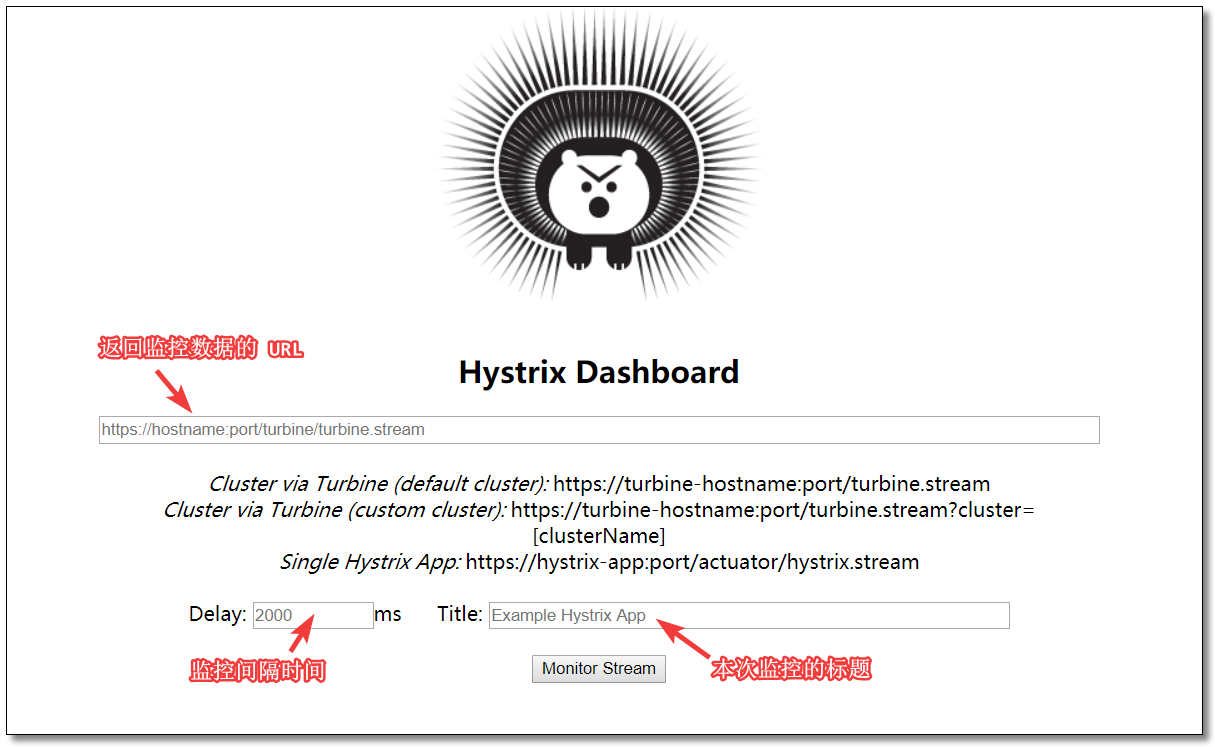
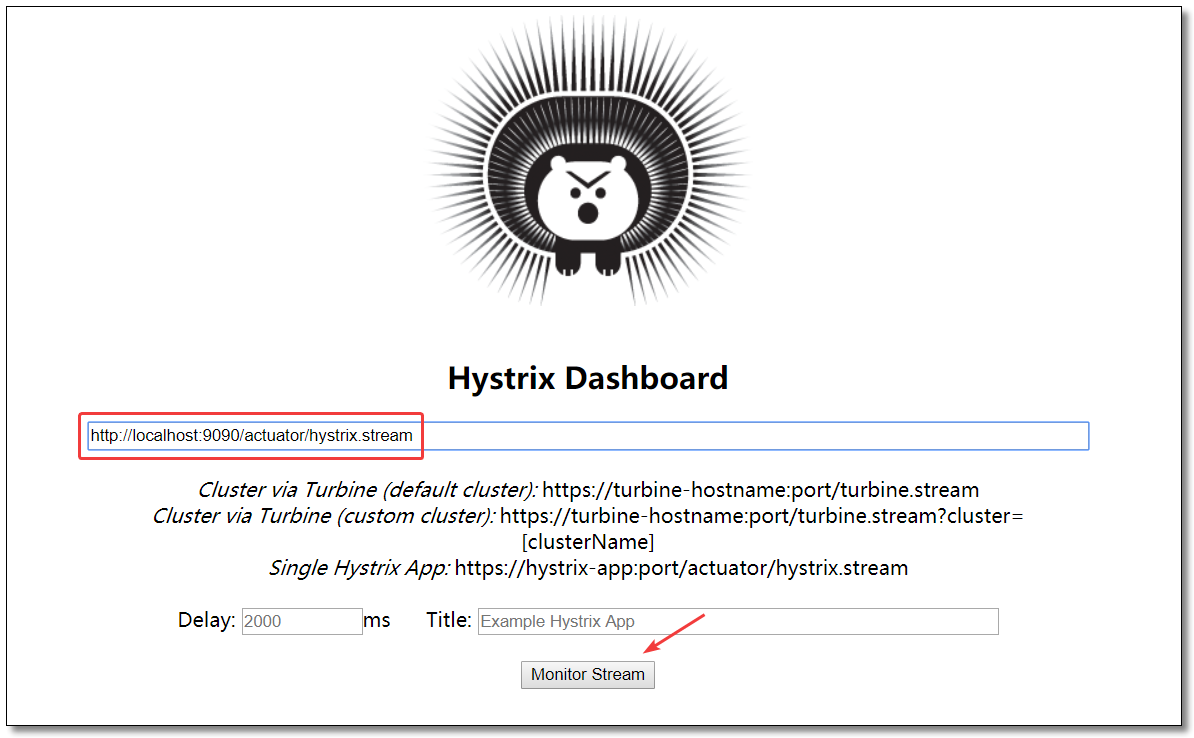
访问:http://localhost:9090/hystrix 监控中心界面如下:
查看数据
输入能够返回监控数据的URL:http://localhost:9090/actuator/hystrix.stream
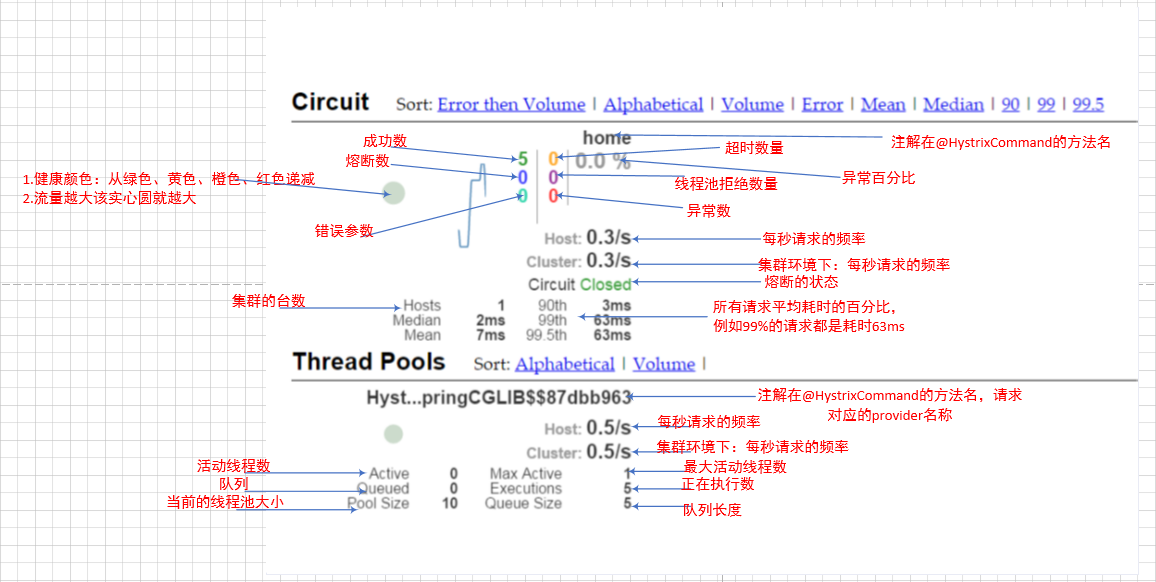
监控中心图解
聚合监控
点击链接观看:聚合监控视频(获取更多请关注公众号「哈喽沃德先生」)
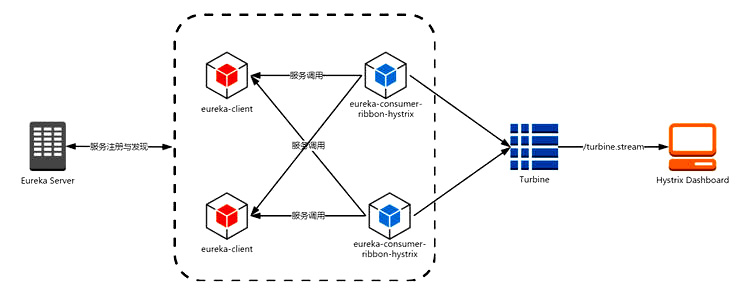
Turbine 是聚合服务器发送事件流数据的一个工具,dashboard 只能监控单个节点,实际生产环境中都为集群,因此可以通过 Turbine 来监控集群服务。
创建项目
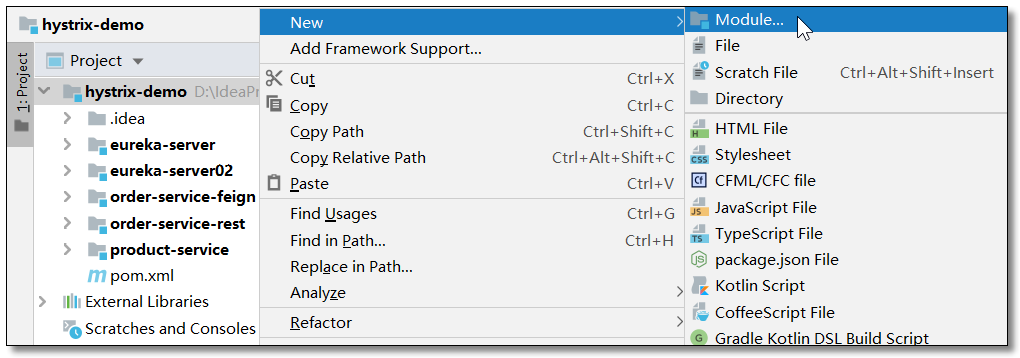
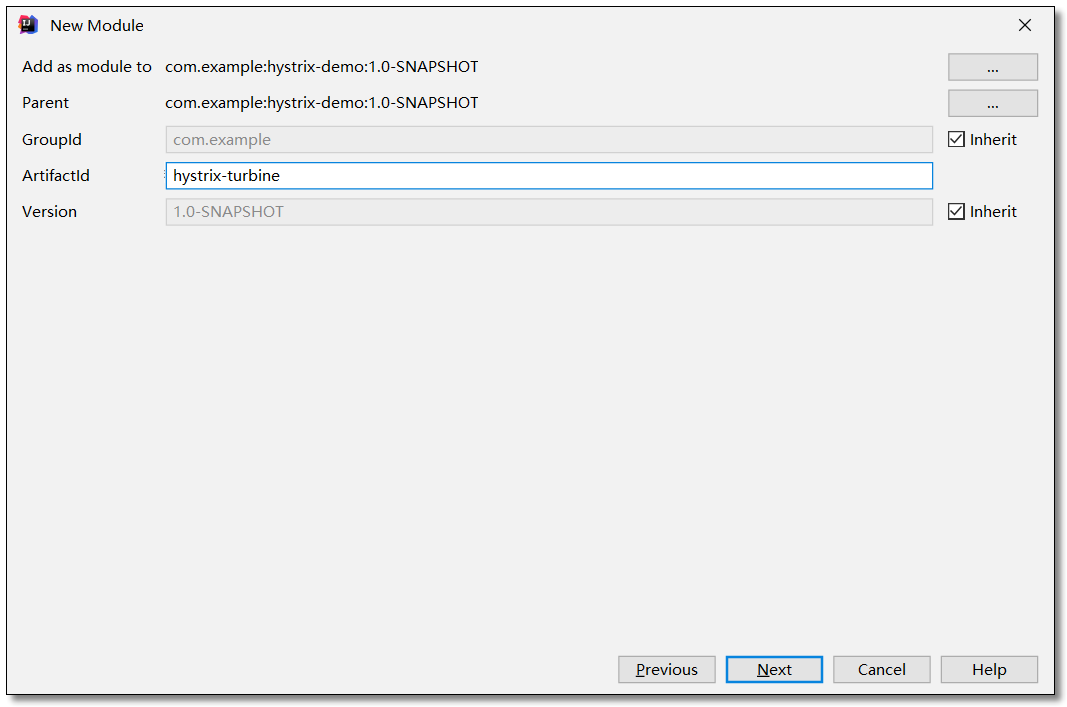
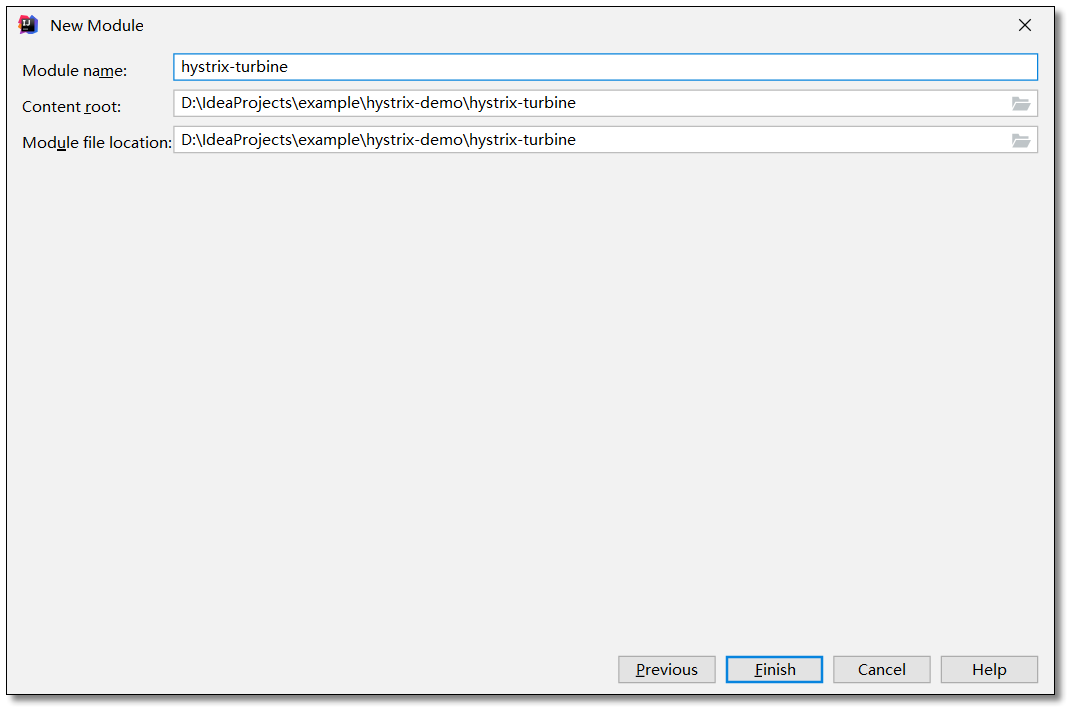
在 hystrix-demo 父工程下创建 hystrix-turbine 工程。


添加依赖
项目引入 hystrix、dashboard、turbine 三个依赖。
<?xml version="1.0" encoding="UTF-8"?>

<project xmlns="http://maven.apache.org/POM/4.0.0" xmlns:xsi="http://www.w3.org/2001/XMLSchema-instance"

         xsi:schemaLocation="http://maven.apache.org/POM/4.0.0 http://maven.apache.org/xsd/maven-4.0.0.xsd">

    <modelVersion>4.0.0</modelVersion>

    <groupId>com.example</groupId>

    <artifactId>hystrix-turbine</artifactId>

    <version>1.0-SNAPSHOT</version>

    <!-- 继承父依赖 -->

    <parent>

        <groupId>com.example</groupId>

        <artifactId>hystrix-demo</artifactId>

        <version>1.0-SNAPSHOT</version>

    </parent>

    <!-- 项目依赖 -->

    <dependencies>

        <!-- spring-cloud netflix hystrix 依赖 -->

        <dependency>

            <groupId>org.springframework.cloud</groupId>

            <artifactId>spring-cloud-starter-netflix-hystrix</artifactId>

        </dependency>

        <!-- spring cloud netflix hystrix dashboard 依赖 -->

        <dependency>

            <groupId>org.springframework.cloud</groupId>

            <artifactId>spring-cloud-starter-netflix-hystrix-dashboard</artifactId>

        </dependency>

        <!-- spring cloud netflix turbine 依赖 -->

        <dependency>

            <groupId>org.springframework.cloud</groupId>

            <artifactId>spring-cloud-starter-netflix-turbine</artifactId>

        </dependency>

    </dependencies>

</project>
配置文件
application.yml
server:

  port: 8181 # 端口

spring:

  application:

    name: hystrix-turbine # 应用名称

# 配置 Eureka Server 注册中心

eureka:

  instance:

    prefer-ip-address: true       # 是否使用 ip 地址注册

    instance-id: ${spring.cloud.client.ip-address}:${server.port} # ip:port

  client:

    service-url:                  # 设置服务注册中心地址

      defaultZone: http://localhost:8761/eureka/,http://localhost:8762/eureka/

# 聚合监控

turbine:

  # 要监控的服务列表,多个用逗号分隔

  app-config: order-service-rest,order-service-feign

  # 指定集群名称

  cluster-name-expression: "'default'"
启动类
启动类需要开启 @EnableHystrix、@EnableHystrixDashboard、@EnableTurbine 三个注解。
package com.example;

import org.springframework.boot.SpringApplication;

import org.springframework.boot.autoconfigure.SpringBootApplication;

import org.springframework.cloud.client.circuitbreaker.EnableCircuitBreaker;

import org.springframework.cloud.netflix.hystrix.dashboard.EnableHystrixDashboard;

import org.springframework.cloud.netflix.turbine.EnableTurbine;

// 开启熔断器注解 2 选 1,@EnableHystrix 封装了 @EnableCircuitBreaker

// @EnableHystrix

@EnableCircuitBreaker

// 开启数据监控注解

@EnableHystrixDashboard

// 开启聚合监控注解

@EnableTurbine

@SpringBootApplication

public class HystrixTurbineApplication {

    public static void main(String[] args) {

        SpringApplication.run(HystrixTurbineApplication.class, args);

    }

}
访问
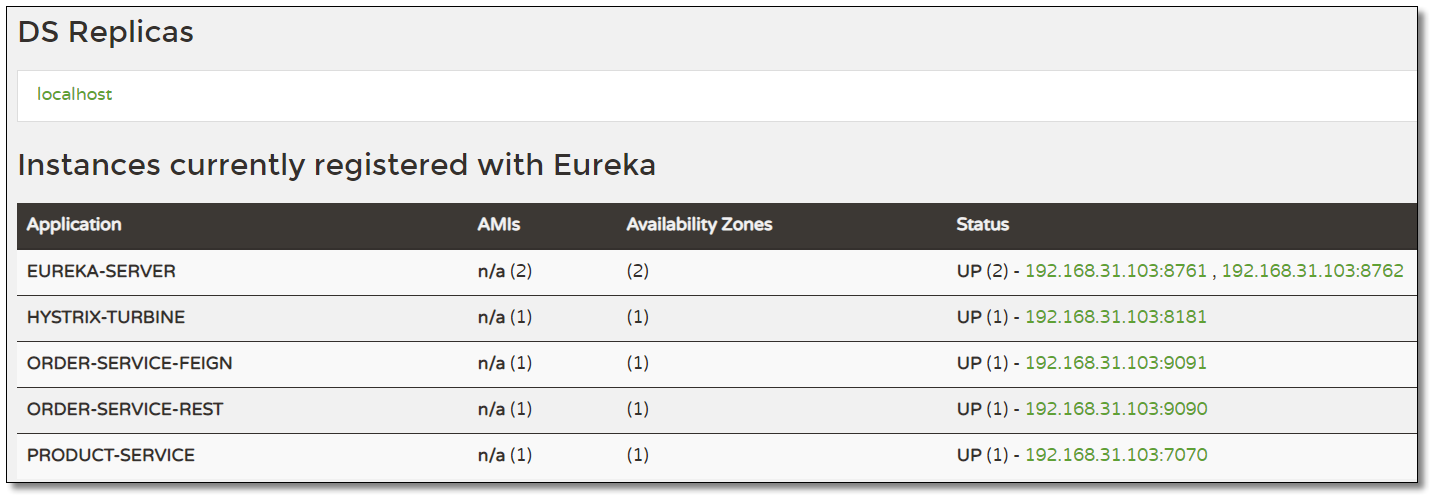
order-service-rest 和 order-service-feign 都配置监控中心,最终环境如下:
访问:http://localhost:8181/turbine.stream 多节点服务状态数据如下:

访问:http://localhost:8181/hystrix
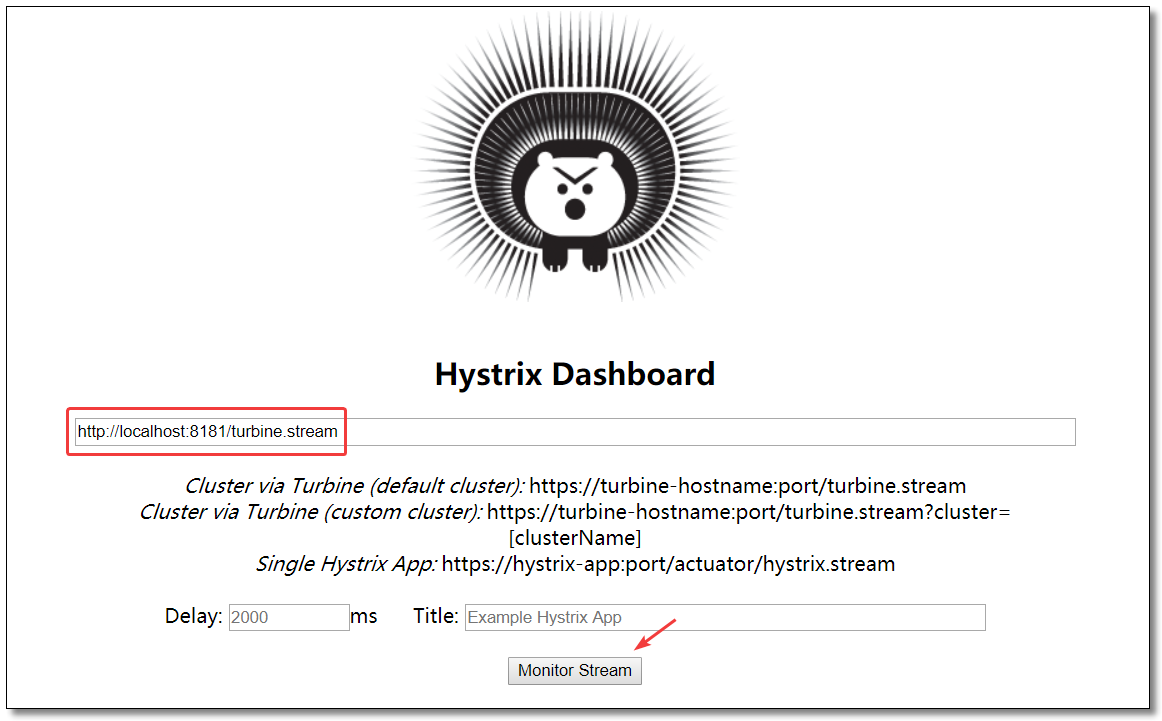
order-service-rest 和 order-service-feign 两个服务的运行状态如下:
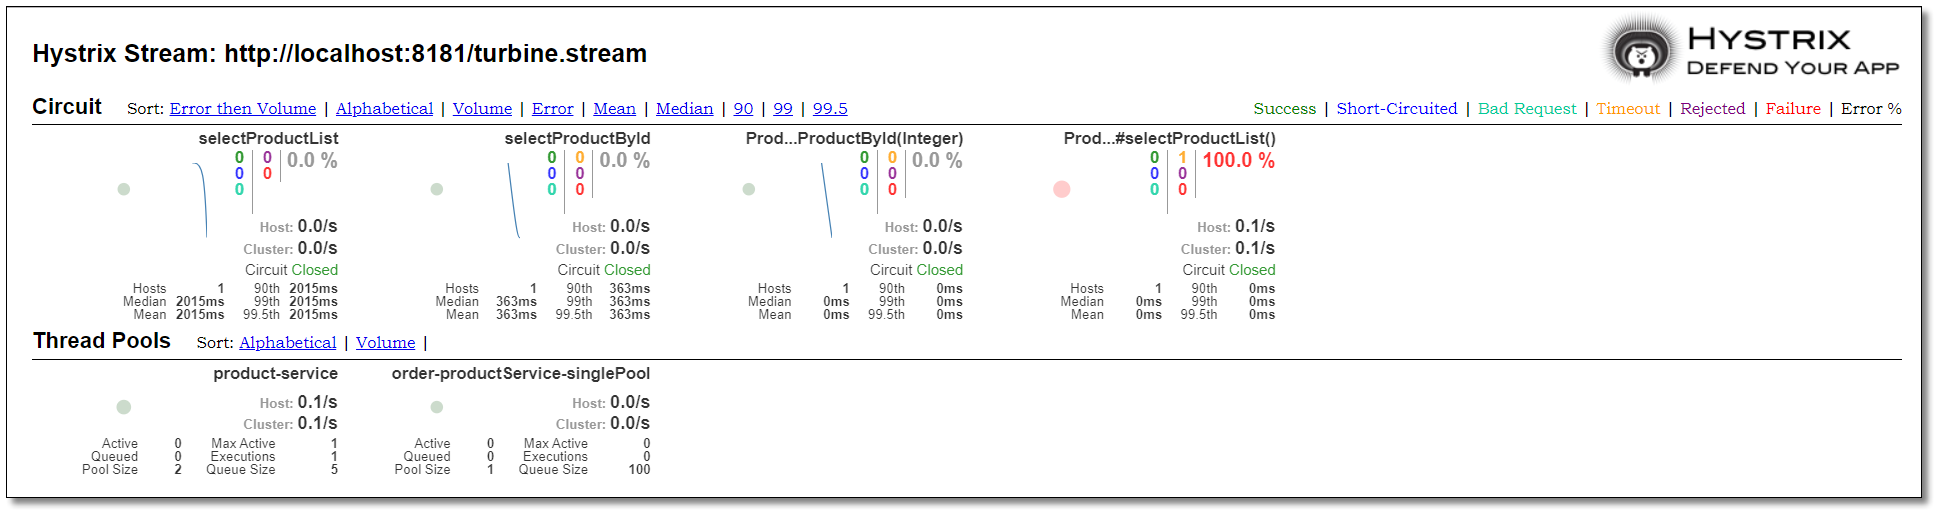
至此 Hystrix 服务监控知识点就讲解结束了。

本文采用 知识共享「署名-非商业性使用-禁止演绎 4.0 国际」许可协议。
大家可以通过 分类 查看更多关于 Spring Cloud 的文章。
Spring Cloud 系列之 Netflix Hystrix 服务监控的更多相关文章
- Spring Cloud 系列之 Netflix Hystrix 服务容错
什么是 Hystrix Hystrix 源自 Netflix 团队于 2011 年开始研发.2012年 Hystrix 不断发展和成熟,Netflix 内部的许多团队都采用了它.如今,每天在 Netf ...
- Spring Cloud 系列之 Netflix Zuul 服务网关
什么是 Zuul Zuul 是从设备和网站到应用程序后端的所有请求的前门.作为边缘服务应用程序,Zuul 旨在实现动态路由,监视,弹性和安全性.Zuul 包含了对请求的路由和过滤两个最主要的功能. Z ...
- Spring Cloud (5)hystrix 服务监控
1.pom 2.启动类 3. 微服务提供方 pom 4. 监控------已成功启动 --------------------------------------------------------- ...
- Spring Cloud 系列之 Eureka 实现服务注册与发现
如果你对 Spring Cloud 体系还不是很了解,可以先读一下 Spring Cloud 都有哪些模块 Eureka 是 Netflix 开源的服务注册发现组件,服务发现可以说是微服务架构的核心功 ...
- Spring Cloud 系列之 Alibaba Sentinel 服务哨兵
前文中我们提到 Netflix 中多项开源产品已进入维护阶段,不再开发新的版本,就目前来看是没有什么问题的.但是从长远角度出发,我们还是需要考虑是否有可替代产品使用.比如本文中要介绍的 Alibaba ...
- Spring Cloud第六篇 | Hystrix仪表盘监控Hystrix Dashboard
本文是Spring Cloud专栏的第六篇文章,了解前五篇文章内容有助于更好的理解本文: Spring Cloud第一篇 | Spring Cloud前言及其常用组件介绍概览 Spring Cloud ...
- Spring cloud系列十四 分布式链路监控Spring Cloud Sleuth
1. 概述 Spring Cloud Sleuth实现对Spring cloud 分布式链路监控 本文介绍了和Sleuth相关的内容,主要内容如下: Spring Cloud Sleuth中的重要术语 ...
- Spring Cloud系列(三) 应用监控与管理Actuator
Spring Cloud系列(二) 应用监控与管理Actuator 前言:要想使用Spring Cloud ,Spring Boot 提供的spring-boot-starter-actuator模块 ...
- Spring Cloud (5)hystrix 服务熔断
1.pom文件 <dependency> <groupId>org.springframework.cloud</groupId> <artifactId&g ...
随机推荐
- 点击一个ul的五个li元素,分别弹出他们的序号,怎么做?
方法1 : for(var i=0; i<oLis.length; i++){ oLis[i].onclick = (function(j){ return function(){ alert( ...
- zepto.js和jquery.js函数比较有什么优点?
1.Zepto.js 是专门为现代智能手机浏览器退出的 Javascript 框架, 拥有和jQuery相似的语法, 但是和jQuery相比下来, 他有很多优点, 大小方面 , 压缩后的 zepto. ...
- ARTS 第 1 周
每周一道算法.点评一篇英文技术文章.学习一个技术技巧.分享一个技术观点和思路 Algorithm 题目:两数和 给定一个整数数组,返回这两个数字的索引,使它们相加为一个指定的数. 因为是返回两个数字的 ...
- MFC中文件对话框类CFileDialog详解及文件过滤器说明
当前位置 : 首页 » 文章分类 : 开发 » MFC中文件对话框类CFileDialog详解及文件过滤器说明 上一篇 利用OpenCV从摄像头获得图像的坐标原点是在左下角 下一篇 Word中为 ...
- 移动端使用mint-ui组件loadmore填坑
链接地址为 https://mint-ui.github.io/docs/#/en2/loadmore ,这里需要注意引入的方式,我这里是用cdn的方式引入的.请结合官方API阅读本文章. 2.在 ...
- SYC极客大挑战部分题目writeup
Welcome 复制黏贴flag即可 我相信你正在与我相遇的路上马不停蹄 关注微信工作号回复"我要flag"即可获得flag 代号为geek的行动第一幕:毒雾初现 发现flag为摩 ...
- GoLand 设置与配置
1. 将 tab 改为 4个空格 2. GoLand 取消 import 自动导入
- Fedora CoreOS 非LInux专业安装文章第一手
开篇一张图 Docker基本知识掌握后,又学习了"专有的系统平台",CoreOS; 之前一直Windows,学习Docker的同时练习了好多Linux知识,全是江湖路数,打个不同就 ...
- 7-31 jmu-分段函数l (20 分)
本题目要求计算以下分段函数的值(x为从键盘输入的一个任意实数): 如果输入非数字,则输出“Input Error!” 输入格式: 在一行中输入一个实数x. 输出格式: 在一行中按”y=result”的 ...
- Nuts.js01
1.简介 Vue ssr框架.支持vue2,vue-router,vuex,vue server render, vue meta 2.基本使用: vue init nuxt-community/ko ...