scikit-plot
安装说明
安装Scikit-plot非常简单,直接用命令:
pip install scikit-plot
即可完成安装。
仓库地址:
https://github.com/reiinakano/scikit-plot
里面有使用说明和样例(py和ipynb格式)。
使用说明
简单举几个例子
比如画出分类评级指标的ROC曲线的完整代码:
from sklearn.datasets import load_digits

from sklearn.model_selection import train_test_split

from sklearn.naive_bayes import GaussianNB

X, y = load_digits(return_X_y=True)

X_train, X_test, y_train, y_test = train_test_split(X, y, test_size=0.33)

nb = GaussianNB()

nb.fit(X_train, y_train)

predicted_probas = nb.predict_proba(X_test)

# The magic happens here

import matplotlib.pyplot as plt

import scikitplot as skplt

skplt.metrics.plot_roc(y_test, predicted_probas)

plt.show()
效果如图
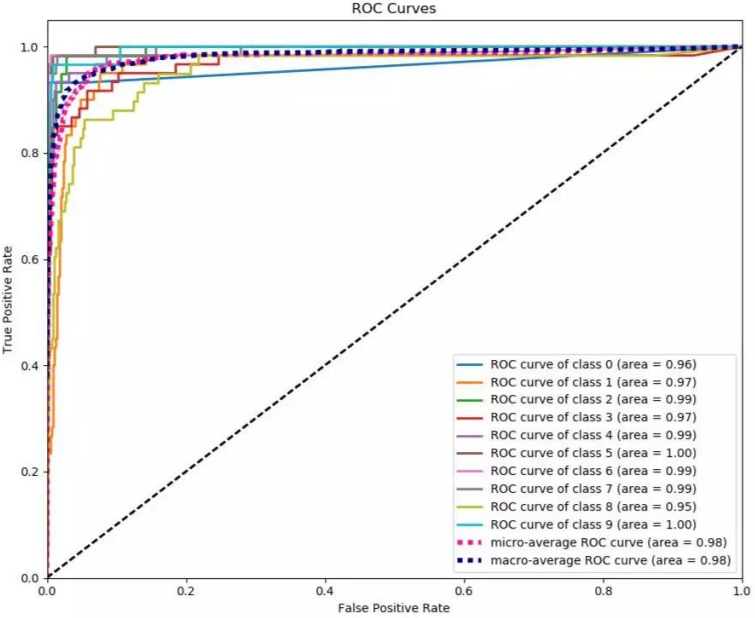
图:ROC曲线
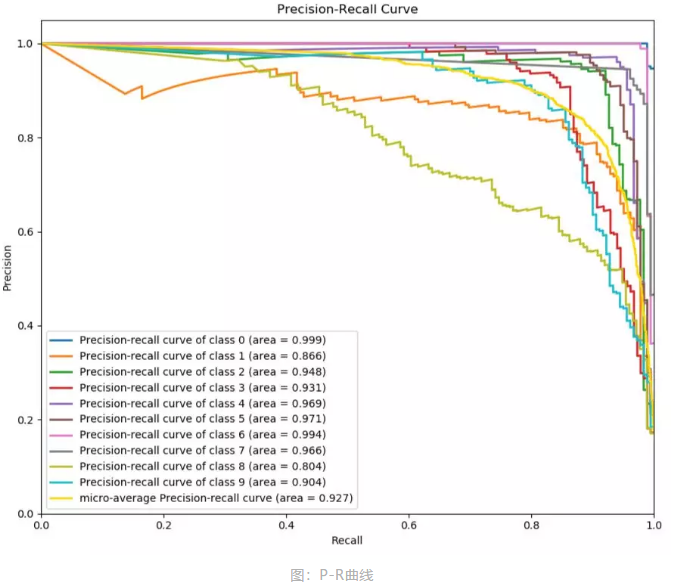
P-R曲线就是精确率precision vs 召回率recall 曲线,以recall作为横坐标轴,precision作为纵坐标轴。首先解释一下精确率和召回率。
import matplotlib.pyplot as plt

from sklearn.naive_bayes import GaussianNB

from sklearn.datasets import load_digits as load_data

import scikitplot as skplt

# Load dataset

X, y = load_data(return_X_y=True)

# Create classifier instance then fit

nb = GaussianNB()

nb.fit(X,y)

# Get predicted probabilities

y_probas = nb.predict_proba(X)

skplt.metrics.plot_precision_recall_curve(y, y_probas, cmap='nipy_spectral')

plt.show()
混淆矩阵是分类的重要评价标准,下面代码是用随机森林对鸢尾花数据集进行分类,分类结果画一个归一化的混淆矩阵。
from sklearn.ensemble import RandomForestClassifier

from sklearn.datasets import load_digits as load_data

from sklearn.model_selection import cross_val_predict

import matplotlib.pyplot as plt

import scikitplot as skplt

X, y = load_data(return_X_y=True)

# Create an instance of the RandomForestClassifier

classifier = RandomForestClassifier()

# Perform predictions

predictions = cross_val_predict(classifier, X, y)

plot = skplt.metrics.plot_confusion_matrix(y, predictions, normalize=True)

plt.show()
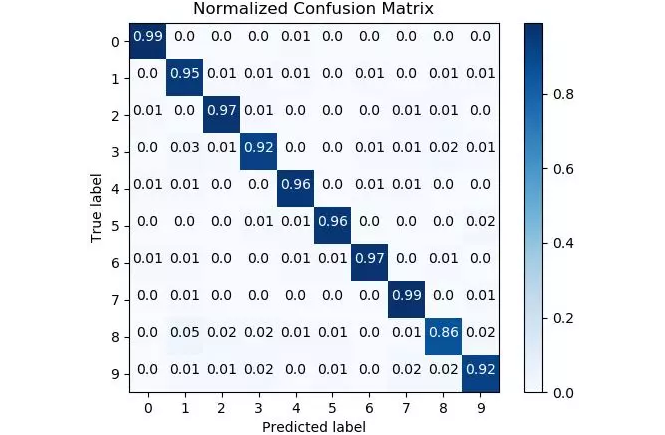
图:归一化混淆矩阵
其他图如学习曲线、特征重要性、聚类的肘点等等,都可以用几行代码搞定。
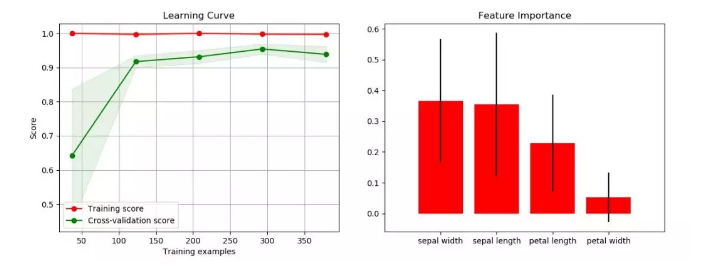
图:学习曲线、特征重要性
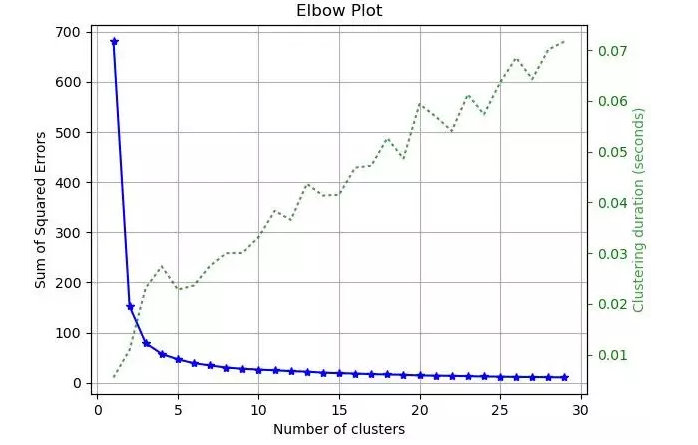
图:K-means肘点图
scikit-plot的更多相关文章
- (原创)(三)机器学习笔记之Scikit Learn的线性回归模型初探
一.Scikit Learn中使用estimator三部曲 1. 构造estimator 2. 训练模型:fit 3. 利用模型进行预测:predict 二.模型评价 模型训练好后,度量模型拟合效果的 ...
- Linear Regression with Scikit Learn
Before you read This is a demo or practice about how to use Simple-Linear-Regression in scikit-lear ...
- matlab画图函数plot()/set/legend
简单plot()/legend/XY轴范围axis 除了坐标轴信息外还可以添加其它的信息,如所画曲线的信息等:测试代码如下 x=0:pi/20:2*pi; y1=sin(x); y2=cos(x); ...
- MATLAB的PLOT函数线型设置及横坐标为字符串的代码实例
2.横坐标为字符串的代码实例 cell={‘PLS’,’SVM’,’RF’,’NNET’,’NB’,’PLR’,’C5.0′,’PDA’,’KNN’,’GLM’,’BCT’};%分类方法yData=[ ...
- 【搬砖】【Python数据分析】Pycharm中plot绘图不能显示出来
最近在看<Python数据分析>这本书,而自己写代码一直用的是Pycharm,在练习的时候就碰到了plot()绘图不能显示出来的问题.网上翻了一下找到知乎上一篇回答,试了一下好像不行,而且 ...
- MATLAB plot 绘图的一些经验,记下来,facilitate future work
[转载请注明出处]http://www.cnblogs.com/mashiqi 2016/03/28 % 调整figure的位置scrsz = get(0,'ScreenSize'); % 这个命令是 ...
- R语言画全基因组关联分析中的曼哈顿图(manhattan plot)
1.在linux中安装好R 2.准备好画曼哈顿图的R脚本即manhattan.r,manhattan.r内容如下: #!/usr/bin/Rscript #example : Rscript plot ...
- Mac下 Octave 中plot 无法绘制
在coursera看机器学习课程的时候用到Octave来做数据处理,但是装了之后用plot画图时就会报错: set terminal aqua enhanced title "Figure ...
- MATLAB中plot()画图的颜色线型和希腊字母参数设置
y 黄色 · 点线 m 粉红 ○ 圈线 c ...
- gnuplot conditional plotting: plot col A:col B if col C == x
http://stackoverflow.com/questions/6564561/gnuplot-conditional-plotting-plot-col-acol-b-if-col-c-x H ...
随机推荐
- win 10 系统激活
win10企业版永久激活方法?win10企业版是针对企业用户推出的版本,随着win10系统的不断完善,现在越来越多的人选择升级win10,升级完系统就需要激活它.那么今天就为大家分享一下怎么永久激活w ...
- loadrunner 场景设计-手工场景方案(Schedule)设计 Part 1
参考:http://blog.sina.com.cn/s/articlelist_5314188213_1_1.html loadrunner 场景设计-手工场景方案(Schedule)设计 Part ...
- SAS数据挖掘实战篇【六】
SAS数据挖掘实战篇[六] 6.3 决策树 决策树主要用来描述将数据划分为不同组的规则.第一条规则首先将整个数据集划分为不同大小的 子集,然后将另外的规则应用在子数据集中,数据集不同相应的规则也不同 ...
- Tensorflow-gpu搭建CUDA 10.0与cuDNN等版本问题
https://blog.csdn.net/weixin_42718092/article/details/85001140
- CentOS 升级 openSSH+ sh脚本自动运维
升级前后对比 openSSH作为linux远程连接工具,容易受到攻击,必须更新版本来解决,低版本有如下等漏洞: OpenSSH 远程代码执行漏洞(CVE-2016-10009) OpenSSH au ...
- vue2创建webpack项目build之后无法正常显示页面的问题
最近在做vue项目的时候,项目正常运行,但是当我打包上线之后,却出现无法出现页面空白的情况,打开控制台,发现无法加载到css和js文件. 仔细观察发现路径中少了一个dis文件夹,于是我加上dist文件 ...
- CTF—攻防练习之FTP服务后门
主机:192.168.32.152 靶机:192.168.32.156 首先查看靶机开放的端口: nmap 192.168.32.156 nmap -T4 -A -v 192.168.32.156 ...
- Mysql 字段类型与查询类型不一致导致索引使用失败
今天优化数据库的慢查询,有一条Sql让我百思不得其jie,就是他了. SELECT * FROM test WHERE user_id=1; 用explain 去分析一下 索引都有了,为什么还要扫描全 ...
- 微信小程序日历插件
1/ wxml代码 <view class="timePick"> <picker mode="date" fields="mo ...
- Spark架构角色及基本运行流程
1. 集群角色 Application:基于spark的用户程序,包含了一个Driver program 和集群中多个Executor Driver Program:运行application的mai ...