使用d3.v5实现折线图与面积图
d3最新是V5版的,比起V2的API变动了不少,写下我实现过程
效果图:
面积图:
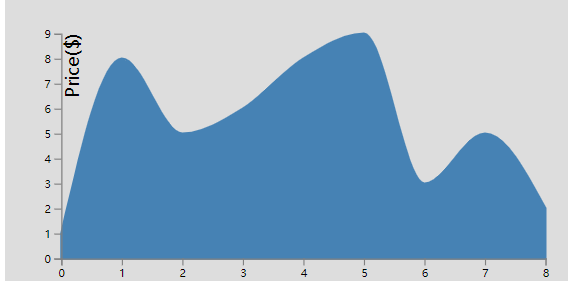
折线图:

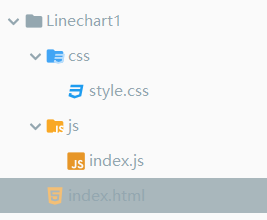
目录结构:
<!DOCTYPE html>

<html lang="en">

<head>

    <meta charset="UTF-8">

    <link href="css/style.css" media="screen" rel="stylesheet" type="text/css"/>

    <title>Linechart1</title>

</head>

<body>

    <div id="container"></div>

    <script src="https://d3js.org/d3.v5.min.js"></script>

    <script src="js/index.js"></script>

</body>

</html>
index.html
#container{

    background: #ddd;

    width: 500px;

    height: 250px;

}

path{

    fill: none;

    stroke: steelblue;

    stroke-width: 2;

}

.domain ,.tick line{

    stroke:gray;

    stroke-width: 1;

}
style.css
var width=500,height=250,

    margin={left:50,top:30,right:20,bottom:20},

    g_width=width-margin.left-margin.right,

    g_height=height-margin.top-margin.bottom;

//svg

d3.select("#container").append("svg")

    //width,height

    .attr("width",width)

    .attr("height",height)

var g=d3.select("svg")

    .append("g")

    .attr("transform","translate("+margin.left+","+margin.top+")");

var data=[1,8,5,6,8,9,3,5,2]

//Scale

var scale_x=d3.scaleLinear()

    .domain([0,data.length-1])

    .range([0,g_width]);

var scale_y=d3.scaleLinear()

    .domain([0,d3.max(data)])

    .range([g_height,0]);

//画线函数

var line_generator= d3.line()

    .x(function (d,i) {

        return scale_x(i);

    })

    .y(function (d) {

        return scale_y(d);

    })

    .curve(d3.curveMonotoneX)

    // .curve(d3.curveMonotoneX) // apply smoothing to the line

//画路径

g.append("path")

    .attr("d",line_generator(data)) //d="M1,0L20,40.....  d-path data

// //画面积函数

// var area_generator= d3.area()

//     .x(function (d,i) {

//         return scale_x(i);

//     })

//     .y0(g_height)

//     .y1(function (d) {

//         return scale_y(d);

//     })

//     .curve(d3.curveMonotoneX)

//

// //画面积

// g.append("path")

//     .attr("d",area_generator(data)) //d="M1,0L20,40.....  d-path data

//     .style("fill","steelblue")

//X轴

g.append("g")

    .call(d3.axisBottom(scale_x))

    .attr("transform","translate(0,"+g_height+")")

//Y轴

g.append("g")

    .call(d3.axisLeft(scale_y))

//y轴文字

g.append("text")

    .text("Price($)")

    .attr("transform","rotate(-90)")

    .attr("dy","1em")

    .attr("text-anchor","end")
其中,使用红色部分,注释绿色部分是面积图
使用绿色部分,注释红色部分是折线图
data数组是数据来源。
参考教程:https://www.imooc.com/learn/103
使用d3.v5实现折线图与面积图的更多相关文章
- 06. Matplotlib 2 |折线图| 柱状图| 堆叠图| 面积图| 填图| 饼图| 直方图| 散点图| 极坐标| 图箱型图
1.基本图表绘制 plt.plot() 图表类别:线形图.柱状图.密度图,以横纵坐标两个维度为主同时可延展出多种其他图表样式 plt.plot(kind='line', ax=None, figsiz ...
- Python交互图表可视化Bokeh:4. 折线图| 面积图
折线图与面积图 ① 单线图.多线图② 面积图.堆叠面积图 1. 折线图--单线图 import numpy as np import pandas as pd import matplotlib.py ...
- Python使用Plotly绘图工具,绘制面积图
今天我们来讲一下如何使用Python使用Plotly绘图工具,绘制面积图 绘制面积图与绘制散点图和折线图的画法类似,使用plotly graph_objs 中的Scatter函数,不同之处在于面积图对 ...
- Matplotlib学习---用matplotlib画面积图(area chart)
这里利用Nathan Yau所著的<鲜活的数据:数据可视化指南>一书中的数据,学习画图. 数据地址:http://book.flowingdata.com/ch05/data/us-pop ...
- javascript曲线图和面积图Line & Area chart控件功能及下载
Line & Area chart 控件是一款新型的.可用性极强的曲线图和面积图产品.一个您网站的访问者可以放大他感兴趣的一段区域,打开和关闭数值气球,并可显示和隐藏图表.您能创建简单.堆积. ...
- 第四篇:R语言数据可视化之折线图、堆积图、堆积面积图
折线图简介 折线图通常用来对两个连续变量的依存关系进行可视化,其中横轴很多时候是时间轴. 但横轴也不一定是连续型变量,可以是有序的离散型变量. 绘制基本折线图 本例选用如下测试数据集: 绘制方法是首先 ...
- 使用d3.v5实现饼状图
效果图: 饼状图: 目录结构: <!DOCTYPE html> <html lang="en"> <head> <meta charset ...
- pyecharts v1 版本 学习笔记 折线图,面积图
折线图 折线图 基本demo import pyecharts.options as opts from pyecharts.charts import Line c = ( Line() .add_ ...
- [Swift通天遁地]三、手势与图表-(13)制作美观简介的滚动图表:折线图表、面积图表、柱形图表、散点图表
★★★★★★★★★★★★★★★★★★★★★★★★★★★★★★★★★★★★★★★★➤微信公众号:山青咏芝(shanqingyongzhi)➤博客园地址:山青咏芝(https://www.cnblogs. ...
随机推荐
- ORC文字识别软件破解版
下载地址:http://pan.baidu.com/s/1bnCiXdl 点击 然后可以免费用了ABBYY了!!
- QTP自动化测试流程
1)准备TestCase - 在进行自动化之前,将测试内容进行文档化,不建议直接录制脚本 - 在录制脚本之前设计好脚本,便于录制过程的流畅 - 由于测试用例设 ...
- String的valueOf()用于将其它类型转换为字符串
String的valueOf()重载方法可将double类型,int类型,boolean类型以及char数组类型等变量转换为String类变量. 注:String的valueOf()可将char数组转 ...
- jms中activemq事务探讨
http://blog.csdn.net/dly1580854879/article/details/68945997
- Spring Security-- 验证码功能的实现
spring security4 添加验证码 http://www.itwendao.com/article/detail/165400.html http://www.itdadao.com/art ...
- Using variables inside Postman and Collection Runner
Variables are among the most powerful features in Postman. Using variables in your Postman requests, ...
- app后端设计(11)-- 系统架构(2014.12.05更新)
个人认为,在小型的创业团队中,特别是以应用产品为主,在架构后台的时候,需要集中精力解决自身业务上的问题,不是花时间解决第三方已经解决的问题,简单点来说,就是能用第三方服务就使用第三方的服务.基于这个原 ...
- easyui下载包详解
easyui包详解: 文件夹: demo--该目录下存放的是 EasyUI PC 版各插件的示例示例.如果不想在官网上查看演示,可以在该目录下找到相应的演示示例 demo-mobile--该目录下存放 ...
- centos系统查看系统版本、内核版本、系统位数、cpu个数、核心数、线程数
centos查看系统版本 cat /etc/redhat-release CentOS Linux release 7.2.1511 (Core) 1)查看centos内核的版本: [root@loc ...
- linux常用命令:创建文件和文件夹
1.首先说一下touch 创建文件的命令,touch可以用于创建二进制文件,用法非常简单.用法:touch+文件名,touch与文件名之间一定要有空格.图中先用之前分享过的命令来查看一下/目录下面有多 ...