Prometheus MySQL监控+grafana展示
前言
最近爱上了研究各种杂七杂八的技术。
Prometheus是现如今最火的监控软件之一。做为一个运维DBA,不会这个可就OUT了。
本篇博客,演示一下prometheus之通过mysql exporter+node exporter监控mysql,并使用grafana进行图表展示。
概述
prometheus是由SoundCloud开发的开源监控告警系统并且自带时序数据库,基于Go语言。Prometheus根据配置的任务(job)以周期性pull的方式获取指定目标(target)上的指标(metric)。
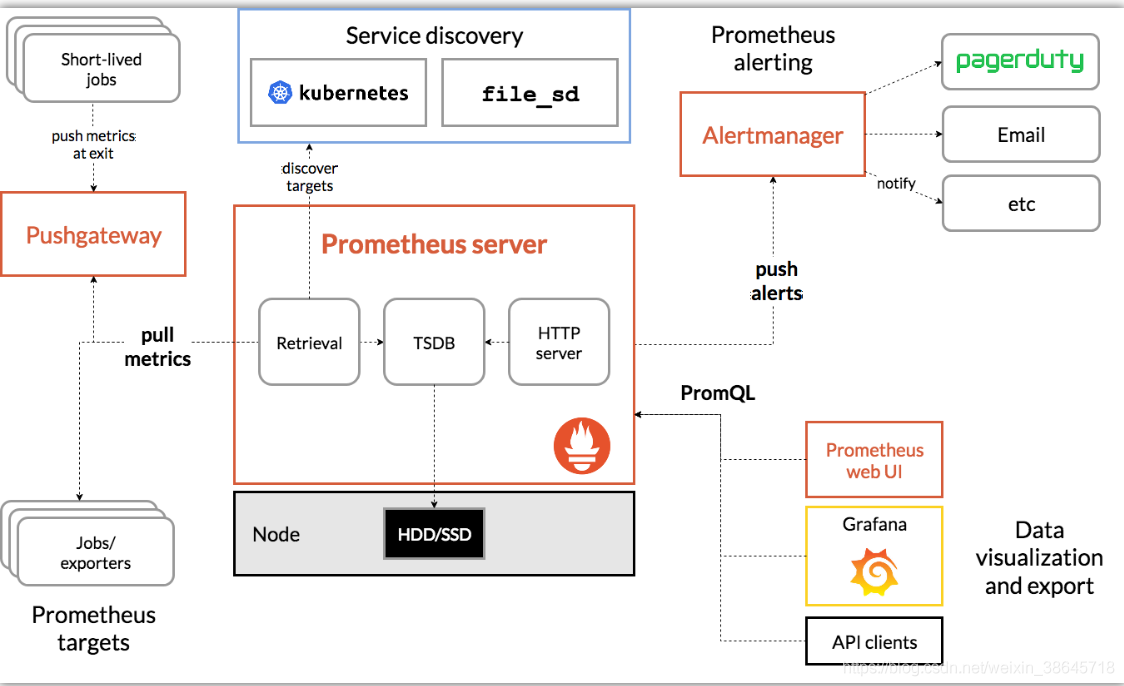
Prometheus 生态圈中包含了多个组件:
Prometheus Server: 根据配置完成数据采集, 服务发现以及数据存储。
Push Gateway : 为应对部分push场景提供的插件,监控数据先推送到 Push Gateway 上,然后再由 Prometheus Server 端采集 pull 。用于存在时间较短,可能在 Prometheus 来 pull 之前就消失了的 jobs (若 Prometheus Server 采集间隔期间,Push Gateway 上的数据没有变化, Prometheus Server 将采集到2次相同的数据,仅时间戳不同)
Exporters(探针): 是Prometheus的一类数据采集组件的总称。它负责从目标处搜集数据,并将其转化为Prometheus支持的格式。与传统的数据采集组件不同的是,它并不向中央服务器发送数据,而是等待中央服务器主动前来抓取。
Alertmanager: Prometheus server 主要负责根据基于PromQL的告警规则分析数据,如果满足PromQL定义的规则,则会产生一条告警,并发送告警信息到Alertmanager,Alertmanager则是根据配置处理告警信息并发送。常见的接收方式有:电子邮件,webhook 等。Alertmanager三种处理告警信息的方式:分组,抑制,静默。
开始演示
测试机器
prometheus-server 192.168.56.140
MySQL host01 192.168.56.103
MySQL host02 192.168.56.104
配置mysql host01
MySQL使用版本
8.0.25 MySQL Community Server
创建exporter帐号
mysqld_exporter通过查询mysql的状态表及状态命令获取数据。所以,需要先在mysql内,创建相应帐号
create user 'exporter'@'%' identified by 'Xiaopang*803';

GRANT REPLICATION CLIENT, PROCESS ON *.* TO 'exporter'@'%';

GRANT SELECT ON performance_schema.* TO 'exporter'@'%';

flush privileges;
下载,安装mysqld_exporter
wget https://github.com/prometheus/mysqld_exporter/releases/download/v0.13.0/mysqld_exporter-0.13.0.linux-amd64.tar.gz
tar xvzf mysqld_exporter-0.13.0.linux-amd64.tar.gz -C /usr/local/.
cd /usr/local && ln -s mysqld_exporter-0.13.0.linux-amd64/ mysqld_exporter
编缉如下文件,输入exporter用户句与密码(与前面mysql内创建的帐号密码一致)
[root@host01 mysqld_exporter]# vi .my.cnf
[client]
user=exporter
password=Xiaopang*803
添加启动服务文件
[root@host01 ~]# vi /etc/systemd/system/mysqld_exporter.service
[Unit]

Description=mysqld_exporter

After=network.target

[Service]

Type=simple

ExecStart=/usr/local/mysqld_exporter/mysqld_exporter --config.my-cnf=/usr/local/mysqld_exporter/.my.cnf

Restart=on-failure

[Install]

WantedBy=multi-user.target
启动mysqld_exporter
service mysqld_exporter start
测试验证
mysqld_exporter默认使用9104端口,我们可以在浏览器内输入如下地址。查看是否有数据输出。
输入 http://192.168.56.103:9104/metrics
输出信息类似如下
# HELP go_gc_duration_seconds A summary of the pause duration of garbage collection cycles.

# TYPE go_gc_duration_seconds summary

go_gc_duration_seconds{quantile="0"} 2.5395e-05

go_gc_duration_seconds{quantile="0.25"} 3.5372e-05

go_gc_duration_seconds{quantile="0.5"} 3.9393e-05

go_gc_duration_seconds{quantile="0.75"} 5.5068e-05

go_gc_duration_seconds{quantile="1"} 0.062537624

go_gc_duration_seconds_sum 0.453204071

go_gc_duration_seconds_count 2131

# HELP go_goroutines Number of goroutines that currently exist.

# TYPE go_goroutines gauge
下载,安装node_exporter
如果只安装mysqld_exporter则无法监控OS相关的数据,所以需要安装node_exporter进行OS监控。
wget https://github.com/prometheus/node_exporter/releases/download/v1.2.2/node_exporter-1.2.2.linux-amd64.tar.gz
tar xvzf node_exporter-1.2.2.linux-amd64.tar.gz -C /usr/local/.
cd /usr/local && ln -s node_exporter-1.2.2.linux-amd64/ node_exporter
添加启动服务文件
[root@host01 ~]# vi /etc/systemd/system/node_exporter.service
[Unit]

Description=node_export

Documentation=https://github.com/prometheus/node_exporter

After=network.target

[Service]

Type=simple

User=root

Group=root

ExecStart=/usr/local/node_exporter/node_exporter

Restart=on-failure

[Install]

WantedBy=multi-user.target
启动node_exporter
service node_exporter start
测试验证
node_exporter默认使用9100端口,我们可以在浏览器内输入如下地址。查看是否有数据输出。
输入 http://192.168.56.103:9100/metrics
输出结果类似如下
# HELP go_gc_duration_seconds A summary of the pause duration of garbage collection cycles.

# TYPE go_gc_duration_seconds summary

go_gc_duration_seconds{quantile="0"} 2.5934e-05

go_gc_duration_seconds{quantile="0.25"} 4.0072e-05

go_gc_duration_seconds{quantile="0.5"} 4.7616e-05

go_gc_duration_seconds{quantile="0.75"} 6.726e-05

go_gc_duration_seconds{quantile="1"} 0.228887598

go_gc_duration_seconds_sum 0.550266258

go_gc_duration_seconds_count 793

# HELP go_goroutines Number of goroutines that currently exist.

# TYPE go_goroutines gauge
安装prometheus+grafana
使用版本
prometheus 2.28
grafana 6.7.6
安装过程
下载软件包
wget https://github.com/prometheus/prometheus/releases/download/v2.28.1/prometheus-2.28.1.linux-amd64.tar.gz
解压并添加软链接
tar xvzf prometheus-2.28.1.linux-amd64.tar.gz -C /usr/local/.

cd /usr/local/

ln -s prometheus-2.28.1.linux-amd64/ prometheus
增加启动服务
[root@prometheus-server prometheus]# vi /etc/systemd/system/prometheus.service
[Unit]

Description=Prometheus Monitoring System

Documentation=Prometheus Monitoring System

[Service]

Type=simple

User=root

Group=root

ExecStart=/usr/local/prometheus/prometheus \

--config.file=/usr/local/prometheus/prometheus.yml \

--storage.tsdb.path="data/" \

--storage.tsdb.retention.time=15d \

--web.max-connections=512 \

--web.listen-address=:9090
添加mysql监控
vi /usr/local/prometheus/prometheus.yml
scrape_configs:
# The job name is added as a label `job=<job_name>` to any timeseries scraped from this config.
  - job_name: 'mysql'

    static_configs:

      - targets: ['192.168.56.103:9104']

        labels:

          instance: mysql_instance1

  - job_name: 'linux'

    static_configs:

      - targets: ['192.168.56.103:9100']

        labels:

          instance: mysql_instance1
启动prometheus
service prometheus start
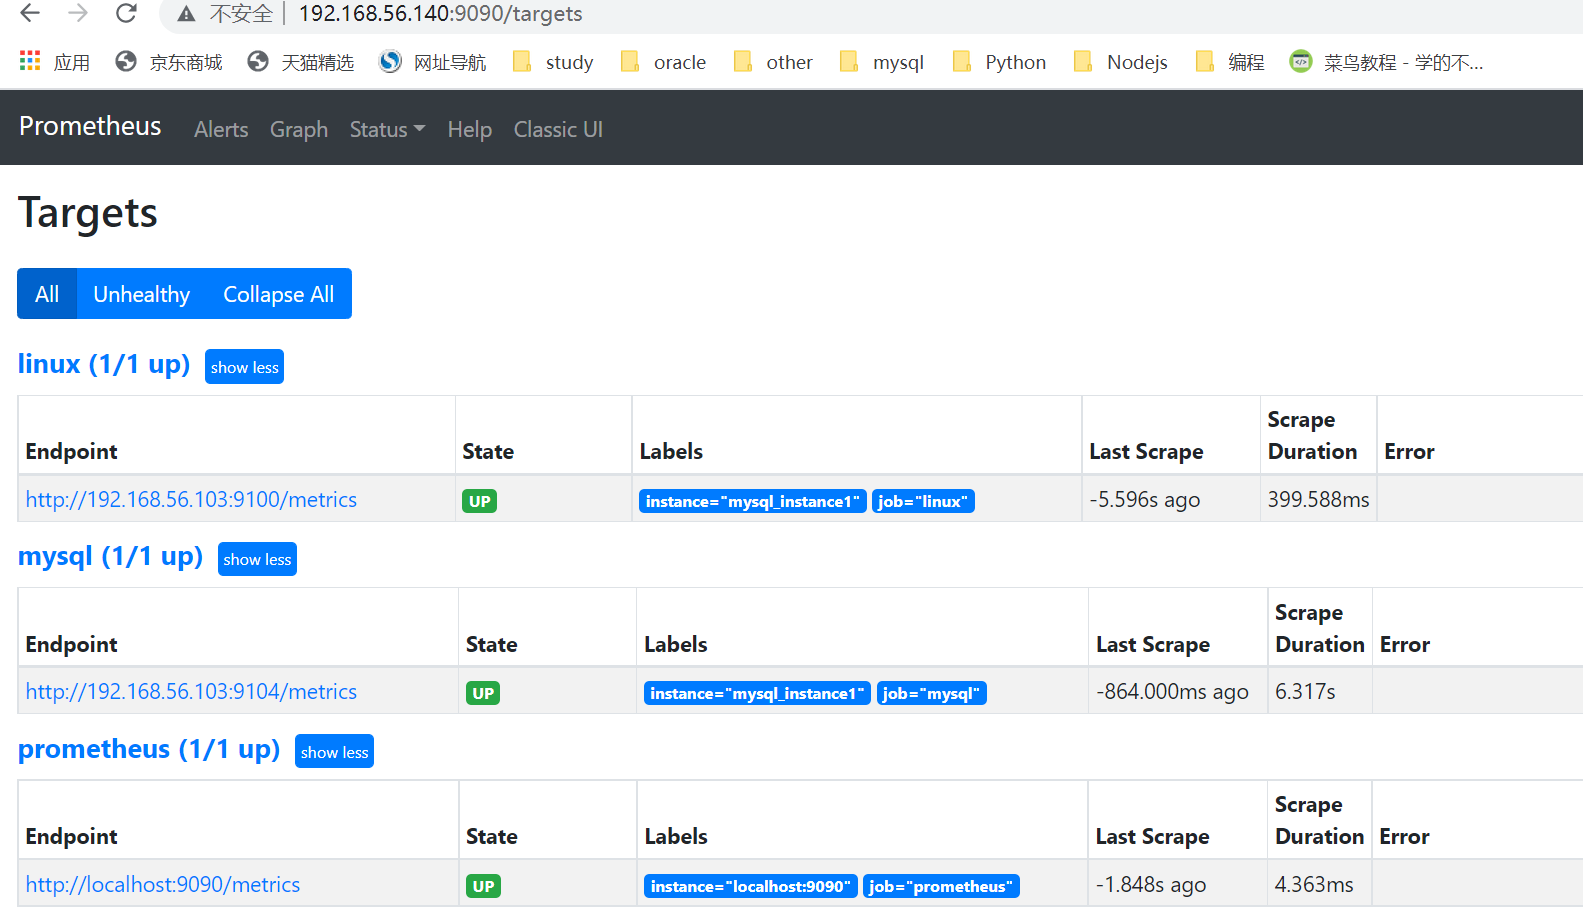
查看prometheus
prometheus默认监控端口
http://192.168.56.140:9090/
点击status->target。如果一切正常,可以看到如下mysql/linux的state为UP
下载,安装grafana
wget https://dl.grafana.com/oss/release/grafana-6.7.6-1.x86_64.rpm
rpm -ivh grafana-6.7.6-1.x86_64.rpm
访问grafana
prometheus的展示功能很弱,为了更好的进行图形展示,所以我们需要grafana
输入 http://192.168.56.140:3000/
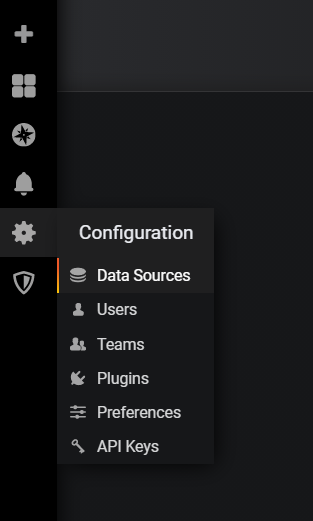
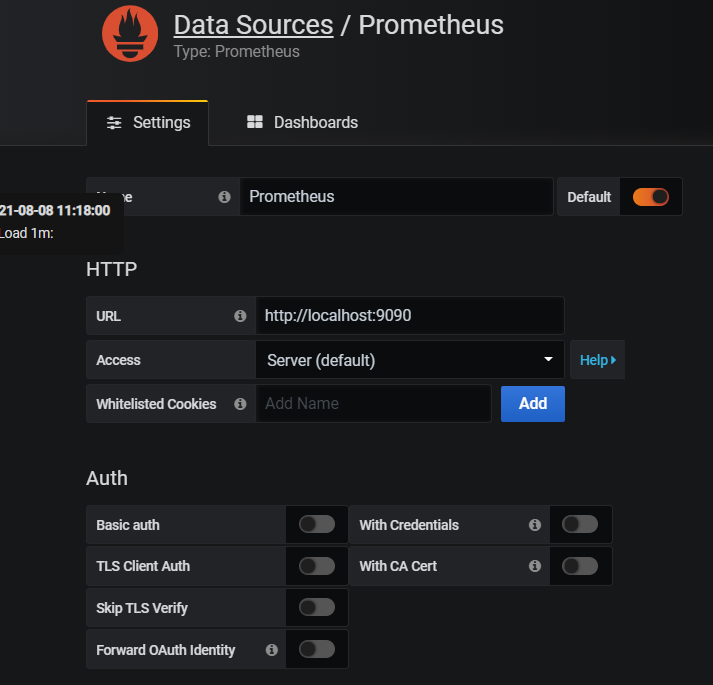
配置data source为proemtheus的HTTP链接(注意是HTTP,而不是HTTPS)
导入mysql监控模板
grafana数据的展示是通过模板实现的。grafana网站上面有很多共享的模板,你可以自行探索。
本例模板,我是从如下链接下载的。
https://grafana.com/api/dashboards/9623/revisions/4/download
版本不匹配问题
因为版本不太匹配的原因,完成后有些项目如法正常显示。它使用的版本是grafana5.0版本,我的是6.x版本。
但是这点小问题,难不倒我,我自己修改了一下。就能正常显示了,如下是修改后的JSON文件。
https://pan.baidu.com/s/1d8Nwdzn9_J9qAjHR44mM3w 提取码:abcd
修改过程
很多时候,很多东西并不完全能拿来即用。我们需要根据自己的需要进行一些修改。
接下来大概花了半个多小时,弄清楚了如何修改了。而后大概又花了两小时,修改完成的相应的项目。
修改过程中,碰到的问题,主要就两类:
1)grafana 5.x和6.x组件的名称发生了变化。
"Buffer Pool Size of Total RAM"无法正常显示,原因是6.0和5.0组件名不同。
替换 pmm-singlestat-panel -> singlestat搞定
2)exporter提取的属性名字发生了变化
我用的是node_exporter-1.2.2,这里面关于OS提取的属性与JSON文件的定义属性名不匹配。
方法是直接在“http://192.168.56.103:9100/metrics”里面搜索新的属性名,替换JSON文件里面的旧的属性名。
例如:
替换 node_memory_MemTotal->node_memory_MemTotal_bytes
替换 node_memory_MemTotal->node_memory_MemTotal_bytes
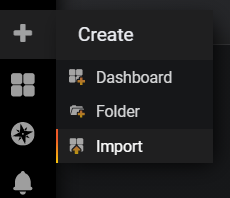
进行导入
因为我进行了一些修改,你可以import的时候,直接把JSON的内容输入进去。
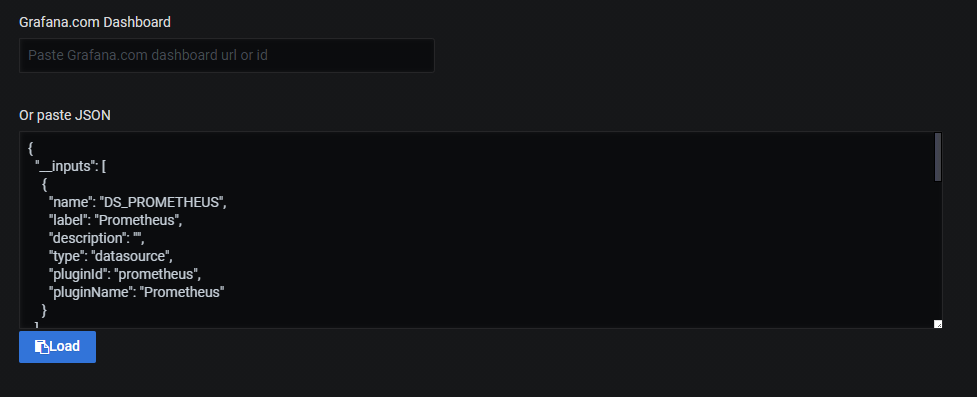
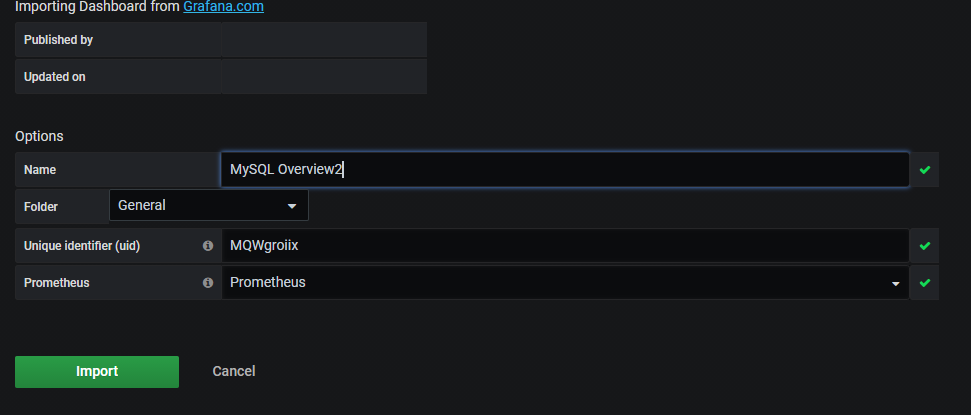
点击Load加载,接下来,选择数据源为prometheus。
启动sysbench压测工具
开启sysbench工具的目的是通过压测生成有数据变化的图表(不然,没有流量,数据也不会动)。
这里,我从远端压测(在另一台机器host02上运行sysbench)。目的是为了生成网络流量数据。
[root@host02 ~]# sysbench /usr/share/sysbench/oltp_read_write.lua --time=9180 --mysql-host=host01 --mysql-port=3306 --mysql-user=dbusr --mysql-password=Xiaopang*803 --mysql-db=db1 --table-size=50000 --tables=15 --threads=15 --report-interval=10 run

sysbench 1.0.20 (using bundled LuaJIT 2.1.0-beta2)

Running the test with following options:

Number of threads: 15

Report intermediate results every 10 second(s)

Initializing random number generator from current time

Initializing worker threads...

Threads started!

[ 10s ] thds: 15 tps: 112.68 qps: 2268.92 (r/w/o: 1589.76/452.30/226.85) lat (ms,95%): 277.21 err/s: 0.00 reconn/s: 0.00

[ 20s ] thds: 15 tps: 113.91 qps: 2282.81 (r/w/o: 1598.47/456.52/227.81) lat (ms,95%): 211.60 err/s: 0.00 reconn/s: 0.00

[ 30s ] thds: 15 tps: 109.80 qps: 2192.95 (r/w/o: 1536.66/436.69/219.59) lat (ms,95%): 240.02 err/s: 0.00 reconn/s: 0.00

[ 40s ] thds: 15 tps: 112.70 qps: 2265.36 (r/w/o: 1583.17/456.79/225.40) lat (ms,95%): 193.38 err/s: 0.00 reconn/s: 0.00

[ 50s ] thds: 15 tps: 101.00 qps: 2013.42 (r/w/o: 1413.32/398.10/202.00) lat (ms,95%): 325.98 err/s: 0.00 reconn/s: 0.00
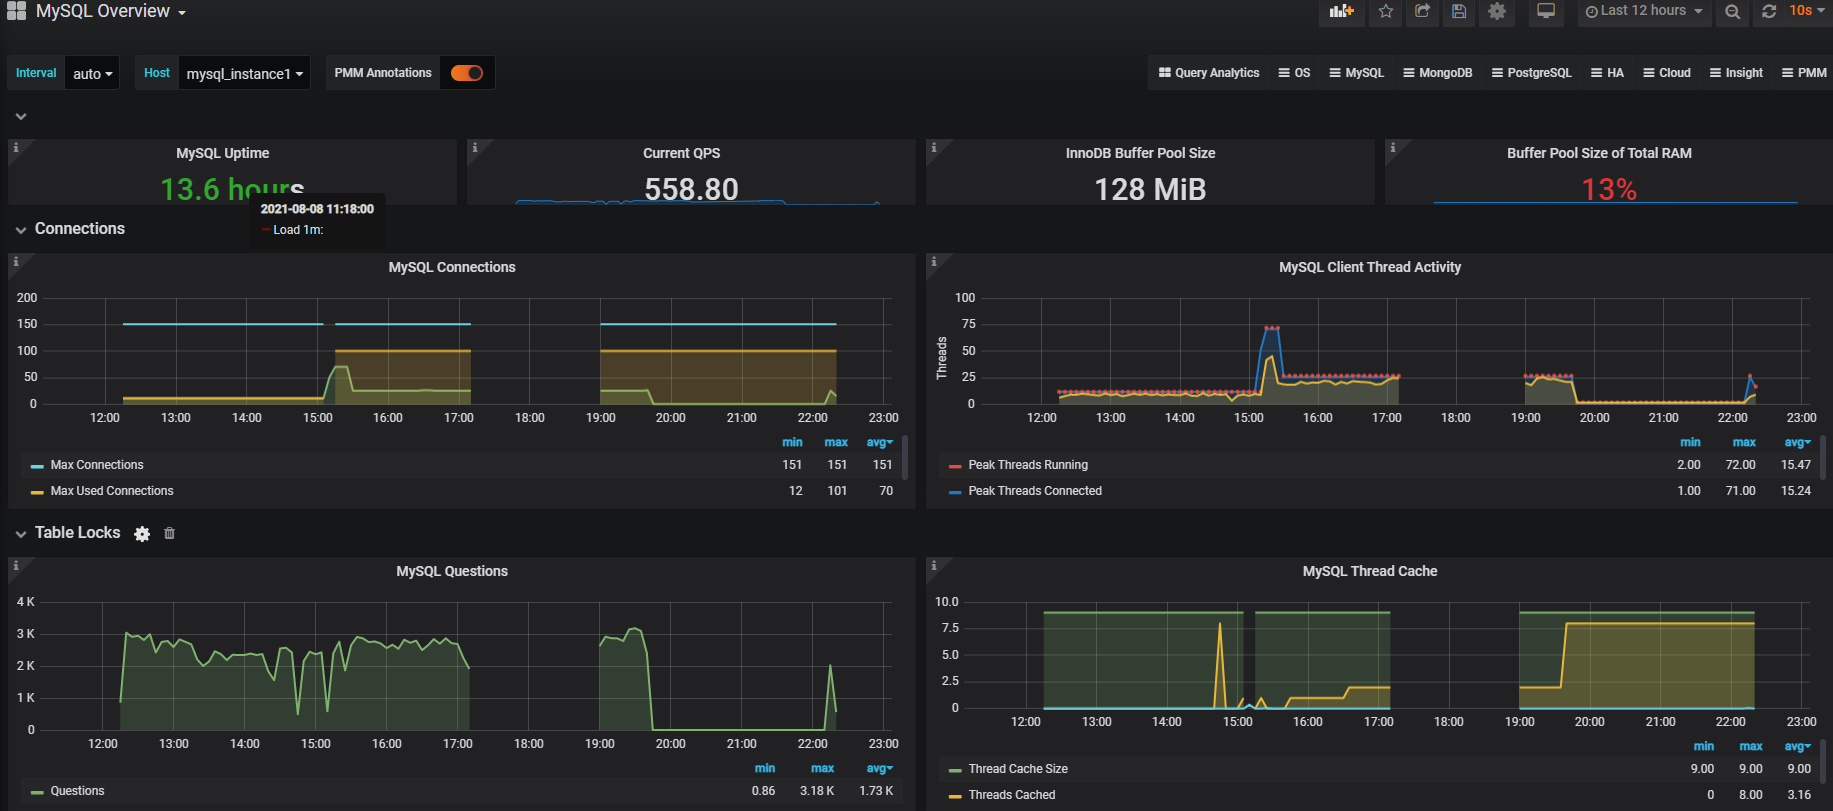
查看grafana,完成后效果
这里只贴出了部分图表。
MySQL信息展示
OS信息展示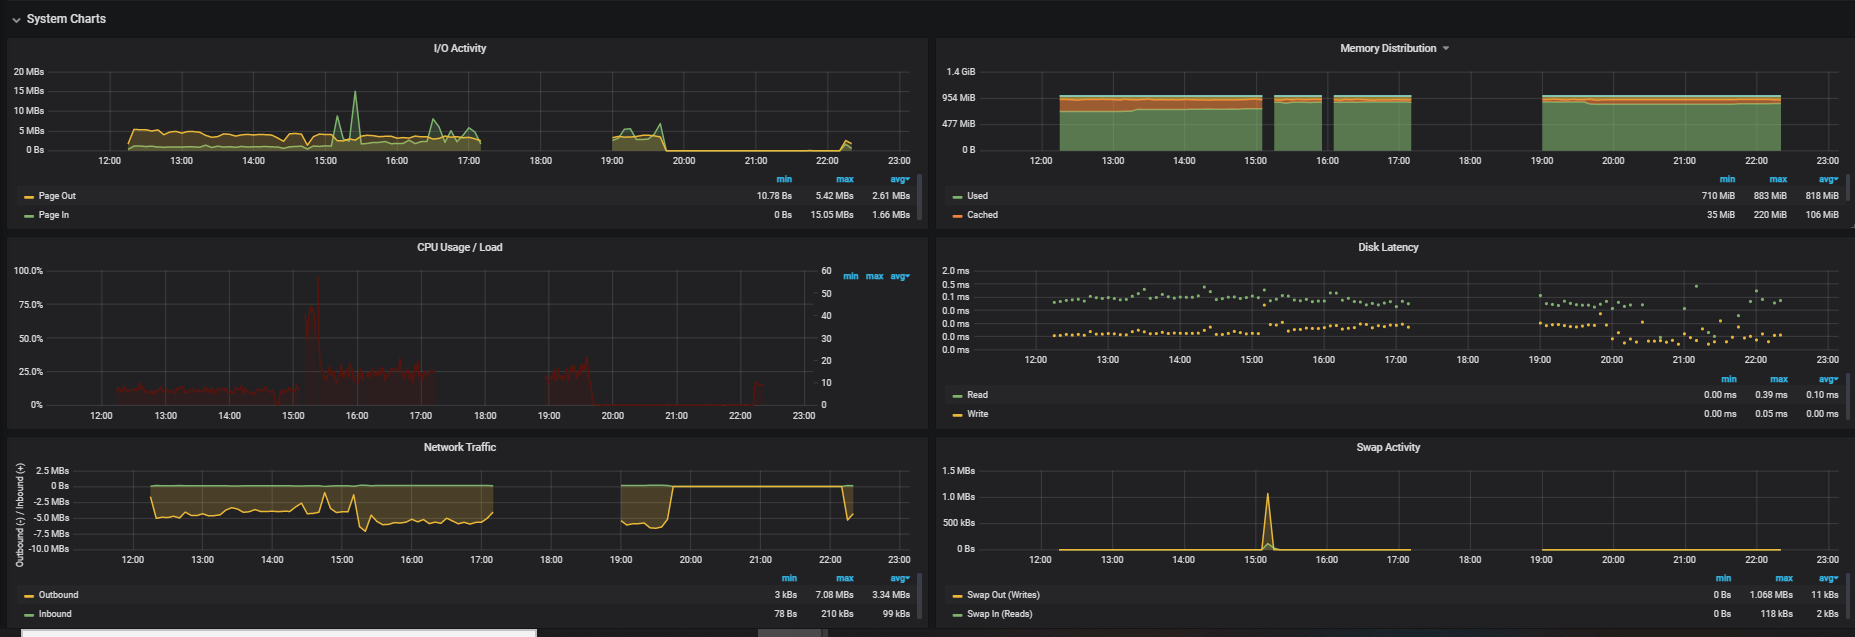
接下来
有空的时候,下一节我再给大家演示一下prometheus如何配置告警相关内容。
参考文档
https://grafana.com/grafana/https://prometheus.io/docs/introduction/overview/
https://blog.csdn.net/weixin_38645718/article/details/85111527
https://blog.51cto.com/u_1000682/2374386
https://blog.csdn.net/eastyell/article/details/112232691
Prometheus MySQL监控+grafana展示的更多相关文章
- Grafana+Prometheus系统监控之MySql
架构 grafana和prometheus之前安装配置过,见:Grafana+Prometheus打造全方位立体监控系统 MySql安装 MySql的地位和重要性就不言而喻了,作为开源产品深受广大中小 ...
- Prometheus+Grafana打造Mysql监控平台
prometheus/node_exporter/mysqld_exporter都是由go语言编写,需要先安装GoLang环境 下载node_exporter(监控服务器的CPU.内存.存储使用情况) ...
- Prometheus笔记(二)监控go项目实时给grafana展示
欢迎加入go语言学习交流群 636728449 Prometheus笔记(二)监控go项目实时给grafana展示 Prometheus笔记(一)metric type 文章目录 一.promethe ...
- [k8s]容器化node-expolore(9100)+cadvisor(8080)+prometheus(9090) metric搜集,grafana展示
Prometheus 的核心,多维数据模型 传统监控工具统计数据方式 指标多 - 需求1,统计app1-3,的(总)内存,则定义3个指标 container.memory_usage_bytes.we ...
- 手动部署 Docker+Grafana+Prometheus系统监控之Redis
监控规划图 使用Docker 创建两台Redis docker run -d --name redis1 redis docker run -d --name redis2 redis 查看redis ...
- 图文详解Prometheus监控+Grafana+Alertmanager告警安装使用
一:前言 一个服务上线了后,你想知道这个服务是否可用,需要监控.假如线上出故障了,你要先于顾客感知错误,你需要监控.还有对数据库,服务器的监控,等等各层面的监控. 近年来,微服务架构的流行,服务数越来 ...
- Grafana Prometheus系统监控Redis服务
Grafana Prometheus系统监控Redis服务 一.Grafana Prometheus系统监控Redis服务 1.1流程 1.2安装redis_exporter 1.3配置prometh ...
- 使用prometheus + granafa 监控mysql主从
若主从同步数据库未同步默认的mysql表,则也需要在从库上创建mysql用户mysqld_exporter用来收集监控数据 mysqld_exporter安装部署 这里采取的是mysqld_expor ...
- 【jmeter】基于InfluxDB&Grafana的JMeter实时性能测试数据的监控和展示
本文主要讲述如何利用JMeter监听器Backend Listener,配合使用InfluxDB+Grafana展示实时性能测试数据 关于JMeter实时测试数据 JMeter从2.11版本开始,命令 ...
随机推荐
- 详解Redis主从复制原理
文章首发于公众号 "蘑菇睡不着" 前言 Redis 的主从复制和 MySQL 差不多,主要起着 数据备份,读写分离等作用.所以说主从复制对 Redis 来说非常重要,而无论是面试还 ...
- Linux安装及管理程序
一,常见的软件包封装类型 二.RPM包管理工具 三.查询RPM软件包信息 四.安装.升级.卸载RPM软件包 五.解决软件包依赖关系的方法 六.源代码编译 七.安装yum源仓库 一,常见的软件包封装类型 ...
- 仅使用JsonUtility和File类实现Json数据读写
using System.Collections; using System.Collections.Generic; using UnityEngine; using System; using S ...
- Zabbix5.0微信报警
3.1.注测企业微信: 3.2.企业微信注册成功后进入后台管理: 3.3.添加一个部门,并记住部门id: #我这里添加的子部门ID为2 3.4.添加一个用户到上面创建的部门里面(这里采取直接将管理员添 ...
- Zabbix5.0钉钉报警(centos7)
2.1.到钉钉官网下载pc版钉钉,安装.注册.登陆: 钉钉下载地址:https://www.dingtalk.com/ 2.2.创建群聊和钉钉机器人: 1.创建群聊,把需要收到报警的人员都拉到这个群: ...
- Flask(1)- 简介
背景 为啥要学,很久之前就学过点,没写文章 最近因为要写机器人工具,其实就是简单的纯服务端工具 反正 flask 也挺简单,一天快速过完 概念会直接搬教程的,实操自己敲一遍再总结 参考教程 https ...
- 阿里云ECS问题 Login Incorrect , all available gssapi merchanisms failed
1.阿里云ECS无法登录 Login Incorrect 阿里云ECS密码包含2个密码: 1.重置密码(实例密码也就是我们SSH远程连接的密码): 2.修改远程连接密码(在阿里云网页控制台上远程连接的 ...
- buu [MRCTF2020]keyboard
密文: ooo yyy ii w uuu ee uuuu yyy uuuu y w uuu i i rr w i i rr rrr uuuu rrr uuuu t ii uuuu i w u rrr ...
- Jenkins集成SonarQube遇到的报错
Jenkins集成Sonar过程中遇到的报错 1.jenkins中无法添加sonarqube的token凭证 因为添加的凭证类型错误,所以无法添加token,类型应该选择"Secret te ...
- Python小白的数学建模课-B6. 新冠疫情 SEIR 改进模型
传染病的数学模型是数学建模中的典型问题,常见的传染病模型有 SI.SIR.SIRS.SEIR 模型. SEIR 模型考虑存在易感者.暴露者.患病者和康复者四类人群,适用于具有潜伏期.治愈后获得终身免疫 ...