
Prometheus笔记(二)监控go项目实时给grafana展示
欢迎加入go语言学习交流群 636728449
Prometheus笔记(二)监控go项目实时给grafana展示
Prometheus笔记(一)metric type
文章目录
一、prometheus和grafana安装
1、promethues安装
先写好配置文件,保存为prometheus.yml,
global:

  scrape_interval:     15s # By default, scrape targets every 15 seconds.

  # Attach these labels to any time series or alerts when communicating with

  # external systems (federation, remote storage, Alertmanager).

  external_labels:

    monitor: 'codelab-monitor'

# A scrape configuration containing exactly one endpoint to scrape:

# Here it's Prometheus itself.

scrape_configs:

  # The job name is added as a label `job=<job_name>` to any timeseries scraped from this config.

  - job_name: 'prometheus' //服务的名称,后续要监控我们自己的服务时只需要按照这个格式再添加上

    # Override the global default and scrape targets from this job every 5 seconds.

    scrape_interval: 5s

    static_configs:

      - targets: ['localhost:9090'] //这个为服务的ip和port
更多配置文件写法请参考:https://prometheus.io/docs/operating/configuration/
官方给出供参考的配置文件:https://github.com/prometheus/prometheus/blob/release-2.3/config/testdata/conf.good.yml
然后利用docker启动。
docker run -p 9090:9090 --network=host -v /root/prometheus.yml:/etc/prometheus/prometheus.yml prom/prometheus
启动之后,可以先测试一下是否可以用。
[root@localhost ~]# curl http://localhost:9090/api/v1/label/job/values

{

	"status":"success",

	"data":["prometheus"]

}
如果是用上面我给出来的默认配置,返回值应该是和这里给出来的一样。说明promethues服务端启动好了。
2、grafana安装
这篇文章只是演示基本用法,所以用到的grafana的配置都是默认的。直接使用下面的命令启动就可以了。
$ docker run -d -p 3000:3000 grafana/grafana
如果需要更多功能则需要更复杂的配置了,更多配置方法请参考:http://docs.grafana.org/installation/docker/
docker镜像起来后,用浏览器登入 127.0.0.0:3000 ,会弹出来登入界面,用户名和密码为admin/admin,第一次会提示修改密码,按照提示操作即可。这样就完成了安装。
二、获取监控数据
这一步我主要写一个简单的go项目,用来获取内存的实时使用率数据,然后在grafana展示。
代码下载地址:https://github.com/Zhanben/goproject/tree/master/gomemory
package main

import (

    "net/http"

    "log"

    "time"

    "os"

    "github.com/prometheus/client_golang/prometheus/promhttp"

    "github.com/prometheus/client_golang/prometheus"

    "github.com/shirou/gopsutil/mem"

)

func main (){

    //初始化日志服务

    logger := log.New(os.Stdout, "[Memory]", log.Lshortfile | log.Ldate | log.Ltime)

    //初始一个http handler

    http.Handle("/metrics", promhttp.Handler())

    //初始化一个容器

    diskPercent := prometheus.NewGaugeVec(prometheus.GaugeOpts{

            Name: "memeory_percent",

            Help: "memeory use percent",

        },

        []string {"percent"},

    )

    prometheus.MustRegister(diskPercent)

    // 启动web服务,监听1010端口

    go func() {

        logger.Println("ListenAndServe at:localhost:1010")

        err := http.ListenAndServe("localhost:1010", nil)

        if err != nil {

            logger.Fatal("ListenAndServe: ", err)

        }

    }()

    //收集内存使用的百分比

    for {

        logger.Println("start collect memory used percent!")

        v, err := mem.VirtualMemory()

        if err != nil {

            logger.Println("get memeory use percent error:%s", err)

        }

        usedPercent := v.UsedPercent

        logger.Println("get memeory use percent:", usedPercent)

        diskPercent.WithLabelValues("usedMemory").Set(usedPercent)

        time.Sleep(time.Second*2)

    }

}
程序跑起来的输出如下:
[root@localhost demoproject]# go run memory.go

[Memory]2018/07/14 11:43:12 memory.go:42: start collect memory used percent!

[Memory]2018/07/14 11:43:12 memory.go:48: get memeory use percent: 41.22097449562238

[Memory]2018/07/14 11:43:12 memory.go:33: ListenAndServe at:locahost:1010

[Memory]2018/07/14 11:43:14 memory.go:42: start collect memory used percent!

[Memory]2018/07/14 11:43:14 memory.go:48: get memeory use percent: 41.219733205342514

[Memory]2018/07/14 11:43:16 memory.go:42: start collect memory used percent!

[Memory]2018/07/14 11:43:16 memory.go:48: get memeory use percent: 41.219733205342514

^Csignal: interrupt
此时可以查询的到promethues监控到的数据。
[root@localhost ~]# curl http://localhost:1010/metrics

...

# HELP go_memstats_sys_bytes Number of bytes obtained by system. Sum of all system allocations.

# TYPE go_memstats_sys_bytes gauge

go_memstats_sys_bytes 3.346432e+06

//这个为代码添加的字段,其余为promethues默认监控字段

# HELP memeory_percent memeory use percent

# TYPE memeory_percent gauge

memeory_percent{percent="usedMemory"} 41.16718525016137

# HELP process_cpu_seconds_total Total user and system CPU time spent in seconds.

# TYPE process_cpu_seconds_total counter

process_cpu_seconds_total 0.01

....
三、配置grafana展示数据
1、修改配置重启promethues和grafana
先将监控服务注册到promethues服务端,修改配置文件:promethues.yml
... //和前面的配置文件一样

scrape_configs:

  # The job name is added as a label `job=<job_name>` to any timeseries scraped from this config.

  - job_name: 'memory' //给你的服务取的名字

    # Override the global default and scrape targets from this job every 5 seconds.

    scrape_interval: 5s

    static_configs:

      - targets: ['localhost:1010'] //改成你自己代码里面使用的端口号
暂停掉之前启动的promethues和grafana
[root@localhost ~]# docker ps

CONTAINER ID        IMAGE               COMMAND                  CREATED             STATUS              PORTS                    NAMES

650cb5891e56        grafana/grafana     "/run.sh"                19 hours ago        Up 19 hours         0.0.0.0:3000->3000/tcp   brave_ride

850a44d18dfe        prom/prometheus     "/bin/prometheus -..."   21 hours ago        Up 21 hours         0.0.0.0:9090->9090/tcp   zen_keller

[root@localhost ~]# docker stop 850a44d18dfe

850a44d18dfe

[root@localhost ~]# docker stop 650cb5891e56

650cb5891e56
修改好配置文件之后重新启动promethues和grafana
[root@localhost ~]#  docker run -d -p 9090:9090  --network=host -v /root/prometheus.yml:/etc/prometheus/prometheus.yml  prom/prometheus

[root@localhost ~]#   docker run -d -p 3000:3000 grafana/grafana
检验promethues服务端是否注册到了我们自己的服务。
[root@localhost demoproject]# curl http://localhost:9090/api/v1/targets

{

	"status": "success",

	"data": {

		"activeTargets": [{

				"discoveredLabels": {

					"__address__": "localhost:1010",

					"__metrics_path__": "/metrics",

					"__scheme__": "http",

					"job": "memory"

				},

				"labels": {

					"instance": "localhost:1010",

					"job": "memory"

					//这个memory即我们在promethues的配置文件填写的名字

				},

				"scrapeUrl": "http://localhost:1010/metrics",

				"lastError": "",

				"lastScrape": "2018-07-14T07:39:26.127284982Z",

				"health": "up"

				//注意上面这个字段要为up,要不然后续grafana查询不到数据

			}

		],

		"droppedTargets": []

	}

}
2、创建数据源
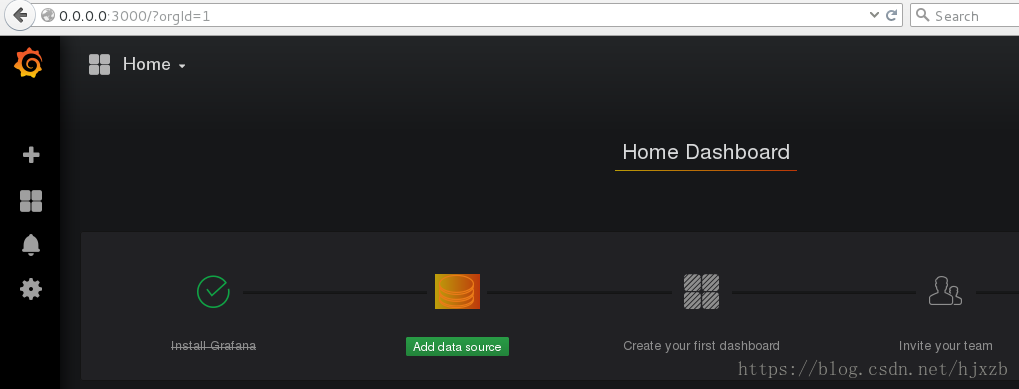
- 打开grafana界面,登入后如下图所示:
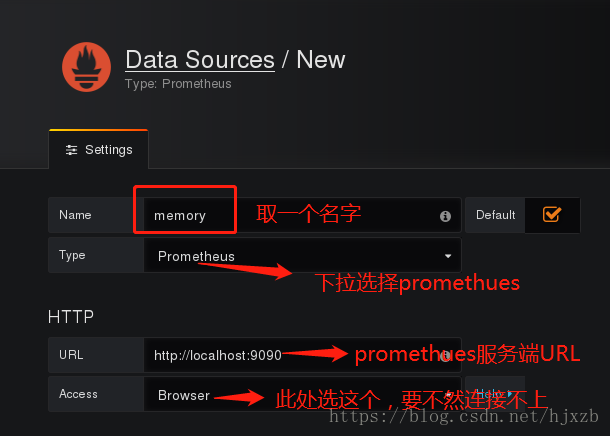
- 创建数据源
按照图片里面的填写的填好。其中memory为数据源名字,可以自己随便取一个。类型需要选择promethues。下面的URL需要填写promethues的服务端的URL,access选择不使用代理的Browser。填好之后点击下面的保存,完成创建数据源。
3、创建dashboard
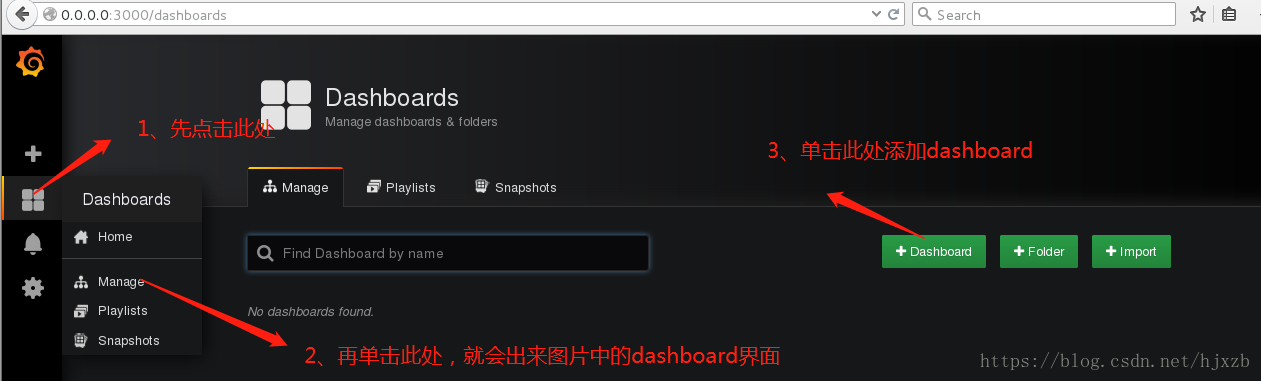
第一步如图所示,按照图中的三步操作。
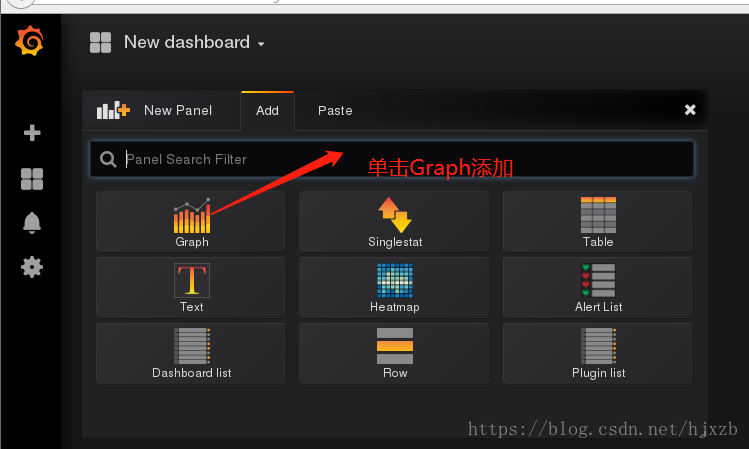
操作完成之后会进入下图所示的界面,然后再次按照图中提示操作即可。
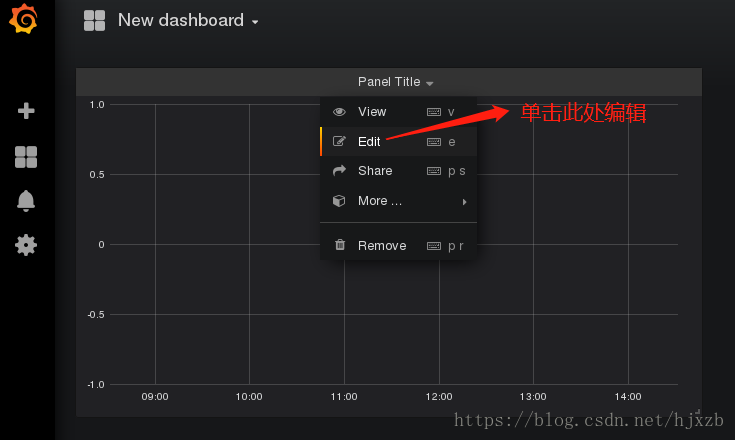
完成之后会弹出来一个panle,单击下拉框,点击Edit。
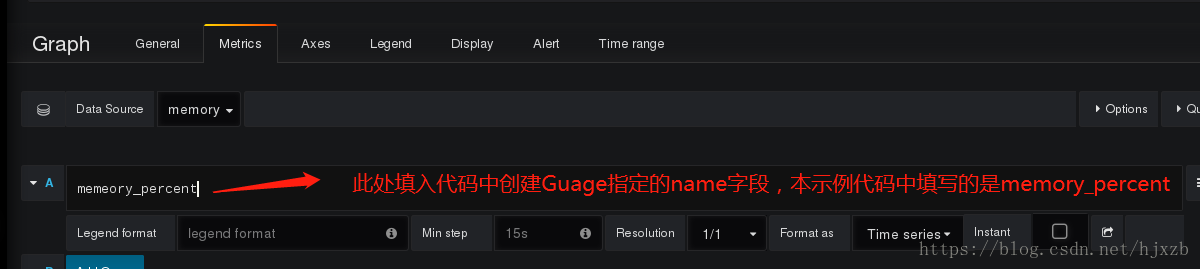
点击Edit之后会pane下方会得到下图展示的界面:
在查询字段的地方填入,代码缩写的字段prometheus.NewGaugeVec创建时填写的name字段,本示例代码为memory_percent。填好之后点击下option旁边的query inspector,就可以在上面的表中查看到数据了。
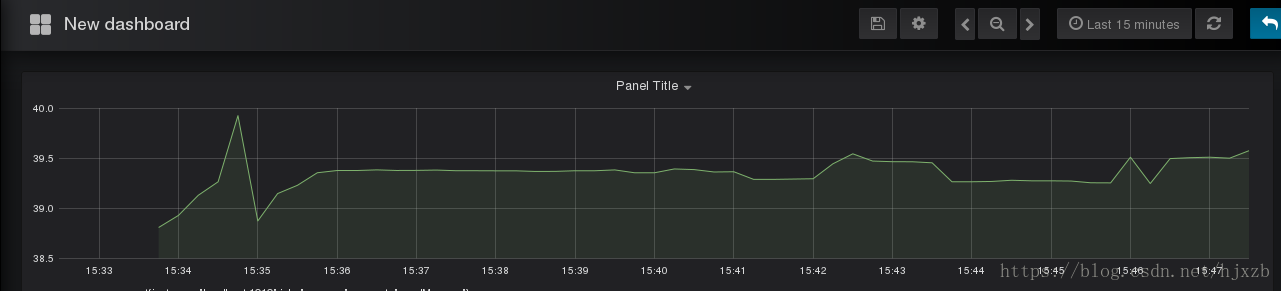
最后查询到的数据如下图所示:
欢迎加入go语言学习交流群 636728449
参考资料
1、 https://godoc.org/github.com/prometheus/client_golang/prometheus
2、 https://prometheus.io/docs/introduction/overview/
Prometheus笔记(二)监控go项目实时给grafana展示的更多相关文章
- python 学习笔记二十 django项目bbs论坛
项目:开发一个简单的BBS论坛 需求: 整体参考“抽屉新热榜” + “虎嗅网” 实现不同论坛版块 帖子列表展示 帖子评论数.点赞数展示 在线用户展示 允许登录用户发贴.评论.点赞 允许上传文件 帖子可 ...
- SpringCloud笔记二:搭建项目基础框架
目录 搭建框架 新建父工程 新建子工程api 新建子工程提供者provider 新建消费者consumer 总结 搭建框架 我们的SpringCloud微服务框架是父子工程,有一个父工程,剩下的都是子 ...
- Beego 学习笔记二:第一个项目
第一个MVC项目 1> 使用beego命令,创建一个项目 首先切换到创建项目的位置,输入bee new firstweb命令,创建成功之后会出现一个名为firstweb的文件夹 2> ...
- Prometheus笔记(一)metric type
欢迎加入go语言学习交流群 636728449 Prometheus笔记(二)监控go项目实时给grafana展示 Prometheus笔记(一)metric type 文章目录 Prometheus ...
- Prometheus监控学习笔记之360基于Prometheus的在线服务监控实践
0x00 初衷 最近参与的几个项目,无一例外对监控都有极强的要求,需要对项目中各组件进行详细监控,如服务端API的请求次数.响应时间.到达率.接口错误率.分布式存储中的集群IOPS.节点在线情况.偏移 ...
- amazeui学习笔记二(进阶开发1)--项目结构structure
amazeui学习笔记二(进阶开发1)--项目结构structure 一.总结 1.项目结构:是说的amazeui在github上面的项目结构,二次开发amazeui用 二.项目结构structure ...
- prometheus监控java项目(jvm等):k8s外、k8s内
前言 虽然可以使用jvisualvm之类的工具监控java项目,但是集群环境下,还是捉襟见肘,下面介绍如何用主流的prometheus来监控java项目. java项目配置 在pom.xml中添加依赖 ...
- Grafana+Prometheus通过node_exporter监控Linux服务器信息
Grafana+Prometheus通过node_exporter监控Linux服务器信息 一.Grafana+Prometheus通过node_exporter监控Linux服务器信息 1.1nod ...
- mysql颠覆实战笔记(二)-- 用户登录(一):唯一索引的妙用
版权声明:笔记整理者亡命小卒热爱自由,崇尚分享.但是本笔记源自www.jtthink.com(程序员在囧途)沈逸老师的<web级mysql颠覆实战课程 >.如需转载请尊重老师劳动,保留沈逸 ...
随机推荐
- Spring注解之@RestControllerAdvice
前言 前段时间部门搭建新系统,需要出异常后统一接口的返回格式,于是用到了Spring的注解@RestControllerAdvice.现在把此注解的用法总结一下. 用法 首先定义返回对象Respons ...
- PowerMock学习(一)之PoweMock的入门--模拟新增学生操作
关于powermock 在TDD领域Mock框架有很多,比如EasyMock,JMock,Mockito.可能有些同学会好奇了,为什么要重点把powermock拿出来呢,因为powermock可以解决 ...
- [SD卡] FPGA笔记之SD卡
1.数据怎么存进去的? 其中的sd_miso就是接收的1位数据,n个时钟下就收到n个数据,比如n=21. 2.如何做到先发送高位?
- Linux菜鸟——常见命令一 权限
Linux对文件和目录的权限位 权限位是十位 第一位 代表文件类型 - 普通文件 d 目录文件 l 链接文件 后面九尾 所有者权限 u = user 所属组权限 g = group 其他人权限 o = ...
- ubuntu 16.04 上使用pybind11进行C++和Python代码相互调用 | Interfacing C++ and Python with pybind11 on ubuntu 16.04
本文首发于个人博客https://kezunlin.me/post/a41adc1/,欢迎阅读! Interfacing C++ and Python with pybind11 on ubuntu ...
- 使用sklearn和caffe进行逻辑回归 | Brewing Logistic Regression then Going Deeper
原文首发于个人博客https://kezunlin.me/post/c50b0018/,欢迎阅读! Brewing Logistic Regression then Going Deeper. Bre ...
- convert svn repo to git
https://john.albin.net/git/convert-subversion-to-git 1. 抓取Log 在linux 上做的,其余是在win上做的. 2. svn co svn:/ ...
- 性能测试——记weblogic 连接池满无法链接故障诊断过程
记weblogic 连接池满无法链接故障诊断过程 前段时间公司负责建行的一个票据系统在,上线前几个分行试运行环境下,每天后台日志都会报oracle.jdbc.xa.OracleXAException, ...
- vue 学习 渲染、v-指令
vue渲染 在组件中data是一个方法里面的值要是一个对象return出去 export default { name: "HelloWorld", data() { return ...
- 2019-9-9:渗透测试,基础学习,pydictor使用,sql盲注,docker使用,笔记
pydictor,强大的密码生成工具,可以合并密码字典,词频统计,去重,枚举数字字典生成字典python3 pydictor.py -base d --len 4 4 生成纯数字4位密码python3 ...