WPFTookit Chart 入门
如何使用WPFToolKit Chart
private void button1_Click(object sender, EventArgs e)

{

    var s = new Series();

    s.ChartType = SeriesChartType.Line;

    var d = new DateTime(2013, 04, 01);

    s.Points.AddXY(d, 3);

    s.Points.AddXY(d.AddMonths(-1), 2);

    s.Points.AddXY(d.AddMonths(-2), 1);

    s.Points.AddXY(d.AddMonths(-3), 4);

    chart1.Series.Clear();

    chart1.Series.Add(s);

    chart1.Series[0].XValueType = ChartValueType.DateTime;

    chart1.ChartAreas[0].AxisX.LabelStyle.Format = "yyyy-MM-dd";

    chart1.ChartAreas[0].AxisX.Interval = 1;

    chart1.ChartAreas[0].AxisX.IntervalType = DateTimeIntervalType.Months;

    chart1.ChartAreas[0].AxisX.IntervalOffset = 1;

    chart1.Series[0].XValueType = ChartValueType.DateTime;

    DateTime minDate = new DateTime(2013, 01, 01).AddSeconds(-1);

    DateTime maxDate = new DateTime(2013, 05, 01); // or DateTime.Now;

    chart1.ChartAreas[0].AxisX.Minimum = minDate.ToOADate();

    chart1.ChartAreas[0].AxisX.Maximum = maxDate.ToOADate();

}
或者
<charting:Chart x:Name="chtSummary" Width="770" Height="400" Title="My Chart Title">

<charting:Chart.TitleStyle>

 <Style TargetType="datavis:Title">

 <Setter Property="FontSize" Value="28" />

 <Setter Property="FontFamily" Value="Arial" />

 <Setter Property="Margin" Value="5, 10, 5, 15" />

 </Style> </charting:Chart.TitleStyle>

 <charting:Chart.LegendStyle>

 <Style TargetType="datavis:Legend">

 <Setter Property="Width" Value="0" />

 </Style> </charting:Chart.LegendStyle>

 <charting:Chart.Series>

 <charting:BarSeries ItemsSource="{Binding}" DependentValuePath="Value" IndependentValuePath="Key" IsSelectionEnabled="True" >

 <charting:BarSeries.IndependentAxis>

 <charting:CategoryAxis Orientation="Y" AxisLabelStyle="{StaticResource SummaryChartAxisStyle}" />

 </charting:BarSeries.IndependentAxis>

 </charting:BarSeries>

 </charting:Chart.Series>

</charting:Chart>

<!-- See more at: http://mitchelsellers.com/blogs/2011/04/20/wpf-chart-styling-explained.aspx#sthash.EdMcBh2I.dpuf-->
隐藏Legend
隐藏Chart的Legend
<chartingToolkit:Chart.LegendStyle>

    <Style TargetType="Control">

        <Setter Property="Width" Value="0" />

        <Setter Property="Height" Value="0" />

    </Style>

</chartingToolkit:Chart.LegendStyle>
隐藏具体Item的legend
<charting:LineSeries.LegendItemStyle >

  <Style TargetType="{x:Type charting:LegendItem}">

     <Setter Property="Visibility" Value="Collapsed"/>

  </Style>

</charting:LineSeries.LegendItemStyle>
显示定义横纵坐标
<Grid Height="800">

        <chartingToolkit:Chart  Name="lineChart" Title="Pressure over Time"

    VerticalAlignment="Top" Margin="20,50,20,0" Height="500">

            <chartingToolkit:Chart.Axes>

                <chartingToolkit:LinearAxis Title="Pressure" Orientation="Y" Interval="100" />

                <chartingToolkit:LinearAxis Title="Time" Orientation="X" Interval="100" />

            </chartingToolkit:Chart.Axes>

            <chartingToolkit:LineSeries DependentValuePath="Value" IndependentValuePath="Key" ItemsSource="{Binding}"  Name="Test"

                                        IsSelectionEnabled="True" ClipToBounds="False">

            </chartingToolkit:LineSeries>        </chartingToolkit:Chart>

        <Button Width="100" Height="24" Margin="20,556,1058,220" Content="More" Name="Button1" />

    </Grid>
修改横纵坐标
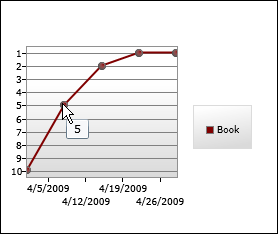
坐标值倒序排列
public class InverterConverter : IValueConverter

{

    public object Convert(object value, Type targetType, object parameter, CultureInfo culture)

    {

        if (value is int)

        {

            return -(int)value;

        }

        throw new NotImplementedException();

    }

    public object ConvertBack(object value, Type targetType, object parameter, CultureInfo culture)

    {

        throw new NotImplementedException();

    }

}
<charting:Chart

    FontSize="9">

    <charting:LineSeries

        ItemsSource="{Binding}"

        DependentValueBinding="{Binding Place, Converter={StaticResource InverterConverter}}"

        IndependentValuePath="Date"

        Title="Book">

        <charting:LineSeries.DataPointStyle>

            <Style TargetType="charting:LineDataPoint">

                <Setter Property="Background" Value="Maroon"/>

                <Setter Property="DependentValueStringFormat" Value="{}{0:0.#;0.#}"/>

            </Style>

        </charting:LineSeries.DataPointStyle>

        <charting:LineSeries.DependentRangeAxis>

            <charting:LinearAxis

                Orientation="Y"

                Minimum="-10.5"

                Maximum="-0.5"

                Interval="1"

                ShowGridLines="True">

                <charting:LinearAxis.AxisLabelStyle>

                    <Style TargetType="charting:AxisLabel">

                        <Setter Property="StringFormat" Value="{}{0:0.#;0.#}"/>

                    </Style>

                </charting:LinearAxis.AxisLabelStyle>

            </charting:LinearAxis>

        </charting:LineSeries.DependentRangeAxis>

    </charting:LineSeries>

</charting:Chart>
参考 http://dlaa.me/blog/post/9607895
修改ToolTips
<ToolTipService.ToolTip>

    <StackPanel>

        <ContentControl

            Content="Custom ToolTip"

            FontWeight="Bold"/>

        <ContentControl

            Content="{TemplateBinding FormattedDependentValue}"/>

    </StackPanel>

</ToolTipService.ToolTip>
http://dlaa.me/blog/post/9631686
参考
My new home page, extended [Updated collection of great Silverlight and WPF Charting resources!]
WPFTookit Chart 入门的更多相关文章
- WPFTookit Chart 高级进阶
数据源增加SeriesSource 使用方式 <Charting:Chart x:Name="chart" Helper:ChartHelper.DependentValue ...
- c# Winform Chart入门
额外参考链接:http://www.cnblogs.com/greenerycn/archive/2008/10/27/microsoft-chart.html winform 仪表盘相关下载链接:/ ...
- [转帖]从入门到实践:创作一个自己的 Helm Chart
从入门到实践:创作一个自己的 Helm Chart https://www.cnblogs.com/alisystemsoftware/p/11436469.html 自己已经搭建好了 helm 和t ...
- Winform & Devexpress Chart使用入门
一.Chart(Winform) 使用图表控件(chart)首先要理解图表区域(ChartArea).XY轴(AxisX.AxisY).数据点(Series).标题(Title).图例(Legend) ...
- [转]Chart.js入门教程
Chart.js是一个简单.面向对象.为设计者和开发者准备的图表绘制工具库. 相信大部分人都一样,看到一大筐用文本或者表格形式呈现的数据就头疼.因为这种呈现方式也太无聊了吧...而且这对于我们处理原始 ...
- Chart.js入门教程
Chart.js是一个简单.面向对象.为设计者和开发者准备的图表绘制工具库. 相信大部分人都一样,看到一大筐用文本或者表格形式呈现的数据就头疼.因为这种呈现方式也太无聊了吧...而且这对于我们处理原始 ...
- 从入门到实践:创作一个自己的 Helm Chart
前言 我们平时在日常生活中会经常在不同的平台上与各种各样的应用打交道,比如从苹果的 App Store 里下载的淘宝.高德.支付宝等应用,或者是在 PC 端安装的 Word.Photoshop.Ste ...
- 可能是史上最强大的js图表库——ECharts带你入门
PS:之前的那篇博客Highcharts——让你的网页上图表画的飞起 ,评论中,花儿笑弯了腰 和 StanZhai 两位仁兄让我试试 ECharts ,去主页看到<Why ECharts ?&g ...
- 给深度学习入门者的Python快速教程 - numpy和Matplotlib篇
始终无法有效把word排版好的粘贴过来,排版更佳版本请见知乎文章: https://zhuanlan.zhihu.com/p/24309547 实在搞不定博客园的排版,排版更佳的版本在: 给深度学习入 ...
随机推荐
- Win10 UWP系列:更新UWP时注意的问题——TargetDeviceFamily
前几天把CurrencyExchanger提交到微软参加Master认证,结果没有通过,反馈了一些错误,看来微软检查还是比较仔细的. 错误主要有: Visual feedback helps user ...
- win7设置wifi热点
netsh wlan set hostednetwork mode=allow ssid=名字 key=大于等于8位密码 net wlan start hostednetwork ---------- ...
- spring-stutrs求解答
这里贴上applicationContext里的代码: <?xml version="1.0" encoding="UTF-8"?> <bea ...
- 【新技术】CentOS系统下docker的安装配置及使用详解
1 docker简介 Docker 提供了一个可以运行你的应用程序的封套(envelope),或者说容器.它原本是dotCloud 启动的一个业余项目,并在前些时候开源了.它吸引了大量的关注和讨 ...
- svg.js教程及使用手册详解(一)
做毕设的时候,因为要使用到画图和自定义动画,所以接触到了SVG.网上关于SVG和Canvas的对比很多,具体的辨析这里就不赘言.网上关于SVG的所谓教程基本上都是SVG本身,但是却没有一个针对svg. ...
- 自己动手写ORM的感受
之前看到奋斗前辈和时不我待前辈的自己动手写ORM系列博客,感觉讲解的通俗易懂,清晰透彻.作为一个菜鸟,闲来也想着自己写一个ORM,一来加深自己对 ORM的理解,以求对EF,NHibernate等ROM ...
- CSS3与页面布局学习笔记(六)——CSS3新特性(阴影、动画、渐变、变形( transform)、透明、伪元素等)
一.阴影 1.1.文字阴影 text-shadow<length>①: 第1个长度值用来设置对象的阴影水平偏移值.可以为负值 <length>②: 第2个长度值用来设置对象的阴 ...
- 【特别推荐】小伙伴们惊呆了!8个超炫的 Web 效果
CodePen 是一个在线的 HTML.CSS 和 JavaScript 代码编辑器,能够编写代码并即时预览效果.你在上面可以在线展示自己的作品,也可以看到其他人在网页中实现的各种令人惊奇的效果. 今 ...
- 使用 Sticky-Kit 实现基于 jQuery 的元素固定效果
元素固定效果在网页中应用得很多,比较常见的使用场景有改进导航,显示广告.Sticky-Kit 是一个非常方便的 jQuery 插件,简化了创建/管理粘元素,有复杂的使用功能.这些功能包括:处理多个固定 ...
- 纯CSS打造好看的按钮样式
好看的按钮.链接.div样式,效果预览: http://hovertree.com/code/run/css/s8o19792.html 发现今天积分和排名不错: 代码如下: <!DOCTYPE ...