mysql性能监控工具:mycheckpoint的使用方法
mycheckpoint 是针对mysql的一个性能监控、指标采集的python写成的工具。
工作原理说明:
mycheckpoint是一段脚本,通过将其设置为crontab定时任务,每几分钟采集一次数据(受限于crontab只能是分钟为基本单位)存储在自己的数据库中,并可以将采集的数据进行统计,以web页面的形式展现出来。
示例效果:

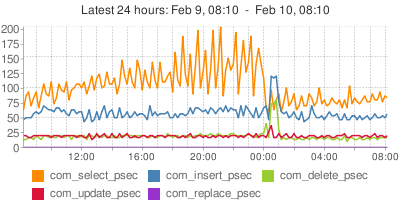
详细请参见:http://code.openark.org/forge/mycheckpoint
使用步骤:
0. 下载:
wget https://mycheckpoint.googlecode.com/files/mycheckpoint-231.tar.gz
1. 为mycheckpoint创建数据库
CREATE DATABASE mycheckpoint;
2. 授权给当前登录mysql的用户
GRANT ALL PRIVILEGES ON mycheckpoint.* TO 'root'@'localhost' IDENTIFIED BY 'xxxx';
3. 创建mycheckpoint需要的数据库表。
mycheckpoint --host=127.0.0.1 --port= --user=root --password=xxxx --socket=/mysql/tmp/mysql.sock --database=mycheckpoint
进过这一个步骤之后,会在名为:mycheckpoint数据库中,生成以下数据表。
+------------------------------------+

| Tables_in_mycheckpoint             |

+------------------------------------+

| alert                              |

| alert_condition                    |

| alert_condition_query_view         |

| alert_email_message_items_view     |

| alert_pending                      |

| alert_pending_html_view            |

| alert_pending_view                 |

| alert_view                         |

| charts_api                         |

| custom_query                       |

| custom_query_top_navigation_view   |

| custom_query_view                  |

| html_components                    |

| metadata                           |

| numbers                            |

| status_variables                   |

| status_variables_aggregated_day    |

| status_variables_aggregated_hour   |

| sv_custom_chart_day                |

| sv_custom_chart_flattened_day      |

| sv_custom_chart_flattened_hour     |

| sv_custom_chart_flattened_sample   |

| sv_custom_chart_hour               |

| sv_custom_chart_sample             |

| sv_custom_html                     |

| sv_custom_html_brief               |

| sv_day                             |

| sv_diff                            |

| sv_hour                            |

| sv_latest                          |

| sv_param_change                    |

| sv_parameter_change_union          |

| sv_report_24_7                     |

| sv_report_24_7_minmax              |

| sv_report_chart_24_7               |

| sv_report_chart_day                |

| sv_report_chart_day_labels         |

| sv_report_chart_day_timeseries     |

| sv_report_chart_hour               |

| sv_report_chart_hour_labels        |

| sv_report_chart_hour_timeseries    |

| sv_report_chart_sample             |

| sv_report_chart_sample_labels      |

| sv_report_chart_sample_timeseries  |

| sv_report_day                      |

| sv_report_day_recent               |

| sv_report_day_recent_minmax        |

| sv_report_hour                     |

| sv_report_hour_recent              |

| sv_report_hour_recent_minmax       |

| sv_report_html                     |

| sv_report_html_24_7                |

| sv_report_html_brief               |

| sv_report_human_day                |

| sv_report_human_hour               |

| sv_report_human_sample             |

| sv_report_sample                   |

| sv_report_sample_recent            |

| sv_report_sample_recent_aggregated |

| sv_report_sample_recent_minmax     |

| sv_sample                          |

+------------------------------------+
如果意外将你的web app 的DB指定成了log数据库,则会在你的web app DB中加入以上数据表,并将原web app DB中重名的数据表删除。这将是灾难性的!
4. 将mycheckpoint配置成定时任务
* * * * * /usr/local/bin/mycheckpoint --user=root --password=xxxx --socket=/redmine/mysql/tmp/mysql.sock --database=mycheckpoint
5. http方式查看结果:
mycheckpoint --host=127.0.0.1 --port= --user=root --password=xxxx --socket=/mysql/tmp/mysql.sock --database=mycheckpoint http
指定数据库时需注意,切莫使用你的web app 的DB.
一个小时之后就可以打开本地的http://localhost:12306/mycheckpoint 查看报表。
点评:
这个工具的优势是能将数据统计结果以web形式展现,但是由于其依赖crontab,导致数据采集间隔过大,不能很好的描述mysql的运行状况, 另外,此工具已经于2014年4月停止更新。
其它的mysql第三方工具还有: percona-toolkit / mysqltuner.pl / tuning-primer.sh 等。
参考:
1. http://code.openark.org/forge/mycheckpoint
2. https://code.google.com/p/mycheckpoint/downloads/list
mysql性能监控工具:mycheckpoint的使用方法的更多相关文章
- mysql性能的检查和调优方法
mysql性能的检查和调优方法 发布时间:2009 年 10 月 4 日 发布者: OurMySQL 来源:sudone.com 才被阅读:3,524 次 才1条评论 我一直是使用my ...
- MySQL性能监控工具-Spotlight on MySQL
原文地址:http://blog.csdn.net/k_scott/article/details/8167018 这是我的第二款用于监控MySQL数据库性能的工具:Spotlight on MySQ ...
- mysql性能监控工具Innotop
mysql监控管理工具--innotop 1.innotop安装参考官网:http://innotop.googlecode.com/svn/html/installing.html # wget h ...
- mysql性能监控工具
参考文档: http://www.linuxidc.com/Linux/2012-09/70459.htm 1.记录慢查询SQL #配置开启 (linux)修改my.cnf: log-slow-que ...
- MySQL性能监控工具-MONyog
1.登录配置界面 2.show processlist 查看当前使用的进程 3.警告建议你应该优化哪些参数. 4.介绍一下慢查询的配置,其它的可以自己配置,都是简单的英文. 该工具,用着还不错.其 ...
- Mysql 性能优化2 系统参数配置方法 和 文件系统
--------------------------------------------目录------------------------------------------------- • 关于 ...
- redmine在linux上的mysql性能优化方法与问题排查方案
iredmine的linux服务器mysql性能优化方法与问题排查方案 问题定位: 客户端工具: 1. 浏览器inspect-tool的network timing工具分析 2. 浏览 ...
- MySQL实时性能监控工具doDBA tools
doDBA tools是什么? doDBA tools是一个基于控制台的远程监控工具,它不需要在本地/远程系统上安装任何软件,它可以实时收集操作系统.MySQL.InnoDB的实时性能状态数据,并可以 ...
- <转>MySQL性能调优的10个方法
文章原地址:http://mp.weixin.qq.com/s/oRXJRz_Y5drmIrcbxSKOcw 1. 选择合适的存储引擎: InnoDB 除非你的数据表使用来做只读或者全文检索 (相信现 ...
随机推荐
- 关于在xml文件中的 error: invalid symbol: 'switch' 错误
在xml布局文件中使用Switch控件时,出现error: invalid symbol: 'switch'报错,代码如下: <Switch android:id="@+id/swit ...
- 在Openfire中使用自己的数据表之修改系统属性
通过修改Openfire安装目录的conf/openfire目录下是openfire.xml文件可以使用我们自定义的认证集成以及用户数据集成.其实仔细观察之后,在修改完配置文件再次启动openfire ...
- beetle 2.7海量消息广播测试
由于client资源限制,只进行了300物体互动广播测试:物体活动频率是每秒20次,服务器每秒转发的消息量大概180W条. 转发消息结构: class Po : IMessage { public i ...
- 作业七:团队项目——Alpha版本冲刺阶段-06
昨天进展:代码编写. 今天安排:代码编写.
- [异常] MyEclipse Deploy点不开 An internal error occurred during: "Launching MVC on Tomcat 6.x". java.lang.NullPointerException
>_<" 今天做struts时,工程写好了,可是点击MyEclipse上面的Delopy不会跳出常规的窗口,导致各种坑~ >_<" 如果直接运行还出现下面的 ...
- jenkins 插件Copy Artifacts + Artifacts to copy
问题及遇到的错误: Unable to access upstream artifacts area /var/lib/jenkins/jobs/PROJECTNAME-Master-Branch/b ...
- Gradle的属性设置大全
Gradle作为一款项目构建工具,由于其强大.灵活.快速.完全兼容Ant等特性,越来越受到人们欢迎.Gradle的灵活有时候也会引起人们的困惑.比如在Gradle中设置变量和属性就有N种办法.由于Gr ...
- 为什么不能把委托(delegate)放在一个接口(interface)当中?
stackoverflow上有人问,为什么不能把委托放在一个接口当中? 投票最多的第一个答案第一句话说,“A Delegate is just another type, so you don't g ...
- 1121 if条件语句练习--输入年月日判断执行
<script type="text/javascript"> var a=prompt("请输入一个年","请输入年份"); ...
- atitit.技术选型方法总结为什么java就是比.net有前途
atitit.技术选型方法总结为什么java就是比.net有前途 #----按照不同的需要有不铜的法... 一般有开发效率,稳定性上的需要.. 作者 老哇的爪子 Attilax 艾龙, EMAIL: ...