Matplotlib 图表的样式参数
1.
import numpy as np
import pandas as pd
import matplotlib.pyplot as plt
% matplotlib inline
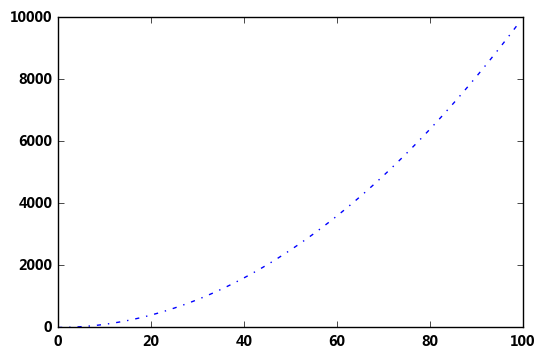
# 导入相关模块 # linestyle参数 plt.plot([i**2 for i in range(100)],
linestyle = '-.') #不用设置的时候默认为直线‘-’
# '-' solid line style
# '--' dashed line style
# '-.' dash-dot line style
# ':' dotted line style
输出:
[<matplotlib.lines.Line2D at 0x1e1348c8550>]
2.
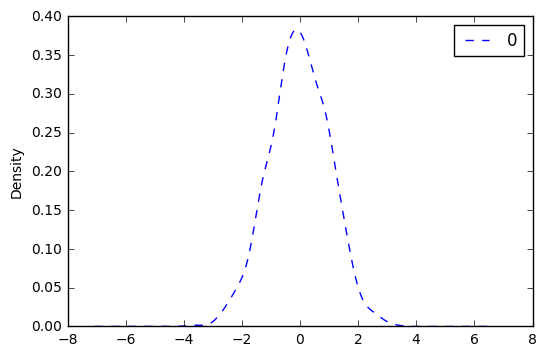
df = pd.DataFrame(np.random.randn(1000))

df.plot(kind = 'kde',linestyle = '--')  #绘制密度图

df.hist()  #绘制直方图
输出:
array([[<matplotlib.axes._subplots.AxesSubplot object at 0x00000185B8B0ADA0>]], dtype=object)

3.
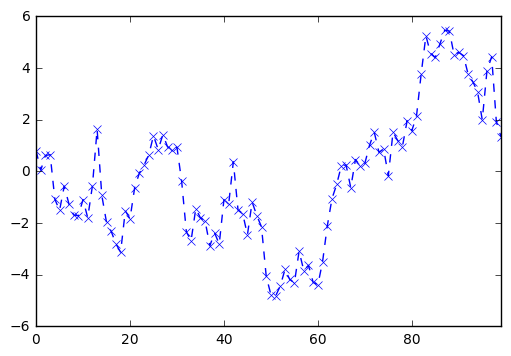
# marker参数

s = pd.Series(np.random.randn(100).cumsum())

s.plot(linestyle = '--',linewidth = 1,

      marker = 'x')  #图中点的风格设置  默认为‘.’ linwidth为线宽 即线的粗细

# '.'       point marker

# ','       pixel marker

# 'o'       circle marker

# 'v'       triangle_down marker

# '^'       triangle_up marker

# '<'       triangle_left marker

# '>'       triangle_right marker

# '1'       tri_down marker

# '2'       tri_up marker

# '3'       tri_left marker

# '4'       tri_right marker

# 's'       square marker

# 'p'       pentagon marker

# '*'       star marker

# 'h'       hexagon1 marker

# 'H'       hexagon2 marker

# '+'       plus marker

# 'x'       x marker

# 'D'       diamond marker

# 'd'       thin_diamond marker

# '|'       vline marker

# '_'       hline marker
输出:
<matplotlib.axes._subplots.AxesSubplot at 0x185b8faed30>
5.
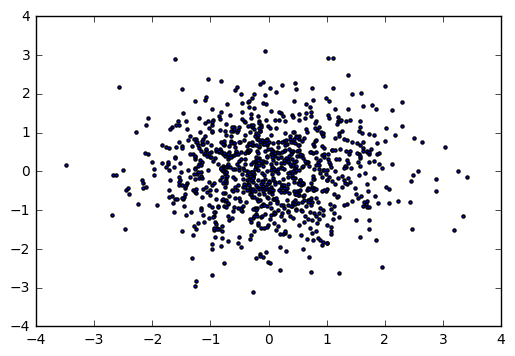
x = np.random.randn(1000)

y = np.random.randn(1000)

plt.scatter(x,y,marker = '.')
输出:
6.
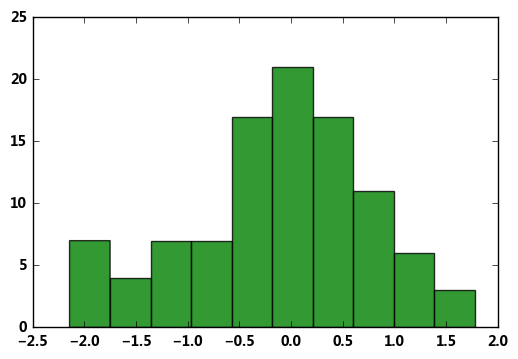
# color参数

plt.hist(np.random.randn(100),

        color = 'g',alpha = 0.8)

# alpha:0-1,透明度

# 常用颜色简写:red-r, green-g, black-k, blue-b, yellow-y

df = pd.DataFrame(np.random.randn(1000, 4),columns=list('ABCD'))

df = df.cumsum()

df.plot(style = '--.',alpha = 0.8,colormap = 'GnBu')

# colormap:颜色板,包括:

# Accent, Accent_r, Blues, Blues_r, BrBG, BrBG_r, BuGn, BuGn_r, BuPu, BuPu_r, CMRmap, CMRmap_r, Dark2, Dark2_r, GnBu, GnBu_r, Greens, Greens_r,

# Greys, Greys_r, OrRd, OrRd_r, Oranges, Oranges_r, PRGn, PRGn_r, Paired, Paired_r, Pastel1, Pastel1_r, Pastel2, Pastel2_r, PiYG, PiYG_r,

# PuBu, PuBuGn, PuBuGn_r, PuBu_r, PuOr, PuOr_r, PuRd, PuRd_r, Purples, Purples_r, RdBu, RdBu_r, RdGy, RdGy_r, RdPu, RdPu_r, RdYlBu, RdYlBu_r,

# RdYlGn, RdYlGn_r, Reds, Reds_r, Set1, Set1_r, Set2, Set2_r, Set3, Set3_r, Spectral, Spectral_r, Wistia, Wistia_r, YlGn, YlGnBu, YlGnBu_r,

# YlGn_r, YlOrBr, YlOrBr_r, YlOrRd, YlOrRd_r, afmhot, afmhot_r, autumn, autumn_r, binary, binary_r, bone, bone_r, brg, brg_r, bwr, bwr_r,

# cool, cool_r, coolwarm, coolwarm_r, copper, copper_r, cubehelix, cubehelix_r, flag, flag_r, gist_earth, gist_earth_r, gist_gray, gist_gray_r,

# gist_heat, gist_heat_r, gist_ncar, gist_ncar_r, gist_rainbow, gist_rainbow_r, gist_stern, gist_stern_r, gist_yarg, gist_yarg_r, gnuplot,

# gnuplot2, gnuplot2_r, gnuplot_r, gray, gray_r, hot, hot_r, hsv, hsv_r, inferno, inferno_r, jet, jet_r, magma, magma_r, nipy_spectral,

# nipy_spectral_r, ocean, ocean_r, pink, pink_r, plasma, plasma_r, prism, prism_r, rainbow, rainbow_r, seismic, seismic_r, spectral,

# spectral_r ,spring, spring_r, summer, summer_r, terrain, terrain_r, viridis, viridis_r, winter, winter_r

# 其他参数见“颜色参数.docx”
输出:
<matplotlib.axes._subplots.AxesSubplot at 0x1e135dac4a8>

6.
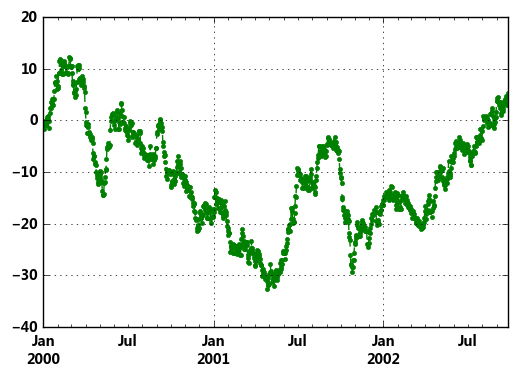
# style参数,可以包含linestyle,marker,color

ts = pd.Series(np.random.randn(1000).cumsum(), index=pd.date_range('1/1/2000', periods=1000))

ts.plot(style = '--g.',grid = True)

# style → 风格字符串,这里包括了linestyle(-),marker(.),color(g)

# plot()内也有grid参数
输出:
<matplotlib.axes._subplots.AxesSubplot at 0x1e135e04fd0>
7.
# 整体风格样式

import matplotlib.style as psl

print(plt.style.available)

# 查看样式列表

psl.use('ggplot')

ts = pd.Series(np.random.randn(1000).cumsum(), index=pd.date_range('1/1/2000', periods=1000))

ts.plot(style = '--g.',grid = True,figsize=(10,6))

# 一旦选用样式后,所有图表都会有样式,重启后才能关掉
输出:
['seaborn-paper', 'seaborn-deep', 'fivethirtyeight', 'seaborn-pastel', 'dark_background',
'seaborn-bright', 'seaborn-ticks', 'seaborn-notebook', 'classic', 'seaborn-white',
'grayscale', 'seaborn-muted', 'seaborn-darkgrid', 'seaborn-dark', 'seaborn-talk',
 'seaborn-colorblind', 'seaborn-dark-palette', 'ggplot', 'seaborn-whitegrid', 'seaborn-poster', 'bmh']
<matplotlib.axes._subplots.AxesSubplot at 0x1e134aef940>

Matplotlib 图表的样式参数的更多相关文章
- 05. Matplotlib 1 |图表基本元素| 样式参数| 刻度 注释| 子图
1.Matplotlib简介及图表窗口 Matplotlib → 一个python版的matlab绘图接口,以2D为主,支持python.numpy.pandas基本数据结构,运营高效且有较丰富的图表 ...
- Matplotlib 图表的基本参数设置
1.图名,图例,轴标签,轴边界,轴刻度,轴刻度标签 # 图名,图例,轴标签,轴边界,轴刻度,轴刻度标签等 df = pd.DataFrame(np.random.rand(10,2),columns= ...
- 一行代码让matplotlib图表变高大上
1 简介 matplotlib作为Python生态中最流行的数据可视化框架,虽然功能非常强大,但默认样式比较简陋,想要制作具有简洁商务风格的图表往往需要编写众多的代码来调整各种参数. 而今天要为大家介 ...
- matplotlib图表介绍
Matplotlib 是一个python 的绘图库,主要用于生成2D图表. 常用到的是matplotlib中的pyplot,导入方式import matplotlib.pyplot as plt 一. ...
- matplotlib中plt.scatter()参数详解
scatter(x, y, s=None, c=None, marker=None, cmap=None, norm=None, vmin=None, vmax=None, alpha=None, l ...
- [Python] Matplotlib 图表的绘制和美化技巧
目录 在一张画布中绘制多个图表 加图表元素 气泡图 组合图 直方图 雷达图 树状图 箱形图 玫瑰图 在一张画布中绘制多个图表 Matplotlib模块在绘制图表时,默认先建立一张画布,然后在画布中显示 ...
- Matplotlib 图表绘制工具学习笔记
import numpy as np import matplotlib.pyplot as plt import pandas as pd arr1 = np.random.rand(10)#一维数 ...
- Python tkinter库将matplotlib图表显示在GUI窗口上,并实时更新刷新数据
代码 1 ''' 2 使用matplotlib创建图表,并显示在tk窗口 3 ''' 4 import matplotlib.pyplot as plt 5 from matplotlib.pylab ...
- 07. Matplotlib 3 |表格样式| 显示控制
1.表格样式创建 表格视觉样式:Dataframe.style → 返回pandas.Styler对象的属性,具有格式化和显示Dataframe的有用方法 样式创建:① Styler.applymap ...
随机推荐
- hadoop使用
hadoop@ubuntu:~$ cd hadoop-2.0.5-alpha/ hadoop@ubuntu:~/hadoop-2.0.5-alpha$ ls hadoop@ubuntu:~/hadoo ...
- May 21st 2017 Week 21st Sunday
The smallest deed is better than the greatest intention. 最微小的行动胜过最伟大的打算. Several years ago, just aft ...
- 解决Myeclipse报PermGen space异常的问题
最近使用eclipse做开发,使用的服务器是tomcat,但在启动时报了Caused by: java.lang.OutOfMemoryError: PermGen space的异常. 这个错误很常见 ...
- 用一个实际例子理解Docker volume工作原理
要了解Docker Volume,首先我们需要理解Docker文件系统的工作原理.Docker镜像是由多个文件系统的只读层叠加而成.当一个容器通过命令docker run启动时,Docker会加载只读 ...
- userdel
功能说明:用于删除指定的用户及该用户相关的文件. 参数选项:-f 强制删除用户,即使用户当前已登录.-r 删除用户的同时,删除与用户相关的所有文件. 说明:尽量不要用userdel删除用户,而是采用在 ...
- “标准查询运算符”是组成语言集成查询 (LINQ) 模式的方法
“标准查询运算符”是组成语言集成查询 (LINQ) 模式的方法.大多数这些方法都在序列上运行,其中的序列是一个对象,其类型实现了IEnumerable<T> 接口或 IQueryable& ...
- html常见元素和理解
html常见元素分为两类,一类是header区的元素,一类是body区的元素 header区元素: meta title style link scipt base 里面包括像meta,title,s ...
- MR中使用sequnceFIle输入文件
转换原始数据为块压缩的SequenceFIle import org.apache.hadoop.conf.Configuration; import org.apache.hadoop.conf.C ...
- Mysql之inner join,left join,right join详解
首先借用官方的解释下: inner join(等值连接):只返回两个表中联结字段相等的行: left join(左联接):返回包括左表中的所有记录和右表中联结字段相等的记录: right join(右 ...
- android 网络技术基础学习 (七)
使用httpclient协议访问网络: public class MainActivity extends Activity implements OnClickListener{ public vo ...