
基本的传染病模型:SI、SIS、SIR及其Python代码实现
本文主要参考博客:http://chengjunwang.com/en/2013/08/learn-basic-epidemic-models-with-python/。该博客有一些笔误,并且有些地方表述不准确,推荐大家阅读Albert-Laszlo Barabasi写得书Network Science,大家可以在如下网站直接阅读传染病模型这一章:http://barabasi.com/networksciencebook/chapter/10#contact-networks。Barabasi是一位复杂网络科学领域非常厉害的学者,大家也可以在他的官网上查看作者的一些相关工作。
下面我就直接把SIS模型和SIR模型的代码放上来一起学习一下。我的Python版本是3.6.1,使用的IDE是Anaconda3。Anaconda3这个IDE我个人推荐使用,用起来很方便,而且提供了Jupyther Notebook这个很好的交互工具,大家可以尝试一下,可在官网下载:https://www.continuum.io/downloads/。
在Barabasi写得书中,有两个Hypothesis:1,Compartmentalization; 2, Homogenous Mixing。具体看教材。
默认条件:1, closed population; 2, no births; 3, no deaths; 4, no migrations.
1. SI model
 # -*- coding: utf-8 -*-

 import scipy.integrate as spi

 import numpy as np

 import pylab as pl

 beta=1.4247

 """the likelihood that the disease will be transmitted from an infected to a susceptible

 individual in a unit time is β"""

 gamma=0

 #gamma is the recovery rate and in SI model, gamma equals zero

 I0=1e-6

 #I0 is the initial fraction of infected individuals

 ND=70

 #ND is the total time step

 TS=1.0

 INPUT = (1.0-I0, I0)

 def diff_eqs(INP,t):

     '''The main set of equations'''

     Y=np.zeros((2))

     V = INP

     Y[0] = - beta * V[0] * V[1] + gamma * V[1]

     Y[1] = beta * V[0] * V[1] - gamma * V[1]

     return Y   # For odeint

 t_start = 0.0; t_end = ND; t_inc = TS

 t_range = np.arange(t_start, t_end+t_inc, t_inc)

 RES = spi.odeint(diff_eqs,INPUT,t_range)

 """RES is the result of fraction of susceptibles and infectious individuals at each time step respectively"""

 print(RES)

 #Ploting

 pl.plot(RES[:,0], '-bs', label='Susceptibles')

 pl.plot(RES[:,1], '-ro', label='Infectious')

 pl.legend(loc=0)

 pl.title('SI epidemic without births or deaths')

 pl.xlabel('Time')

 pl.ylabel('Susceptibles and Infectious')

 pl.savefig('2.5-SI-high.png', dpi=900) # This does increase the resolution.

 pl.show()
结果如下图所示
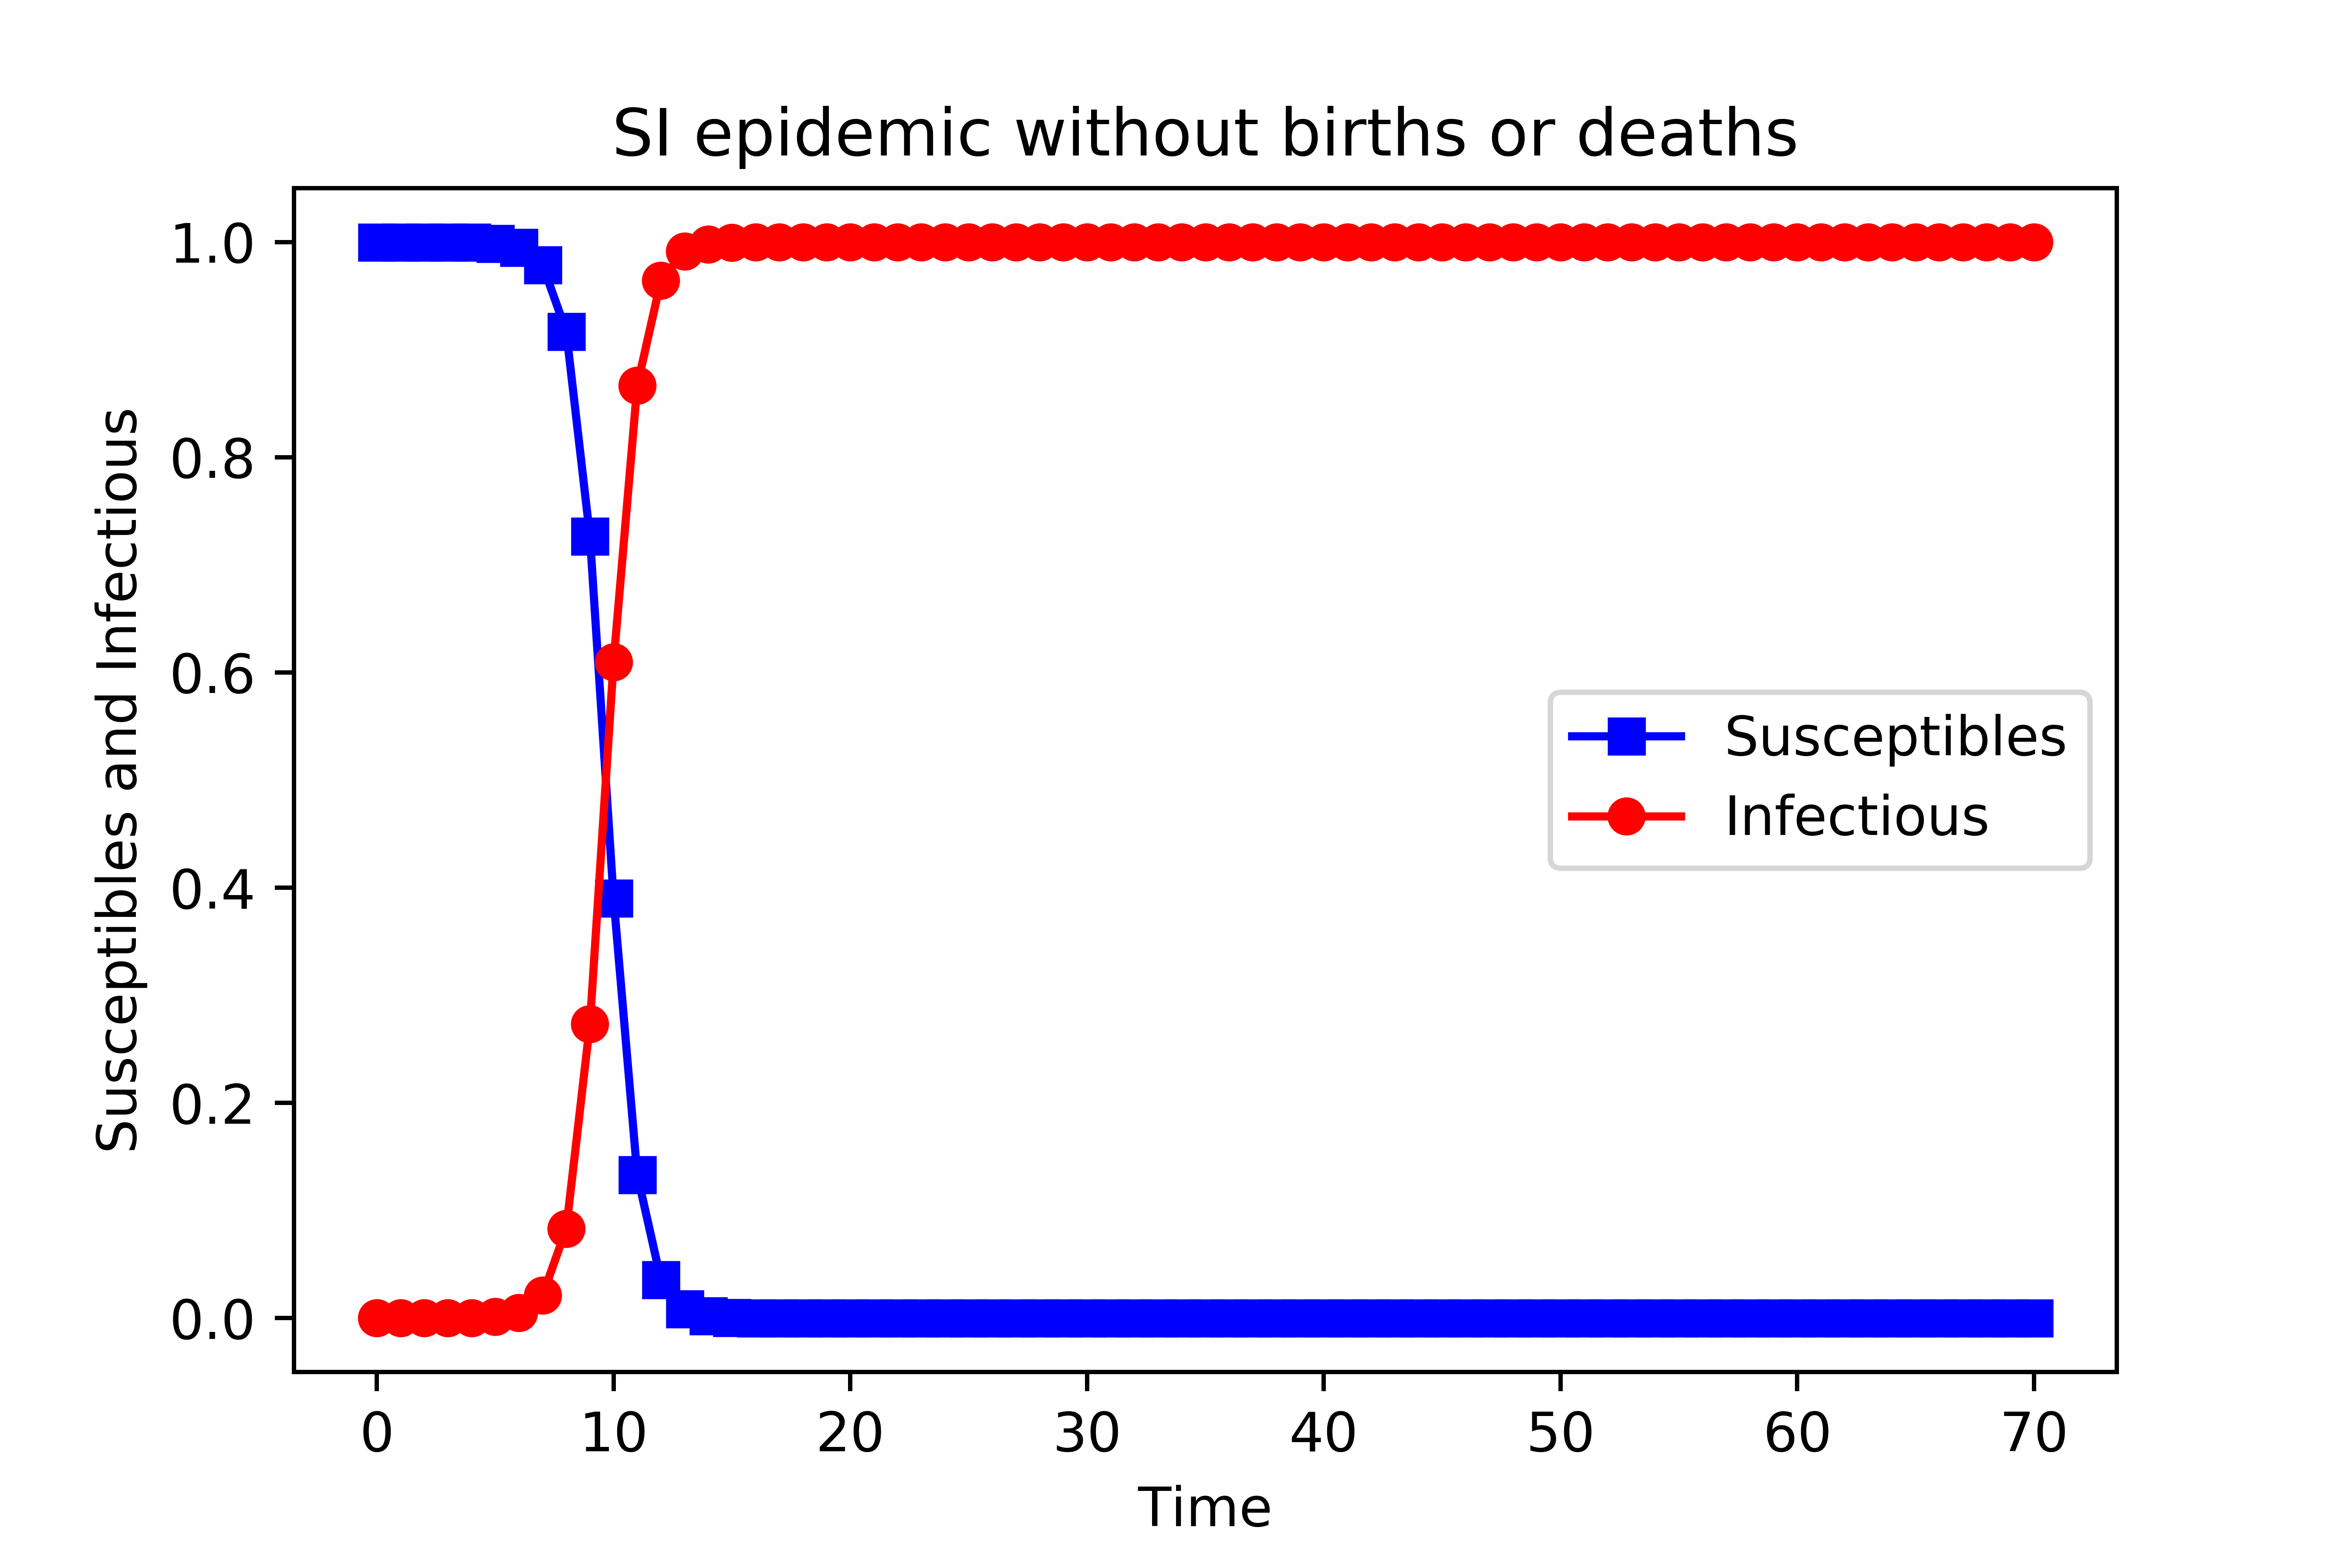
在早期,受感染个体的比例呈指数增长, 最终这个封闭群体中的每个人都会被感染,大概在t=16时,群体中所有个体都被感染了。
2. SIS model
 # -*- coding: utf-8 -*-

 import scipy.integrate as spi

 import numpy as np

 import pylab as pl

 beta=1.4247

 gamma=0.14286

 I0=1e-6

 ND=70

 TS=1.0

 INPUT = (1.0-I0, I0)

 def diff_eqs(INP,t):

     '''The main set of equations'''

     Y=np.zeros((2))

     V = INP

     Y[0] = - beta * V[0] * V[1] + gamma * V[1]

     Y[1] = beta * V[0] * V[1] - gamma * V[1]

     return Y   # For odeint

 t_start = 0.0; t_end = ND; t_inc = TS

 t_range = np.arange(t_start, t_end+t_inc, t_inc)

 RES = spi.odeint(diff_eqs,INPUT,t_range)

 print(RES)

 #Ploting

 pl.plot(RES[:,0], '-bs', label='Susceptibles')

 pl.plot(RES[:,1], '-ro', label='Infectious')

 pl.legend(loc=0)

 pl.title('SIS epidemic without births or deaths')

 pl.xlabel('Time')

 pl.ylabel('Susceptibles and Infectious')

 pl.savefig('2.5-SIS-high.png', dpi=900) # This does increase the resolution.

 pl.show()
运行之后得到结果如下图:
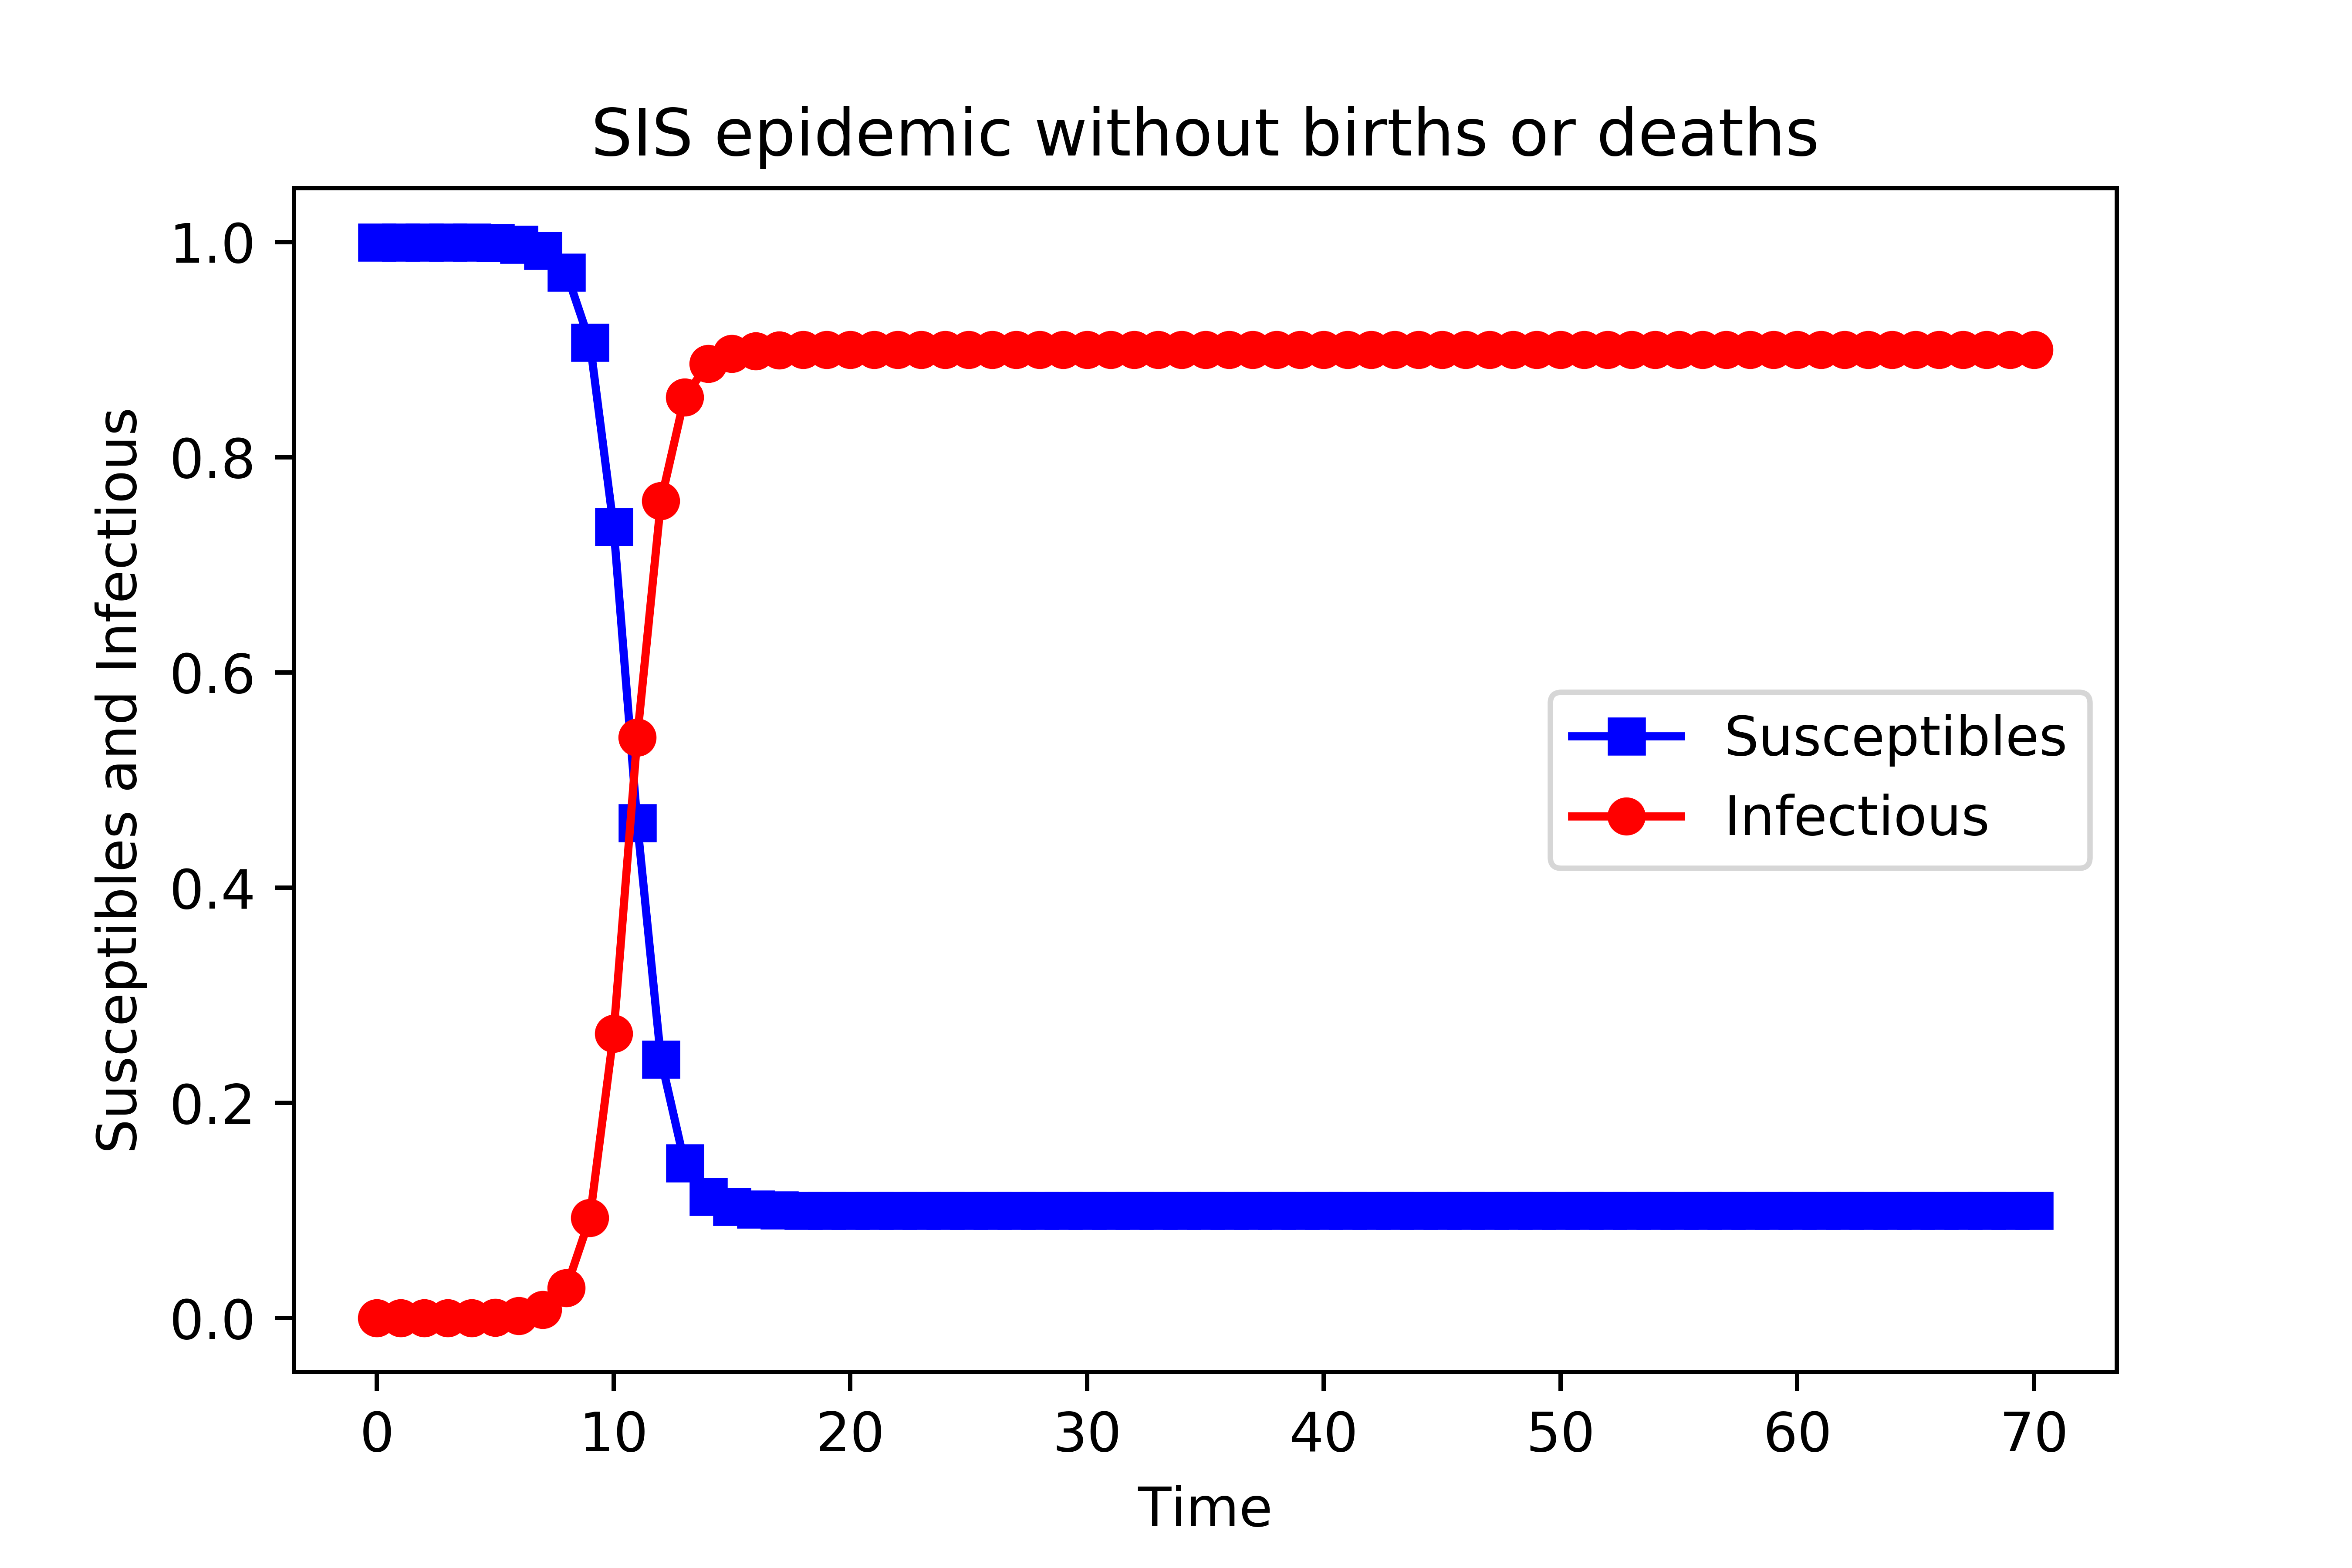
由于个体被感染后可以恢复,所以在一个大的时间步,上图是t=17,系统达到一个稳态,其中感染个体的比例是恒定的。因此,在稳定状态下,只有有限部分的个体被感染,此时并不意味着感染消失了,而是此时在任意一个时间点,被感染的个体数量和恢复的个体数量达到一个动态平衡,双方比例保持不变。请注意,对于较大的恢复率gamma,感染个体的数量呈指数下降,最终疾病消失,即此时康复的速度高于感染的速度,故根据恢复率gamma的大小,最终可能有两种可能的结果。
3. SIR model
# -*- coding: utf-8 -*-

import scipy.integrate as spi

import numpy as np

import pylab as pl

beta=1.4247

gamma=0.14286

TS=1.0

ND=70.0

S0=1-1e-6

I0=1e-6

INPUT = (S0, I0, 0.0)

def diff_eqs(INP,t):

	'''The main set of equations'''

	Y=np.zeros((3))

	V = INP

	Y[0] = - beta * V[0] * V[1]

	Y[1] = beta * V[0] * V[1] - gamma * V[1]

	Y[2] = gamma * V[1]

	return Y   # For odeint

t_start = 0.0; t_end = ND; t_inc = TS

t_range = np.arange(t_start, t_end+t_inc, t_inc)

RES = spi.odeint(diff_eqs,INPUT,t_range)

print(RES)

#Ploting

pl.plot(RES[:,0], '-bs', label='Susceptibles')  # I change -g to g--  # RES[:,0], '-g',

pl.plot(RES[:,2], '-g^', label='Recovereds')  # RES[:,2], '-k',

pl.plot(RES[:,1], '-ro', label='Infectious')

pl.legend(loc=0)

pl.title('SIR epidemic without births or deaths')

pl.xlabel('Time')

pl.ylabel('Susceptibles, Recovereds, and Infectious')

pl.savefig('2.1-SIR-high.png', dpi=900) # This does, too

pl.show()
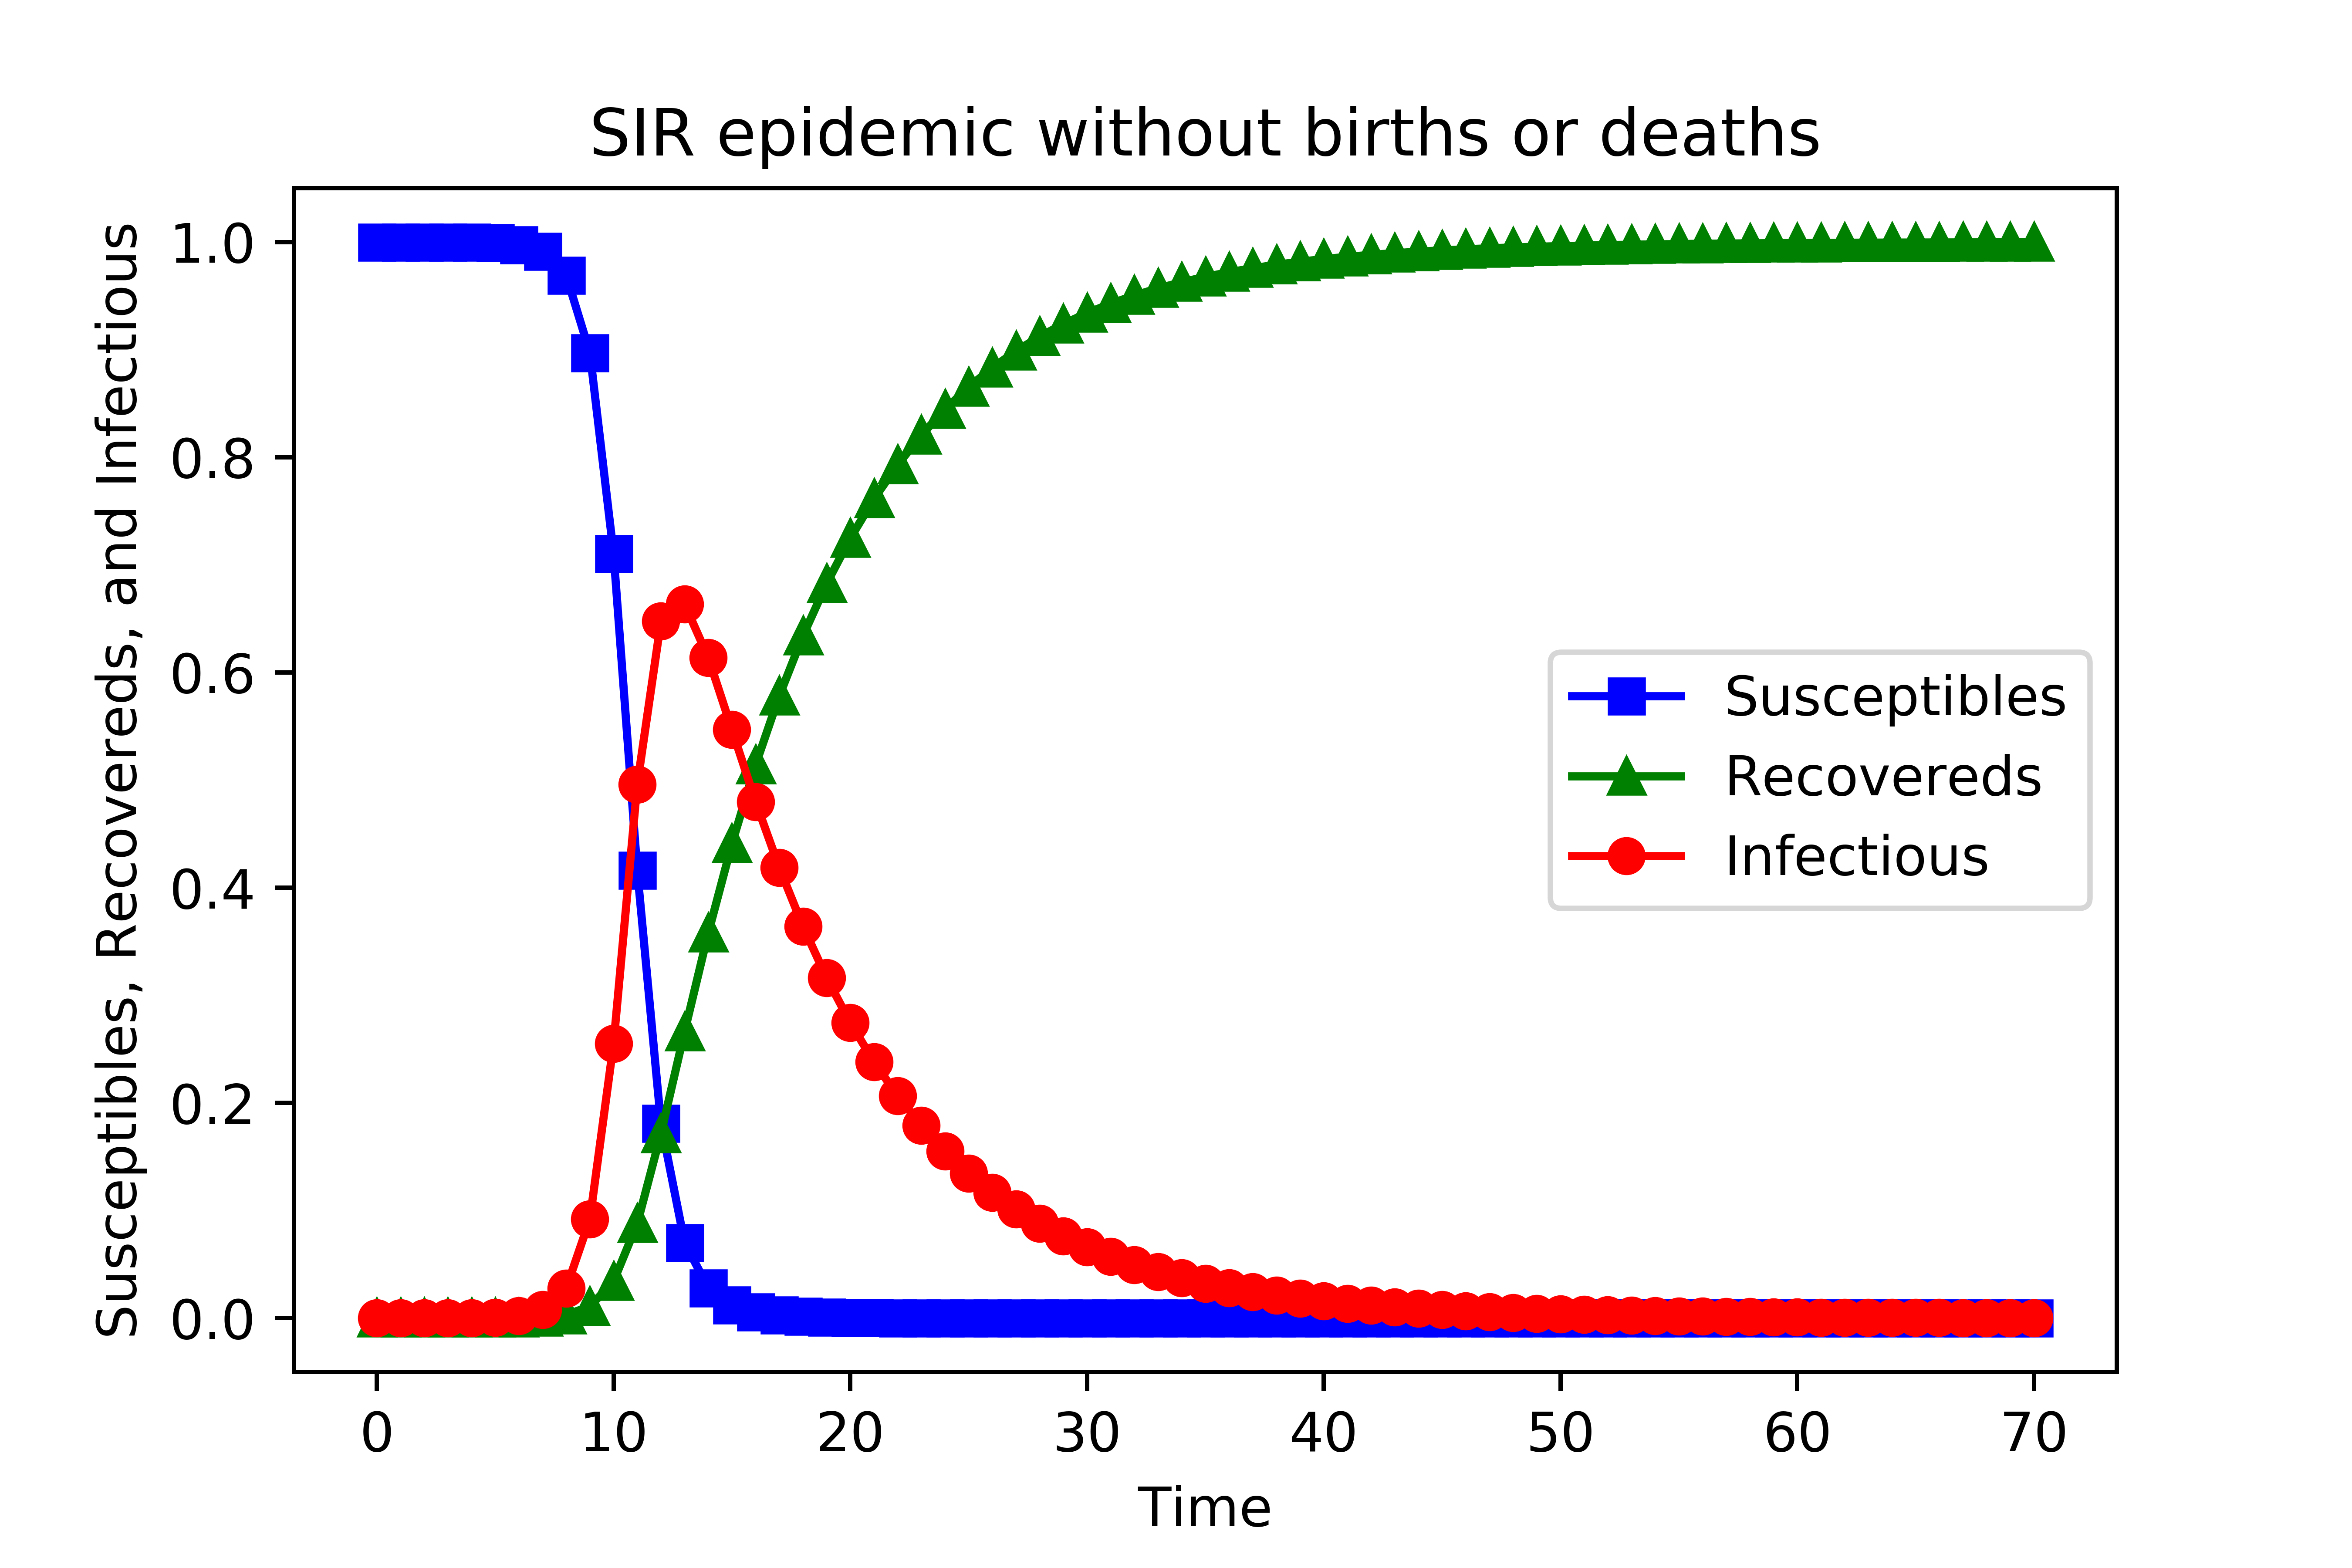
所得结果如下图:
基本的传染病模型:SI、SIS、SIR及其Python代码实现的更多相关文章
- 传染病传播模型(SIS)Matlab代码
function spreadingability=sir(A,beta,mu) for i=1:length(A) for N=1:50%随机次数 InitialState=zeros(length ...
- matlab练习程序(传染病模型)
最近新型冠状病毒疫情越来越严重了,待在家中没法出去,学习一下经典传染病模型. 这里总结了五个模型,分别是SI模型,SIS模型,SIR模型,SIRS模型,SEIR模型. 这几种模型的特点先介绍一下. 首 ...
- 隐马尔科夫模型,第三种问题解法,维比特算法(biterbi) algorithm python代码
上篇介绍了隐马尔科夫模型 本文给出关于问题3解决方法,并给出一个例子的python代码 回顾上文,问题3是什么, 下面给出,维比特算法(biterbi) algorithm 下面通过一个具体例子,来说 ...
- 转:关于Latent Dirichlet Allocation及Hierarchical LDA模型的必读文章和相关代码
关于Latent Dirichlet Allocation及Hierarchical LDA模型的必读文章和相关代码 转: http://andyliuxs.iteye.com/blog/105174 ...
- TensorFlow 训练好模型参数的保存和恢复代码
TensorFlow 训练好模型参数的保存和恢复代码,之前就在想模型不应该每次要个结果都要重新训练一遍吧,应该训练一次就可以一直使用吧. TensorFlow 提供了 Saver 类,可以进行保存和恢 ...
- 传染病模型(SIR模型)
- 网络传播模型Python代码实现
SI模型 import numpy as np import matplotlib.pyplot as plt import smallworld as sw #邻接矩阵 a = sw.a # 感染率 ...
- 混合高斯模型:opencv中MOG2的代码结构梳理
/* 头文件:OurGaussmix2.h */ #include "opencv2/core/core.hpp" #include <list> #include&q ...
- 做量化模型Matlab、R、Python、F#和C++到底选择哪一个?
MATLAB是matrix&laboratory两个词的组合,意为矩阵工厂(矩阵实验室).是由美国mathworks公司发布的主要面对科学计算.可视化以及交互式程序设计的高科技计算环境.它将数 ...
随机推荐
- iOS安全攻防之反编译
Class-dump 进行反编译: 之前做代码混淆, 首先了解了下反编译,使用入门级的反编译 class-dump.下载地址:最新版Class-dump. 首先需要注意的是,class-dump的作用 ...
- js继承之原型链继承
面向对象编程都会涉及到继承这个概念,JS中实现继承的方式主要是通过原型链的方法. 一.构造函数.原型与实例之间的关系 每创建一个函数,该函数就会自动带有一个 prototype 属性.该属性是个指针, ...
- springboot 1.5.2 集成kafka 简单例子
添加依赖 compile("org.springframework.kafka:spring-kafka:1.1.2.RELEASE") 添加application.propert ...
- 深度解析PHP数组函数array_chunk
array_chunk是PHP中的一个数组分割函数,是将一个数组分割为多个数组块 我们可以把它理解卖豆腐的商人把一整块大豆腐切割为一个一个的小块来进行售卖 这个函数需要三个参数: 被切割的数组(必需) ...
- superagent和request结果转换区别
superagent和request结果转换区别 使用superagent和request抓取页面内容时,两个抓取内容都可以被cheerio进行处理.但处理时有个细微差别. 1. 使用superage ...
- 深入理解Java常用类-----StringBuilder
上篇文章我们介绍过String这个常用类,知道了该类的内部其实是用的一个char数组表示一个字符串对象的,只是该字符数组被final修饰,一旦初始化就不能修改,但是对于经常做字符串修改操作的情况下,S ...
- WPF 杂谈——Binding表达式
不管是定义控件还是用户控件都会用到一个功能--绑定(Binding).书面的叫法:元素绑定.意思就是让绑定的元素实现数据同步.在笔者看来WPF引入这一个功能实在是太完美了.编程更加的具体化.特别是跟M ...
- wpf XAML xaml 进行 数据绑定,Resource DataContext ElementName
先做个声明:这里绑定都在前台实现,至于后台怎么写,那比前台简单多了,但更常用的是xaml中绑定.我们分析下最简单的字符串绑定来弄清楚原理,其他的类推就是. 数据绑定主要是要弄清楚两个东西,一个是源So ...
- MVC分层含义与开发方式
真正的服务层是面向数据的,假想一切数据都是从参数获得 控制层是接受页面层数据,再传给服务层,然后将结果返回给页面层的(客户) 页面层是提交格式化的数据的(容易小混乱,无格式,所以要格式化,可以在中间加 ...
- vue-schart : vue.js 的图表组件
介绍 vue-schart 是使用vue.js封装了sChart.js图表库的一个小组件.支持vue.js 1.x & 2.x 仓库地址:https://github.com/lin-xin/ ...