Monitoring tools that everyone's currently using
Although a lot of new tools have arrived since 2011, it's clear that older open source tools like Nagios, and Nagios alternatives like Zabbix and Icinga, still dominate the market, with 70% of the companies we spoke to still using these tools for their core monitoring & alerting.
Around 70% of the companies used more than one monitoring tool, with most using an average of two. Nagios/Graphite configurations were most common, with many also using New Relic. However, only two of the companies we spoke to actually paid for New Relic, with most of the companies using the free version as they found the paid version too expensive.
In the "other" category, there were a lot of different tools with no particular one standing out. Types of tools that fell into this category were SaaS monitoring tools such as Librato & Datadog, used by several smaller start-ups, or many older open source tools like Cacti or Munin. Some AWS users rely on CloudWatch, and there were even a few custom built solutions.

Graph 1: Percentage of companies with monitoring tools deployed.
If we look at tool usage versus the number of servers the companies manage (< 20 being new startup services, and all the way to > 1000 servers for the large online services), you can see that the proportion of older open source tools like Nagios, or paid on-premise tools goes up as the service gets larger, whereas the smaller, newer services are more likely to use developer focused tools like Graphite, LogStash and New Relic.
This makes sense, as many of the larger services are older (> 5 years old) so have legacy monitoring infrastructure, and also have the resources to hire a dedicated operations team who tend to bring in the tools their most familiar with, namely Nagios or Nagios alternatives. They also have more money to pay for monitoring tools like Splunk (which everyone would love to have if they could afford it) or AppDynamics.
The newer smaller services tend not to have any DevOps/Operations people in their company, so developers tend to use simpler-to-install SaaS monitoring tools, or tools that help them such as Graphite or LogStash. There seems to be a tipping point between 50-100 servers when the company has the resources to bring in a DevOps/Operations person or team and they start bringing in the infrastructure monitoring tools like Nagios to provide the coverage they need.
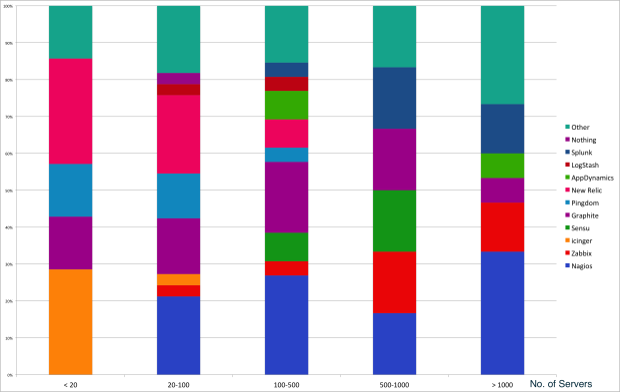
Graph 2: Tool Usage vs. Number of Servers Managed
Key Trends:
1. Many people found the newer services lacked the flexibility of open source solutions with their ability to customize them to their requirements, and didn't like the idea of learning a proprietary system with its own plugin design and features. So they built their own "kit car".
2. While the services became larger, the trend was the move towards microservices, with different cross-functional development teams building, deploying and supporting their own parts of the service.
3. There are some simpler things that can be done to reduce spammy alerts with potential of predictive & more intelligent alerting using machine learning.
[excerpt from Outlyer]
Monitoring tools that everyone's currently using的更多相关文章
- PostgreSQL Performance Monitoring Tools
PostgreSQL Performance Monitoring Tools https://github.com/CloudServer/postgresql-perf-tools This pa ...
- 4. Traffic monitoring tools (流量监控工具 10个)
4. Traffic monitoring tools (流量监控工具 10个)EttercapNtop SolarWinds已经创建并销售了针对系统管理员的数十种专用工具. 安全相关工具包括许多网络 ...
- Top 10 Free Wireless Network hacking/monitoring tools for ethical hackers and businesses
There are lots of free tools available online to get easy access to the WiFi networks intended to he ...
- Top 12 Best Free Network Monitoring Tools (12种免费网络监控工具)
1) Fiddler Fiddler(几乎)是适用于任何平台和任何操作系统的最好的免费网络工具,并提供了一些广受欢迎的关键特性.如:性能测试.捕捉记录HTTP/HTTPs请求响应.进行web调试等很多 ...
- Java Monitoring&Troubleshooting Tools
JDK Tools and Utilities Monitoring Tools You can use the following tools to monitor JVM performance ...
- troubleshooting tools in JDK 7--转载
This chapter describes in detail the troubleshooting tools that are available in JDK 7. In addition, ...
- Java Performance Optimization Tools and Techniques for Turbocharged Apps--reference
Java Performance Optimization by: Pierre-Hugues Charbonneau reference:http://refcardz.dzone.com/refc ...
- Flink监控:Monitoring Apache Flink Applications
This post originally appeared on the Apache Flink blog. It was reproduced here under the Apache Lice ...
- MySQL Performance Tuning: Tips, Scripts and Tools
With MySQL, common configuration mistakes can cause serious performance problems. In fact, if you mi ...
随机推荐
- [转载]ORA-00313:无法打开日志组1(线程 1)的成员_ORA-00312:
原文地址:1)的成员_ORA-00312:">ORA-00313:无法打开日志组1(线程 1)的成员_ORA-00312:作者:Sweet_薇薇毅 今天用系统清理工具把系统垃圾清理了一 ...
- UOJ67 新年的毒瘤
本文版权归ljh2000和博客园共有,欢迎转载,但须保留此声明,并给出原文链接,谢谢合作. 本文作者:ljh2000 作者博客:http://www.cnblogs.com/ljh2000-jump/ ...
- tiff/tfw, jpg/jpgw坐标文件的格式(6个参数)
tiff/tfw, jpg/jpgw坐标文件的格式(6个参数) 0.100-0.13999904400510 以上每行对应的含义: 1 地图单元中的一个象素在X方向上的X分辨率尺度. 2 平移量. 3 ...
- openstack live migration性能分析
http://blog.zhaw.ch/icclab/an-analysis-of-the-performance-of-live-migration-in-openstack/ http://blo ...
- Web API 接口-JavaScript全部api接口文档
当使用JavaScript编写网页代码时,有很多API可以使用.以下是所有对象.类型等接口的列表,你在开发网页应用程序或站点时使用它们. API文档地址:https://developer.mozil ...
- 《Advanced Bash-scripting Guide》学习(七):描述、列表和确定是否可以安装一个rpm包
本文所选的例子来自于<Advanced Bash-scripting Gudie>一书,译者 杨春敏 黄毅 Example 3-2.将一个代码块的结果保存到文件 #!/bin/bash # ...
- spring boot 基础篇 -- 阿里多数据源
这块是比较基础的配置,阿里数据库配置还是比较好用的,并且可以用来监控数据源的情况.废话不多说,下面看代码. 基于maven项目,在pom.xml中添加引用: <dependency> &l ...
- java学习笔记--常用类
一.Math类:针对数学运算进行操作的类 1.常用的方法 A:绝对值 public static int abs(int a) B:向上取整 public static double ceil( ...
- C#文件操作常用相关类(Directory类、File类、Path类)
1.文件操作常用相关类 1)File //操作文件,静态类,对文件整体操作.拷贝.删除.剪切等 2)Directory //操作目录(文件夹),静态类 3)DirectoryInfo //文件夹的一个 ...
- hibernate - 一级缓存和三种状态解析
转载自:http://www.cnblogs.com/whgk/p/6103038.html 一.一级缓存和快照 什么是一级缓存呢? 很简单,每次hibernate跟数据库打交道时,都是通过sessi ...