Monitor Minio server with Prometheus
Prometheus is an open source monitoring platform that help you analyze and monitor infrastructure components. Prometheus server collects metrics from targets by scraping HTTP endpoints.
Minio now has built-in support for exporting Prometheus compatible data on an unauthenticated endpoint. This enables Prometheus monitoring for Minio server deployments without sharing server credentials and eliminates the need to run an external Prometheus exporter.
In this post, we’ll take a look at the data points available under a Minio Prometheus endpoint, and see how to use those fields to create critical alerts for Minio based storage infrastructure. Finally, we’ll also see how to visualize the data points using Grafana.
Setup Minio and Prometheus
Setting up Prometheus to scrape Minio endpoints is straightforward. Follow the [How to monitor Minio server with Prometheus] guide to setup Minio server monitoring with Prometheus.
Note that Prometheus support was added in Minio server release RELEASE.2018–05–11T00–29–24Z , so you need to have this version or later running. To get started with Minio, refer Minio QuickStart Document.
Minio Prometheus exporter fields
Minio uses the Prometheus Go client along with internal administration data to instrument and export data. Here are the data points that you can expect from the Minio Prometheus endpoint.
- Uptime (available for Minio server/gateway)
process_start_time_seconds : This stores the time since Minio server process started. You can use it with Prometheus query language to generate interesting insights easily. For example, get Minio server uptime using time() — process_start_time_seconds and detect crash loops using changes(process_uptime_seconds[30m])
- Storage (available for Minio server instances only)
minio_disk_storage_used_bytes : This is the total disk storage used by Minio server (in bytes).
If caching is enabled, following additional metrics are available
minio_disk_cache_storage_bytes : This is the total cache capacity available for current Minio instance (in bytes).
minio_disk_cache_storage_free_bytes : This is the free cache capacity available to current Minio instances (in bytes).
- Request duration (available for Minio server/gateway)
Request duration information is split into request types using Prometheus Histogram metric type. The basename for this metric is minio_http_requests_duration_seconds . You can add _bucket to the basename to get cumulative counters for all the request types. So, minio_http_requests_duration_seconds_bucket will show something like this:
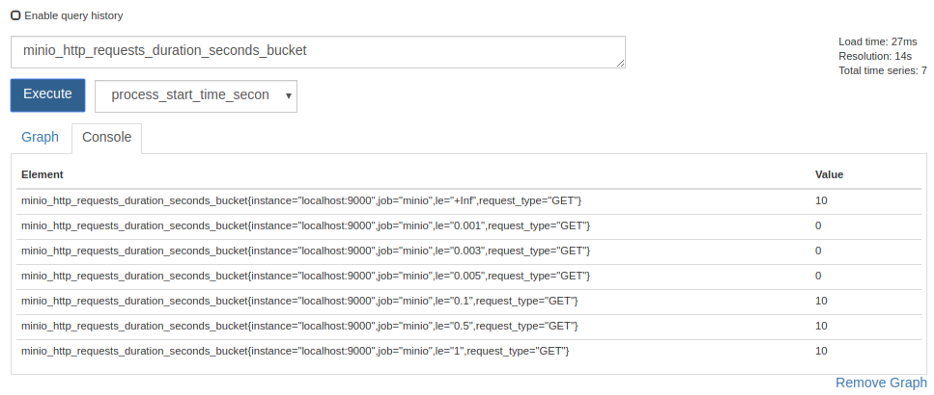
Other options are minio_http_requests_duration_seconds_sum which shows the current aggregate time spent servicing all HTTP requests in seconds, and minio_http_requests_duration_seconds_count which shows the sum of all requests served.
- Network statistics (available for Minio server/gateway)
minio_network_received_bytes_total : This shows the total number of bytes received by Minio server (in bytes).
minio_network_sent_bytes_total : This is the total number of bytes sent by Minio server (in bytes).
- Disk statistics (available for Minio server instances only)
minio_total_disks : This is the total number of disks available to Minio server.
minio_offline_disks : This is the count of total offline disks.
Use Cases
Monitoring alone is of not much use until you have a integrated alerting system that notifies concerned stakeholders whenever something goes wrong. Thankfully Prometheus does all this and more.
Once Minio server data is plugged into Prometheus monitoring, you can configure Prometheus alertmanager and create alerting rules. This way you have production ready, end to end monitoring and alerting setup.
Let’s explore some interesting use cases of such alerting setup.
- Alert when disk is offline
Using the minio_offline_disks field, you can set up alerts if disk(s) are offline on a Minio server instance. This is how a sample alerting rule would look
groups:
- name: Minio
  rules:
  - alert: DiskOffline
    expr: minio_offline_disks != 0
    for: 5m
    labels:
      severity: page
    annotations:
summary: Disk offline- Alert when free space is less than specified threshold
Using the minio_disk_storage_free_bytes field, you can set up alerts when a Minio server instance is running low on available storage space. A sample alerting rule would look like this
groups:10737418240
- name: Minio
rules:
- alert: StorageSpaceExhausted
expr: minio_disk_storage_free_bytes <
labels:
severity: page
annotations:
summary: Free space threshold reached
This will fire an alert when free bytes reaches below 10GiB.
- Alert when a Minio server instance is under high load
Following above examples, you can set up alerts when Minio server is under high load, using the minio_http_requests_duration_seconds_bucket field.
Grafana
Grafana is a visualization platform to understand metrics. It integrates very well with Prometheus and helps visually analyze Prometheus data. If you followed along till now, you already have Minio data coming into your Prometheus server.
Let us now see how to set up Grafana to fetch data from Prometheus and visualize it via Grafana dashboard.
- Install Grafana
On Ubuntu/Debian based platforms, Grafana already has deb packages available. Install it using
$ wget https://s3-us-west-2.amazonaws.com/grafana- releases/release/grafana_5.1.2_amd64.deb$ sudo apt-get install -y adduser libfontconfig$ sudo dpkg -i grafana_5.1.2_amd64.debOnce installed, start Grafana using
$ sudo service grafana-server startFor other platforms refer Grafana documentation. By default Grafana listens on port 3000. Access Grafana UI via browser on http://localhost:3000 . Default credentials are user name = admin and password = admin
- Create Dashboard
Once you have access to the UI, create a datasource for Grafana to fetch data from Prometheus. Click on Settings >> Data Sources >> Add Data Source. Then select Prometheus as the data type in the dropdown and add Prometheus URL and a name for the data source.
Then click Create >> Dashboard on the left side bar. Inside the dashboard, you can add panels. Select a graph as the new panel. Once the graph opens, click on the edit button on graph top menu bar. You can now edit graphs properties. Here you can choose any of the data points that Minio exposes and the data source.

While you’re at it, help us understand your use case and how we can help you better! Fill out our “Best of Minio” deployment form (takes less than a minute), and get a chance to be featured on the Minio website and showcase your Minio private cloud design to Minio community.
Monitor Minio server with Prometheus的更多相关文章
- A simple way to monitor SQL server SQL performance.
This is all begins from a mail. ... Dear sir: This is liulei. Thanks for your help about last PM for ...
- MinIO Server配置指南
MinIO server在默认情况下会将所有配置信息存到 ${HOME}/.minio/config.json 文件中. 以下部分提供每个字段的详细说明以及如何自定义它们. 配置目录 默认的配置目录是 ...
- 为MinIO Server设置Nginx代理
官方文档地址:http://docs.minio.org.cn/docs/master/setup-nginx-proxy-with-minio nginx参考网址:https://www.nginx ...
- monitor weblogic server ,Very simple to use, weblogic监控、巡检、故障简单小工具
1. 开发了一个简单的监视weblogic执行情况的小程序.各位朋友下载下来试试,不用登陆console就能够知道server的执行状况,包含了jvm.线程.jdbc.状态jms等:另一个更简 ...
- 使用 Prometheus 监控minio 性能指标信息&&docker-compose 方式运行
minio server 已经支持Prometheus 了,对于系统的运行参数我们可以方便.实时的查看 运行使用docker-compose docker-compose 文件 version: &q ...
- 使用loki+ mtail + grafana + prometheus server分析应用问题
loki 是一个方便的类似prometheus 的log 系统,mtail 是一个方便的日志提取工具, 可以暴露为http 服务——支持导出prometheus metrics 环境准备 docker ...
- 从零开始搭建Prometheus自动监控报警系统
从零搭建Prometheus监控报警系统 什么是Prometheus? Prometheus是由SoundCloud开发的开源监控报警系统和时序列数据库(TSDB).Prometheus使用Go语言开 ...
- Stream processing with Apache Flink and Minio
转自:https://blog.minio.io/stream-processing-with-apache-flink-and-minio-10da85590787 Modern technolog ...
- Prometheus监控系统之入门篇(一)
1. 简介 Prometheus: (简称Prom)是由SoundCloud开发的开源监控报警系统.是大名鼎鼎的CNCF云原生基金会下的第二大开源项目.具有如下特点: 使用Go语言开发 内置时序数据库 ...
随机推荐
- 自动化测试工具Telerik Test Studio发布R1 2019|附下载
Telerik Test Studio是一个用于功能性Web.桌面和移动测试的直观测试自动化工具,它能轻松地实现自动化测试.同时会为GUI.性能.加载和API测试提供完整的自动化测试解决方案. [Te ...
- 代码改变世界 | 如何封装一个简单的 Koa
下面给大家带来:封装一个简单的 Koa Koa 是基于 Node.js 平台的下一代 web 开发框架 Koa 是一个新的 web 框架,可以快速而愉快地编写服务端应用程序,本文将跟大家一起学习:封装 ...
- 联想 Lenovo PWR-G60 无线掌中宝拆机
从朋友那里弄了台Lenovo PWR-G60,现在已经停产了,淘宝上某店卖的国产WIFI Pineapple貌似就是拿这个刷的,打算出篇DIY教程 现在人在外地,编程器.热风枪.烙铁工具啥的都没有,更 ...
- 利用Hackrf One进行GPS定位欺骗制作超级跑马机
0×00 驾校的困惑 现行规定要求每个学员都必须在驾校练习够规定的学时,才能参加考试,在每台教练车上都安装有计时计程终端,学员刷卡刷指纹后开始累计里程.但是目前中国的很多驾校,存在车少人多的情况,假设 ...
- python josn转换方法-字典
python_json常用的方法 1. 什么是JSON? JSON 可以将 JavaScript 对象中表示的一组数据转换为字符串,然后就可以在函数之间轻松地传递这个字符串,或者在异步应用程序中将字符 ...
- PAT 乙级 1056. 组合数的和(15)
给定N个非0的个位数字,用其中任意2个数字都可以组合成1个2位的数字.要求所有可能组合出来的2位数字的和.例如给定2.5.8,则可以组合出:25.28.52.58.82.85,它们的和为330. 输入 ...
- 大数据-07-Spark之流数据
摘自 http://dblab.xmu.edu.cn/blog/1084-2/ 简介 DStream是Spark Streaming的编程模型,DStream的操作包括输入.转换和输出. Spark ...
- Ubuntu Core 网络配置
/********************************************************************************* * Ubuntu Core 网络配 ...
- MySQL中的存储过程和函数使用详解
一.对待存储过程和函数的态度 在实际项目中应该尽量少用存储过程和函数,理由如下: 1.移植性差,在MySQL中的存储过程移植到sqlsever上就不一定可以用了. 2.调试麻烦,在db中报一个错误和在 ...
- Micro- and macro-averages
https://datascience.stackexchange.com/questions/15989/micro-average-vs-macro-average-performance-in- ...