
Custom Diagrams
Custom Diagrams
You can create custom ER diagrams that can contain any tables, relations and notes.
However, even custom diagrams may contain only real existing database entities (tables).

You can create a custom diagram in one of the ways:
On the DBeaver main menu, click File -> New. Then in the new diagram wizard, click DBeaver -> ER Diagram, and then Next:

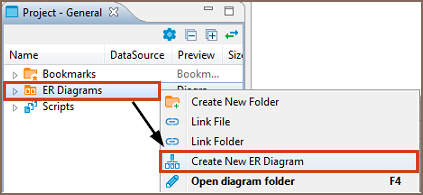
In the Project Explorer view, right-click the ER Diagrams node and then click Create New ER Diagram on the context menu.
In both cases, in the Diagram Create Wizard, specify the diagram name and (optionally) choose initial diagram contents (set of tables):

The new diagram appears in a separate editor. Now you can drag-n-drop any number of tables onto it. You can add tables from different connections and even different database type (for example, combine Oracle and MySQL tables in one and the same diagram).
You can also add notes and custom relations (associations) using the ERD palette on the left side of diagram tab, see details in ER Diagrams article. For example, to create a diagram similar to the one shown at the beginning of this article, you need to:
- Add required tables and relationships between them and move them around to create a well-shaped structure (see Structure Adjustment section of the ER Diagrams article).
- Add notes (see the Notes section of the ER Diagrams article).
- Stretch the notes to cover the intended tables, then send the notes to back, and then set color to the tables and notes (see the View Adjustment section of the ER Diagrams article).
Undo/redo functions are fully supported in diagram editing.
DBeaver - Universal Database Manager
===============================
ER diagrams appear on the rightmost tab of the Database Object Editor:

Entity Relation Diagrams (ERD) are graphic presentations of database entities and relations between them. DBeaver allows viewing diagrams of existing tables and whole database schemas, see Database Structure Diagrams, as well as create custom diagrams, see Custom Diagrams.
By default DBeaver uses IDEF1X notation.
Both types of diagrams provide the same tools to adjust their view and structure. They can be printed and exported to image file formats.
Selection of Elements in Diagrams
You can use one of the two tools to select elements in diagrams:
Select – supports both, single and multi-select modes. To select a single element (table, connection, entity inside a table) in a diagram, just click that element. To select multiple elements, similar to using the Marquee tool, click outside the first element and draw until all elements you need are in focus:

Structure Adjustment
NOTE: All changes to existing database schemas cannot be saved and are intended for exploration purposes only.
You can do the following structure changes in diagrams.
Add new tables to a diagram by drag-n-dropping them onto the diagram field from the Database Navigator.
Rearrange tables in the diagram by dragging them all over the space. You can select several tables and drag them to a new location.
Auto-arrange tables into a compact view after manual rearrangements: click the Arrange Diagram (
 ) in the toolbar or on the context menu (right-click anywhere on the diagram tab).
(Available for Custom Diagrams only) - connect tables with a connector: click the Show Palette button (
 ) in the upper-left corner of the diagram tab and then, in the Palette panel, click Connection:
 Now click the tables that you want to connect with each other in turn one by one, and then to stop the connection line double-clicking the last table.
(Available for Custom Diagrams only) - remove tables and connections: right-click the table or conection and click Delete on the context menu or just click the table or connection and press Delete.
View Adjustment
You can adjust the view of any diagram in the following ways:
- Enable/disable the diagram grid: Click Toggle Grid (
 ) in the toolbar.
 - Modify attributes visibility: Right-click the diagram and, on the context menu, click Show Attributes and then one of the options:
- All - all attributes
- Any keys - primary and foreign keys
- Primary key - only primary keys
- None - no attributes
- Modify attributes presentation: Right-click the diagram and, on the context menu, click View Styles and then one of the options:
- Show Icons
- Show Data Types
- Show Nullability
- Show Comments
- Show Fully qualified names
- Change the color of entities/notes: Right-click the header of the entity or comment and then click Set color on the context menu. Then you can select the color and click OK.
- For elements located in front of/behind others, bring an element to front or send to back: Right-click the element and then click Bring to front / Send to back on the context menu.
- Zoom the diagram in/out: Click the Zoom In/Zoom Out buttons or choose the scaling value in the dropdown list in the toolbar:

Refresh
To see changes made to the database schema by other users, you might need to refresh the diagram: click Refresh Diagram ( ) in the toolbar.
Notes
You can create notes only in Custom Diagrams. To create a note, click the Show Palette button () in the upper-left corner of the diagram tab, then, in the Palette panel, click Note and then click anywhere in the diagram tab. Now you can double-click Note box to enter the note text:

Search in Diagram Entities
To search among entities of a diagram, click the Search items button ( ) in the toolbar, then type in the search combination. The entities that contain the search combination are highlighted in the diagram. To remove the filter, click the cross icon next to the search field.
Diagram Export
You can export (save) a diagram as an image (PNG, GIF, BMP formats) or as a file in GraphML format. To export a diagram, click Save diagram in external format ( ) in the toolbar.
Diagram Printing
To print a diagram, press CTRL+P or click Print Diagram ( ) in the toolbar.
Settings
To modify the diagram settings, click Configuration ( ) in the toolbar.
Custom Diagrams的更多相关文章
- Generating Sankey Diagrams from rCharts
A couple of weeks or so ago, I picked up an inlink from an OCLC blog post about Visualizing Network ...
- AutoMapper:Unmapped members were found. Review the types and members below. Add a custom mapping expression, ignore, add a custom resolver, or modify the source/destination type
异常处理汇总-后端系列 http://www.cnblogs.com/dunitian/p/4523006.html 应用场景:ViewModel==>Mode映射的时候出错 AutoMappe ...
- Spring Enable annotation – writing a custom Enable annotation
原文地址:https://www.javacodegeeks.com/2015/04/spring-enable-annotation-writing-a-custom-enable-annotati ...
- SharePoint2013 Set a custom application page as site welcome page
本文主要介绍如何添加一个custom application page as site welcome page 1.首先创建一个sharepoint 2013 empty solution, add ...
- WebComponent魔法堂:深究Custom Element 之 从过去看现在
前言 说起Custom Element那必然会想起那个相似而又以失败告终的HTML Component.HTML Component是在IE5开始引入的新技术,用于对原生元素作功能"增强& ...
- WebComponent魔法堂:深究Custom Element 之 标准构建
前言 通过<WebComponent魔法堂:深究Custom Element 之 面向痛点编程>,我们明白到其实Custom Element并不是什么新东西,我们甚至可以在IE5.5上定 ...
- WebComponent魔法堂:深究Custom Element 之 面向痛点编程
前言 最近加入到新项目组负责前端技术预研和选型,一直偏向于以Polymer为代表的WebComponent技术线,于是查阅各类资料想说服老大向这方面靠,最后得到的结果是:"资料99%是英语 ...
- [转]Writing Custom Middleware in ASP.NET Core 1.0
本文转自:https://www.exceptionnotfound.net/writing-custom-middleware-in-asp-net-core-1-0/ One of the new ...
- [转]How to: Create a Custom Principal Identity
本文转自:https://msdn.microsoft.com/en-us/library/aa702720(v=vs.110).aspx The PrincipalPermissionAttribu ...
随机推荐
- Linux下基于Docker部署.Net Core web api项目
Docker的好处我就不说啦,问问度娘就知道了
- JS中的运算符_函数学习
js中的运算符: 算数运算符: + - * / % ++ -- 逻辑运算符: & | ! && || < > <= ...
- HDU4109-instruction agreement(差分约束-最长路+建立源点,汇点)
Ali has taken the Computer Organization and Architecture course this term. He learned that there may ...
- 如何正确的使用Python解释器?你之前肯定用错了
作为python开发者,当我们编写Python代码时,我们得到的是一个包含Python代码的以.py为扩展名的文本文件.要运行代码,就需要Python解释器去执行.py文件.由于整个Python语言从 ...
- iSensor APP 之 摄像头调试 OV5642 续集2
参考上一篇博客 作为续集,主要测试 RAW格式下的 不同分辨率效果 iSensor APP 之 摄像头调试 OV5642 直接上图吧 720p 拍照效果
- Python3 并发编程3
目录 GIL全局解释器锁 基本概念 多线程的作用 死锁现象 递归锁 信号量 线程队列 GIL全局解释器锁 基本概念 global interpreter lock 全局解释器锁 GIL不是Python ...
- visual studio code开发代码片段扩展插件
背景 visual studio code编辑器强大在于可以自己扩展插件,不仅可以去插件市场下载,也可以按照官方的API很方便的制作适合自己的插件: 自己最近在开发一个手机端网站项目,基于vant项目 ...
- Node Js模块讲解
Node JS模块 所谓的Node JS模块其实就是指Node JS package,即nodejs包. 一 什么是NodeJS模块? 在说这个问题之前,我们有必要提出一个概念,即模块规范. 现阶段J ...
- 《Java算法》判重算法-整数判重
判重算法-整数判重 /** * 判断大于1,小于63的整数是否出现重复数字. * * 算法逻辑:先获取8 根据移位(1 << arrInt[i]) 得到2进制数100000000 , * ...
- SVN重新定位操作流程
因服务器其他系统需要SVN原来使用的443端口无法继续使用需要更换,服务器SVN端口已更新为8443,现将个人电脑SVN文件夹路径重新定位流程展示如下: 确定即修改成功!