jmeter+influxdb+granfana+collectd监控cpu+mem+TPS
1.安装grafana
#####gafana过期安装包安装报错
Error unpacking rpm package grafana-5.1.4-1.x86_64
error: unpacking of archive failed on file /usr/sbin/grafana-cli;5e250e9c: cpio: read
Verifying : grafana-5.1.4-1.x86_64
原因安装包损坏不是最新的
######下载官网最新的包:
####grafana installer
https://grafana.com/grafana/download
#####binary install
wget https://dl.grafana.com/oss/release/grafana-6.5.3.linux-amd64.tar.gz
tar -zxvf grafana-6.5.3.linux-amd64.tar.gz
#### grafana rpm install
sudo yum install initscripts urw-fonts wget
wget <rpm package url>
sudo rpm -Uvh <local rpm package>
安装成功展示:
warning: grafana-6.5.3-1.x86_64.rpm: Header V4 RSA/SHA1 Signature, key ID 24098cb6: NOKEY
Preparing... ################################# [100%]
Updating / installing...
1:grafana-6.5.3-1 warning: /etc/init.d/grafana-server created as /etc/init.d/grafana-server.rpmnew
warning: /usr/lib/systemd/system/grafana-server.service created as /usr/lib/systemd/system/grafana-server.service.rpmnew
################################# [100%]
### NOT starting on installation, please execute the following statements to configure grafana to start automatically using systemd
sudo /bin/systemctl daemon-reload
sudo /bin/systemctl enable grafana-server.service
### You can start grafana-server by executing
sudo /bin/systemctl start grafana-server.service
POSTTRANS: Running script.............
#### 启动grafana,验证服务已启动
sudo systemctl daemon-reload
sudo systemctl start grafana-server
sudo systemctl status grafana-server
###启动成功验证:
● grafana-server.service - Grafana instance
Loaded: loaded (/usr/lib/systemd/system/grafana-server.service; enabled; vendor preset: disabled)
Active: active (running) since Mon 2020-01-20 10:31:27 CST; 12s ago
Docs: http://docs.grafana.org
Main PID: 63048 (grafana-server)
###配置开机自启动
sudo systemctl enable grafana-server.service
####防火墙开放grafana端口默认3000:
firewall-cmd --zone=public --add-port=3000/tcp --permanent
firewall-cmd --reload
firewall-cmd --zone=public --list-ports
或者直接停掉防火墙:
systemctl stop firewalld
###web访问grafana:
安装主机ip:3000
###修改grafana 配置,Grafana有许多配置选项,您可以在.ini配置文件中指定或使用环境变量指定,
您必须重新启动Grafana才能使所有配置更改生效。
官网doc文档地址:https://grafana.com/docs/grafana/latest/installation/configuration/
vi /etc/grafana/grafana.ini
###ini注释comment方法讲解:
所有注释以分号开头,如果需要更改配置比如web页面port ,
需要删除行前面分号,更改为
###关于web login密码账号更改也是如此,需要重启grafana才生效
37 # The http port to use
38 ;http_port = 3000
####web login
152 #################################### Security ####################################
153 [security]
154 # disable creation of admin user on first start of grafana
155 ;disable_initial_admin_creation = false
156
157 # default admin user, created on startup
158 ;admin_user = admin
159
160 # default admin password, can be changed before first start of grafana, or in profile settings
161 ;admin_password = admin
#####influxdb 启动失败问题解决,influxdb installer 配置路径:
/etc/influxdb/influxdb.conf
#####启用graphite配置########:
[[graphite]]
# Determines whether the graphite endpoint is enabled.
enabled = false
database = "graphite"
# retention-policy = ""
bind-address = ":2003"
protocol = "tcp"
consistency-level = "one"
http启用:
### [http]
###
### Controls how the HTTP endpoints are configured. These are the primary
### mechanism for getting data into and out of InfluxDB.
###
[http]
# Determines whether HTTP endpoint is enabled.
enabled = true
# The bind address used by the HTTP service.
bind-address = ":8086"
#### 默认influxdb数据存放:meta元数据,data
/var/lib/influxdb/data
/var/lib/influxdb/meta
>>>>>>>>>>>>>>>>>>>>>>>>>>>>>>>>>>>>>>>>>>>>>>
### [meta]
###
### Controls the parameters for the Raft consensus group that stores metadata
### about the InfluxDB cluster.
###
[meta]
# Where the metadata/raft database is stored
dir = "/var/lib/influxdb/meta"
# Automatically create a default retention policy when creating a database.
# retention-autocreate = true
# If log messages are printed for the meta service
# logging-enabled = true
###
### [data]
###
### Controls where the actual shard data for InfluxDB lives and how it is
### flushed from the WAL. "dir" may need to be changed to a suitable place
### for your system, but the WAL settings are an advanced configuration. The
### defaults should work for most systems.
###
[data]
# The directory where the TSM storage engine stores TSM files.
dir = "/var/lib/influxdb/data"
# The directory where the TSM storage engine stores WAL files.
wal-dir = "/var/lib/influxdb/wal"
>>>>>>>>>>>>>>>>>>>>>>>>>>>>>>>>>>>>>>>>>>>>>>>>>>>
#### influxdb log目录:
启动influxdb:systemctl start influxdb
查询启动状态:systemctl status influxdb
启动失败:
: Failed to start InfluxDB is an open-source, distributed, time series database.
tail -n 20 /var/log/messages 分析失败原因,查找到用户权限拒绝:
run: open server: open tsdb store: mkdir /var/lib/influxdb/data/_internal/_series: permission denied
#### 查询influxdb: 使用查询命令rpm -ql influxdb
/usr/lib/influxdb/scripts/influxdb.service
/var/lib/influxdb
/var/log/influxdb
####
ls -l -d influxdb
cd /var/lib/
chown -R influxdb:influxdb influxdb
#### influxdb 集成安装collectd 监控cpu,mem,disk
###yum 安装collectd:org:https://collectd.org/download.shtml
<<python 模块伪代码https://www.jianshu.com/p/a05da23150fb>>
####### collectd安装使用,官网地址:https://collectd.org/download.shtml
方法一yum安装:
yum install epel-release–y
yum install -y collectd
###修改配置:
vi /etc/collectd.conf
修改配置
vi /etc/collectd.conf
确保以下几项的注释(#)是去掉的
Hostname "192.168.1.126" 此处改为安装collectd的机器IP地址
LoadPlugin cpu
LoadPlugin memory
LoadPlugin network
LoadPlugin swap
<Plugin cpu>
ReportByCpu true
ReportByState true
ValuesPercentage true 此处启用cpu的使用率,5.7.*以上才有,低版本的不支持百分百
</Plugin>
<Plugin network>
<Server "192.168.1.222" "25826"> 此处指定将collectd收集的数据发送到的influxdb地址和influxdb conf里collectd配置的端口
# Interface "enp0s31f6" 通过ifconfig获取网卡的名称
</Server>
</Plugin>
启动:
systemctl start collectd.service
systemctl status collectd.service
● collectd.service - Collectd statistics daemon
Loaded: loaded (/usr/lib/systemd/system/collectd.service; disabled; vendor preset: disabled)
Active: active (running) since Mon 2020-01-20 17:11:49 CST; 23s ago
Docs: man:collectd(1)
man:collectd.conf(5)
Main PID: 6968 (collectd)
Tasks: 11
CGroup: /system.slice/collectd.service
└─6968 /usr/sbin/collectd
方法二:源码安装:
wget https://storage.googleapis.com/collectd-tarballs/collectd-5.9.2.tar.bz2
tar -xvf collectd-5.9.2.tar.bz2
mkdir -p /data/project/collectd_dir/datas
## compile c,collectd C 语言写的一个系统性能采集工具
./configure -prefix=/data/project/collectd_dir/datas
### install by datas dir
make all install prefix=/data/project/collectd_dir/datas
find / -name collectd.conf 查询安装的目录:
/data/project/collectd_dir/datas/etc/collectd.conf
####
Hostname "192.168.110.151"
#FQDNLookup true
#BaseDir "/var/lib/collectd"
#PIDFile "/var/run/collectd.pid"
#PluginDir "/usr/lib64/collectd"
#TypesDB "/usr/share/collectd/types.db"
####influxdb 安装,官网地址https://v2.docs.influxdata.com/v2.0/get-started/:
wget https://dl.influxdata.com/influxdb/releases/influxdb-1.7.2.x86_64.rpm
sudo yum localinstall influxdb-1.7.2.x86_64.rpm
环境变量:vi /etc/profile
## influx env
export INFLUXDB_CONFIG_PATH=/etc/influxdb/influxdb.conf
systemctl start influxdb
[root@hostuser1 project]# influx
Connected to http://localhost:8086 version 1.6.4
InfluxDB shell version: 1.6.4
> create database collectd
> use collectd
Using database collectd
> show databases
name: databases
name
----
_internal
jmeter
collectd
###influxdb的数据量一多,会非常影响性能,可以设置只保留5天的数据
>create retention policy "5_days" on collectd duration 5d replication 1 default
> show retention policies on collectd
name duration shardGroupDuration replicaN default
---- -------- ------------------ -------- -------
autogen 0s 168h0m0s 1 true
>
show measurements
### 检查连接tcp 25826连接情况:
ss -tuln
udp UNCONN 0 0 [::]:25826 [::]:*
udp UNCONN 0 0 [::1]:323 [::]:*
tcp LISTEN 0 128 *:111 *:*
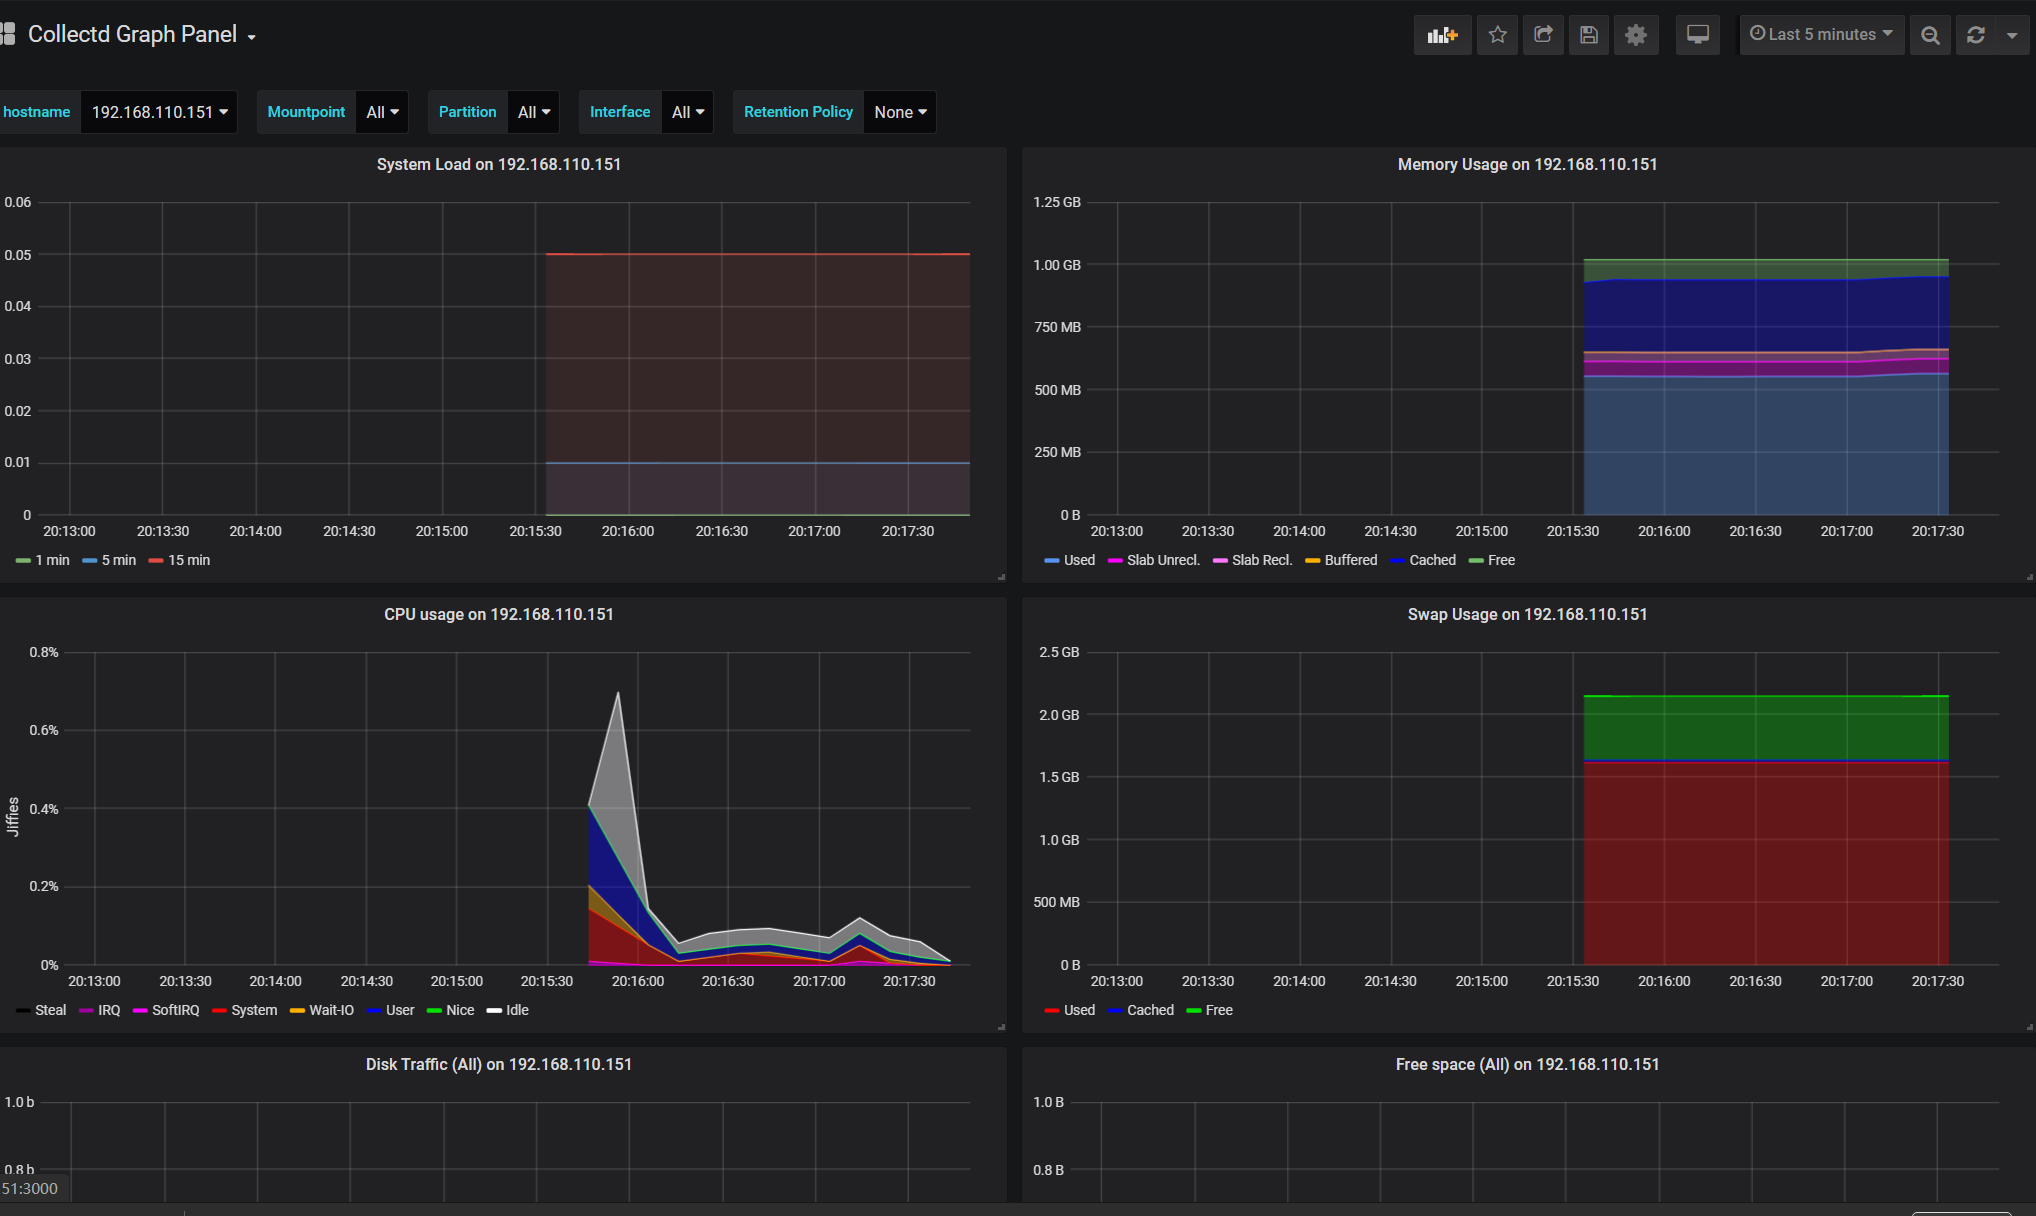
#####collectd dashboard模板
https://grafana.com/grafana/dashboards/10179
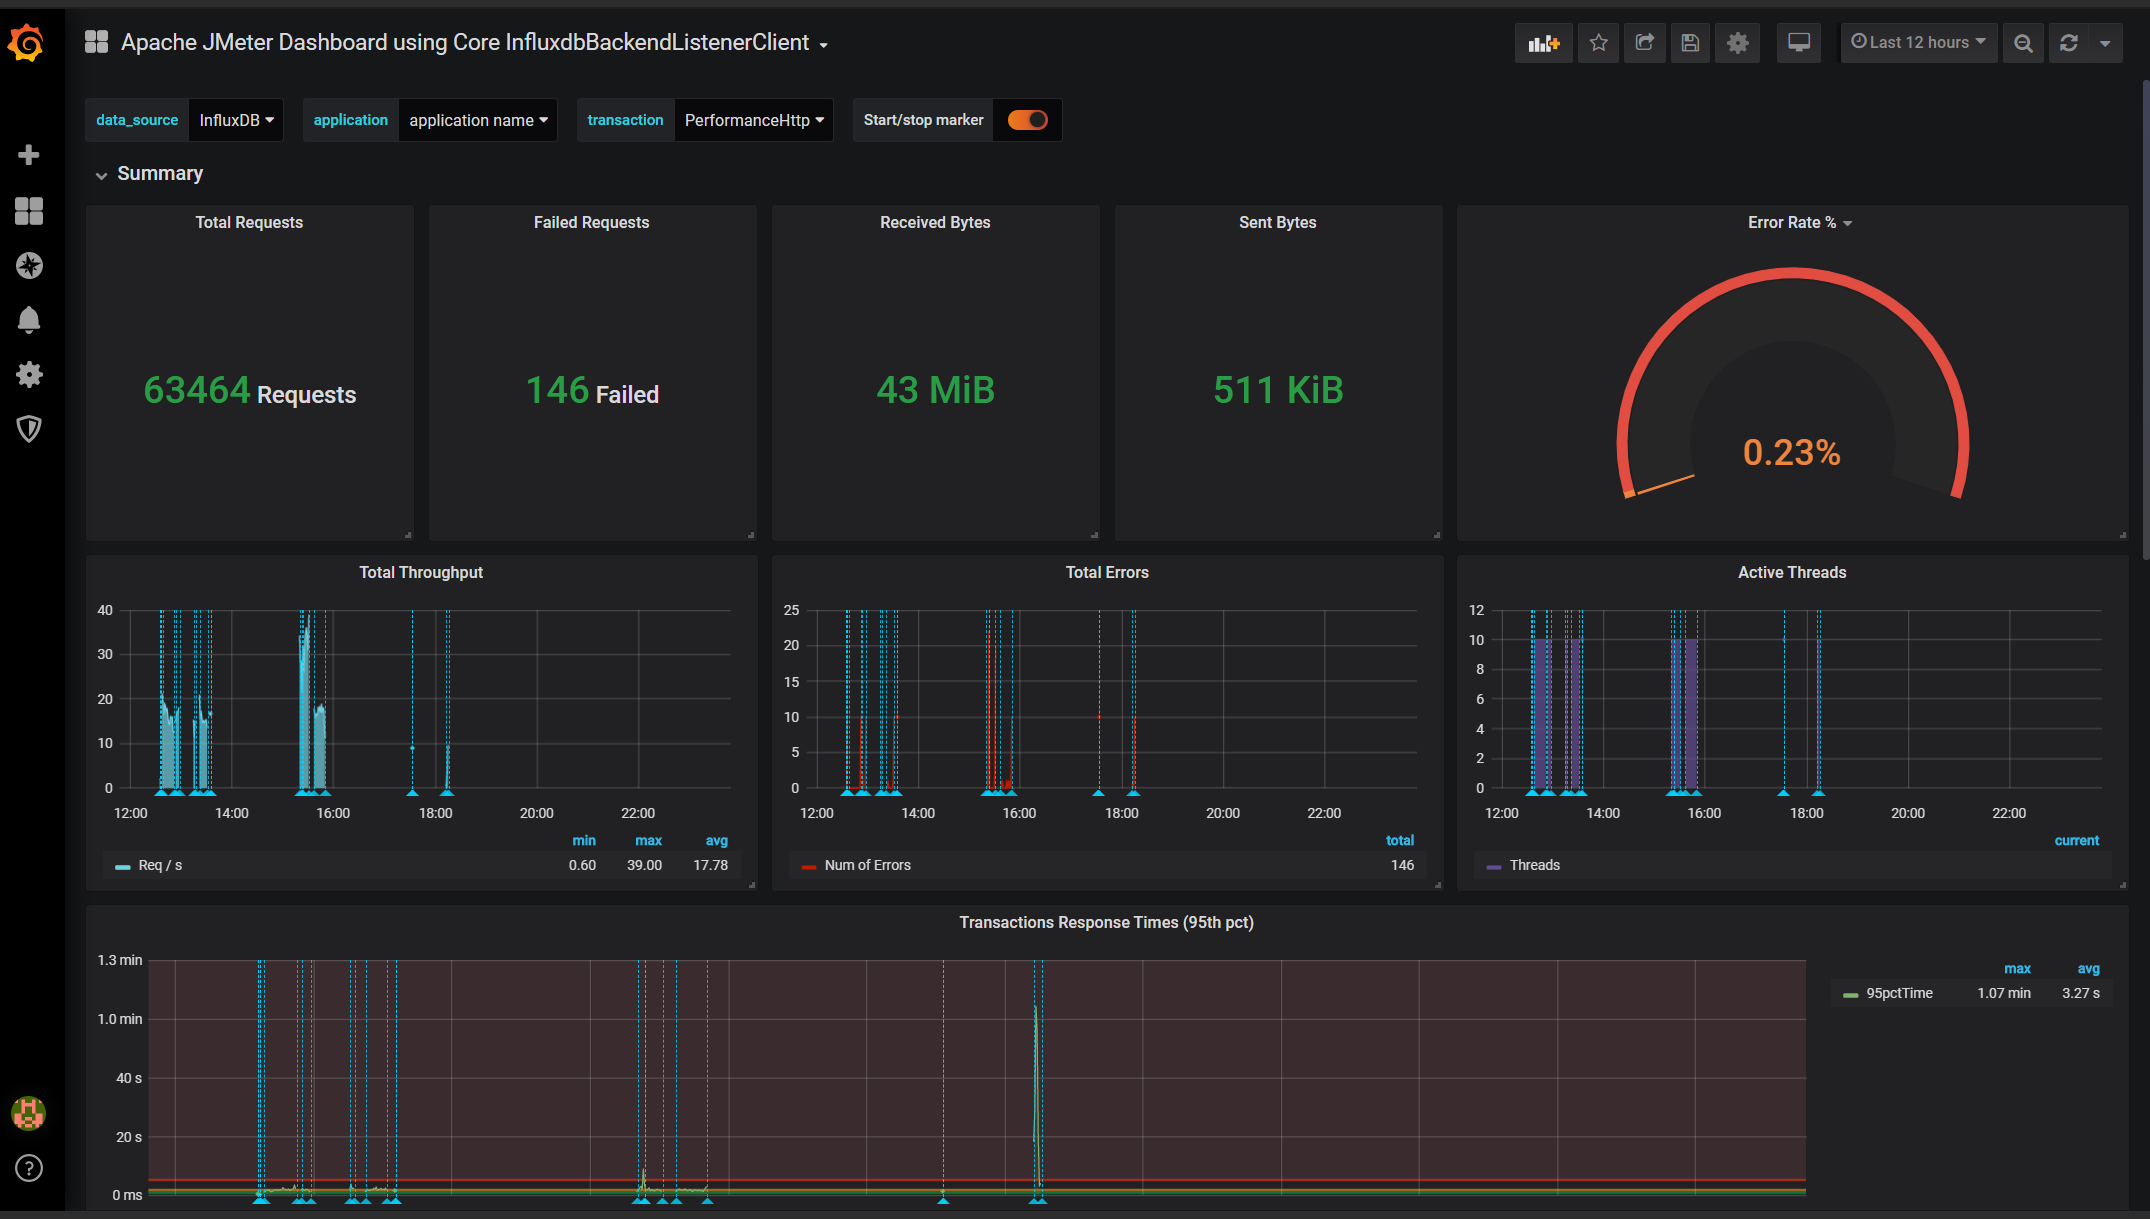
### JMETER >ADD>Listener>BackendListener
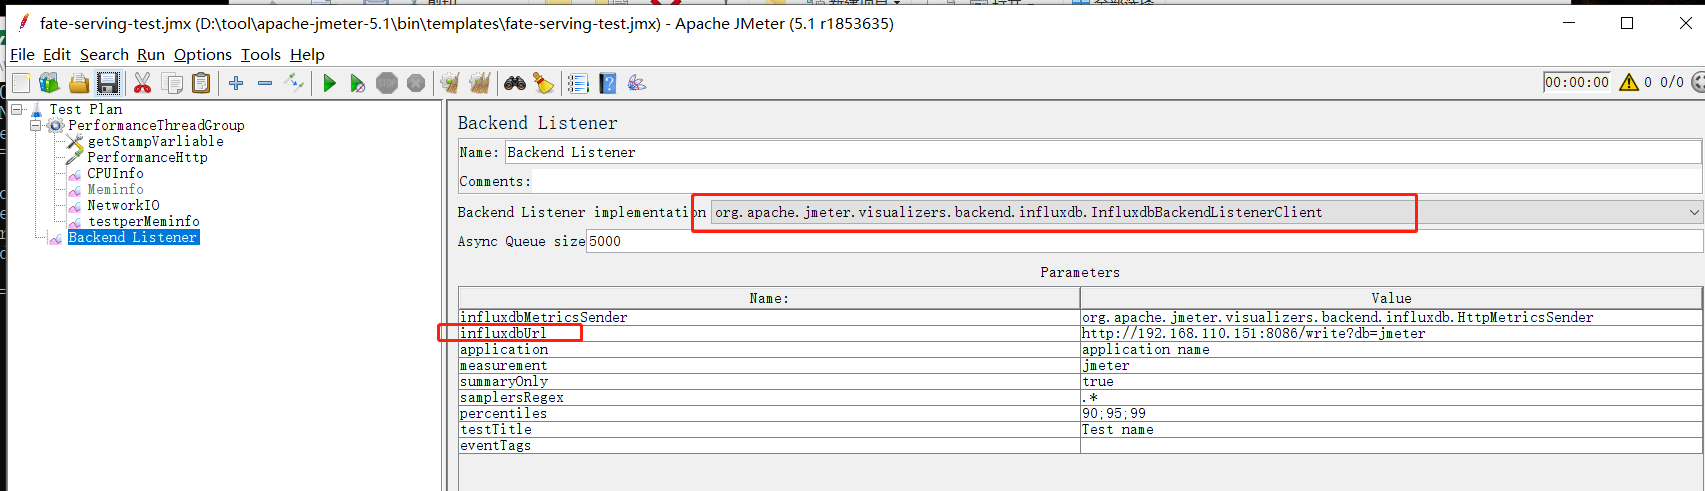
####TPS
####cpu,mem
jmeter+influxdb+granfana+collectd监控cpu+mem+TPS的更多相关文章
- influxDB1.6版安装与配置(windows环境)、Jmeter+influxDB+Grafana性能监控
influxDB1.6版安装与配置(windows环境).Jmeter+influxDB+Grafana性能监控 来源:https://blog.csdn.net/SwTesting/article/ ...
- 全网最详细!Centos7.X 搭建Grafana+Jmeter+Influxdb 性能实时监控平台
背景 日常工作中,经常会用到Jmeter去压测,毕竟LR还要钱(@¥&*...),而最常用的接口压力测试,我们都是通过聚合报告去查看压测结果的,然鹅聚合报告的真的是丑到家了,作为程序猿这当然不 ...
- Centos7.X 搭建Grafana+Jmeter+Influxdb 性能实时监控平台(不使用docker)
工具介绍 [centos7安装influxDB] Influxdata官网下载路径:https://portal.influxdata.com/downloads/ 1.直接执行以下命令安装 2.安装 ...
- Centos8.X 搭建Grafana+Jmeter+Influxdb 性能实时监控平台
前言 本篇文章引用了小菠萝测试笔记,大部分内容非原创,基于自身实操过程中,完善了部分. 本篇随笔是在Linux上搭建的,后面会补充在docker以及k8s上如何部署安装 工具介绍 工具 介绍 Jmet ...
- jmeter+influxdb+grafana性能测试监控
背景: 话说Jmeter原生的监控确实太丑了,听大佬们在讨论Jmeter+InfluxDb+Grafana的监控,于是,为了有一个漂亮的测试报告,就手动开始进行部署. 安装步骤: 1.influxdb ...
- jmeter性能工具 之监控cpu,内存等信息(四)
1.jmeter 本身不支持直接监控 cpu,内存等信息,需要去官网下载控件 JMeterPlugins-Standard-1.4.0.zip 解压好将其中\lib\ext\JMeterPlug ...
- Centos7 搭建Grafana+Jmeter+Influxdb 性能实时监控平台
未完,待更新 背景 日常工作中,经常会用到Jmeter去压测,毕竟LR还要钱(@¥&*...),而最常用的接口压力测试,我们都是通过聚合报告去查看压测结果的,然鹅聚合报告的真的是丑到家了,作为 ...
- 性能测试监控:Jmeter +InfluxDB +collectd +Grafana
虚拟机ip 192.168.180.128 Influxdb Influxdb是一个开源的分布式时序.时间和指标数据库,使用go语言编写,无需外部依赖. 它有三大特性: 时序性(Time Series ...
- Jmeter +InfluxDB +collectd +Grafana16
Jmeter +InfluxDB +collectd +Grafana(十六) 虚拟机ip 192.168.180.128 Influxdb Influxdb是一个开源的分布式时序.时间和指标数据库, ...
随机推荐
- Mysql注入汇总!!!!!!!!!
师傅tpl!!!!! https://xz.aliyun.com/t/7169[对MYSQL注入相关内容及部分Trick的归类小结] https://www.jianshu.com/p/f261125 ...
- SpringBoot之Configuration
在SpringBoot中可以通过@Configuration对某个类注解将该类申明为配置类,以此在代替先前spring版本中配置xml中的功能,并且增加了可读性与维护性.并且在注解类中的类方法中可 ...
- npm vs yarn
npm yarn npm install yarn npm install react --save yarn add react npm uninstall react --save yarn re ...
- Win7最后一天,微软开始慌了!
就在昨天(2020年1月14日),服役十年的Win 7正式退出了微软舞台,从2009推出到2019,这十年也是很多90后的青春. 当然微软官方也做了送别,当然其目的也是为了推广Win10! 甚至面对痛 ...
- 利用MongoDB进行地理坐标查询
BS的应用在生活中已经非常常见,我们打车,叫外卖,查个地图之类的都会查询附近的相关坐标位置,mongodb提供了原生的二维地图查询,极大地方便了大家的开发. 假定我们有一个定义了位置信息的集合loca ...
- H3C 静态路由
一.静态路由简介 静态路由是一种特殊的路由,由管理员手工配置.当网络结构比较简单时,只需配置静态路由就可以使网络正常工作. 静态路由不能自动适应网络拓扑结构的变化.当网络发生故障或者拓扑发生变化后,必 ...
- nginx proxy_set_header Host $host 和 proxy_set_header Host $http_host 的作用对比
转载自https://www.jianshu.com/p/7a8a7eb3707a 1.浏览器直接访问服务,获取到的 Host 包含浏览器请求的 IP 和端口 测试服务器,centos 7 sudo ...
- IntelliJ IDEA 2019.1.3 最新破解教程【最强 可用至2099年】
本文包括最新[2019.1.2]安装 和[2018.3.2](推荐)安装 ①IntelliJ IDEA 2018.3.2安装永久安装[最强] 一. 在官网下载IDEA安装包 链接:https:// ...
- java 学习(day2) 时钟类
看过python的面向对象,所以入手java总的来说还是比较快的. 看视频学习之后写了一个简单的时钟 一个时钟有两部分组成小时和分钟.再大一些还有月,日. 分析一下就是,上述这些属性到达一个值之后,就 ...
- [CF484D] Kindergarten - 贪心
有一组数,你要把他分成若干连续段.每一段的值,定义为这一段 数中最大值与最小值的差. 求一种分法,使得这若干段的值的和最大. N < 1e6, a[i] < 1e9. 朴素的\(O(n^2 ...