
Prometheus 监控 Redis 集群的正确姿势
Prometheus 监控Redis的正确姿势(redis集群)
Prometheus 监控 Redis cluster,其实套路都是一样的,使用 exporter。
exporter 负责采集指标,通过 http 暴露给 Prometheus 拉取。granafa 则通过这些指标绘图展示数据。Prometheus 收集的数据还会根据你设置的告警规则判断是否要发送给 Alertmanager, Alertmanager 则要判断是否要发出告警。
Alertmanager 告警分为三个阶段
- Inactive 触发告警的规则会被发送到这来。
- Pending 你设置的等待时间,即规则里面的 for
- Firing 发送告警到邮件、钉钉之类的
扯远了,开始监控 Redis cluster
redis_exporter 监控 Redis cluster
监控什么应用,使用的相应的 exporter,可以在官网查到。EXPORTERS AND INTEGRATIONS
Redis 使用 redis_exporter ,链接:redis_exporter
支持 Redis 2.x - 5.x
安装及参数
wget https://github.com/oliver006/redis_exporter/releases/download/v1.3.5/redis_exporter-v1.3.5.linux-amd64.tar.gz

tar zxvf redis_exporter-v1.3.5.linux-amd64.tar.gz

cd redis_exporter-v1.3.5.linux-amd64/

./redis_exporter <flags>
redis_exporter 支持的参数很多,对我们有用的就几个。
./redis_exporter --help

Usage of ./redis_exporter:

    -redis.addr string

    	Address of the Redis instance to scrape (default "redis://localhost:6379")

    -redis.password string

    	Password of the Redis instance to scrape

    -web.listen-address string

    	Address to listen on for web interface and telemetry. (default ":9121")
单实例 redis 监控
nohup ./redis_exporter -redis.addr 172.18.11.138:6379 -redis.password xxxxx &
Prometheus 添加单实例
  - job_name: redis_since

    static_configs:

    - targets: ['172.18.11.138:9121']
Redis 集群监控方案
这个挺费劲的,网上查了很多资料,大都是监控单实例的,就这个是集群的,偏偏他的集群是没密码的。
prometheus监控redis集群
我试过的方案:
以下两种都会提示认证失败
level=error msg="Redis INFO err: NOAUTH Authentication required."
方法一
nohup ./redis_exporter -redis.addr 172.18.11.139:7000 172.18.11.139:7001 172.18.11.140:7002 172.18.11.140:7003 172.18.11.141:7004 172.18.11.141:7005 -redis.password xxxxx &
方法二
nohup ./redis_exporter -redis.addr redis://h:Lcsmy.312==/@172.18.11.139:7000 redis://h:Lcsmy.312==/@172.18.11.139:7001 redis://h:Lcsmy.312==/@172.18.11.140:7002 redis://h:Lcsmy.312==/@172.18.11.140:7003 redis://h:Lcsmy.312==/@172.18.11.141:7004 redis://h:Lcsmy.312==/@172.18.11.141:7005 -redis.password xxxxx &
本来想采取最low 的方法,一个实例启一个 redis_exporter。这样子的话,集群那里很多语句都用不了,比如 cluster_slot_fail。放弃该方法
nohup ./redis_exporter -redis.addr 172.18.11.139:7000  -redis.password xxxxxx  -web.listen-address 172.18.11.139:9121 > /dev/null 2>&1 &

nohup ./redis_exporter -redis.addr 172.18.11.139:7001  -redis.password xxxxxx  -web.listen-address 172.18.11.139:9122 > /dev/null 2>&1 &

nohup ./redis_exporter -redis.addr 172.18.11.140:7002  -redis.password xxxxxx  -web.listen-address 172.18.11.139:9123 > /dev/null 2>&1 &

nohup ./redis_exporter -redis.addr 172.18.11.140:7003  -redis.password xxxxxx  -web.listen-address 172.18.11.139:9124 > /dev/null 2>&1 &

nohup ./redis_exporter -redis.addr 172.18.11.141:7004  -redis.password xxxxxx  -web.listen-address 172.18.11.139:9125 > /dev/null 2>&1 &

nohup ./redis_exporter -redis.addr 172.18.11.141:7005  -redis.password xxxxxx  -web.listen-address 172.18.11.139:9126 > /dev/null 2>&1 &
最后只好去 github 提 issue。用我的中国式英语和作者交流,终于明白了。。。其实官方文档已经写了。
scrape_configs:

  ## config for the multiple Redis targets that the exporter will scrape

  - job_name: 'redis_exporter_targets'

    static_configs:

      - targets:

        - redis://first-redis-host:6379

        - redis://second-redis-host:6379

        - redis://second-redis-host:6380

        - redis://second-redis-host:6381

    metrics_path: /scrape

    relabel_configs:

      - source_labels: [__address__]

        target_label: __param_target

      - source_labels: [__param_target]

        target_label: instance

      - target_label: __address__

        replacement: <<REDIS-EXPORTER-HOSTNAME>>:9121

  ## config for scraping the exporter itself

  - job_name: 'redis_exporter'

    static_configs:

      - targets:

        - <<REDIS-EXPORTER-HOSTNAME>>:9121
Redis 集群实际操作
启动 redis_exporter
nohup ./redis_exporter -redis.password xxxxx &
重点
在 prometheus 里面如何配置:
  - job_name: 'redis_exporter_targets'

    static_configs:

      - targets:

        - redis://172.18.11.139:7000

        - redis://172.18.11.139:7001

        - redis://172.18.11.140:7002

        - redis://172.18.11.140:7003

        - redis://172.18.11.141:7004

        - redis://172.18.11.141:7005

    metrics_path: /scrape

    relabel_configs:

      - source_labels: [__address__]

        target_label: __param_target

      - source_labels: [__param_target]

        target_label: instance

      - target_label: __address__

        replacement: 172.18.11.139:9121

  ## config for scraping the exporter itself

  - job_name: 'redis_exporter'

    static_configs:

      - targets:

        - 172.18.11.139:9121
这样子就能采集到集群的数据了。但是日志里提示
time="2019-12-17T09:10:49+08:00" level=error msg="Couldn't connect to redis instance"
午休的时候突然想明白了,只要能连接到一个集群的一个节点,自然就能查询其他节点的指标了。于是启动命令改为:
nohup ./redis_exporter -redis.addr 172.18.11.141:7005 -redis.password xxxxx &
Prometheus 配置不变
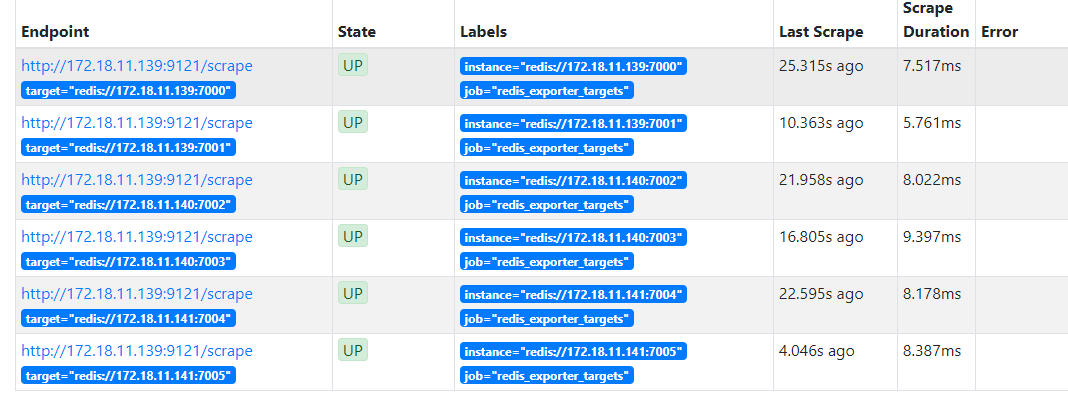
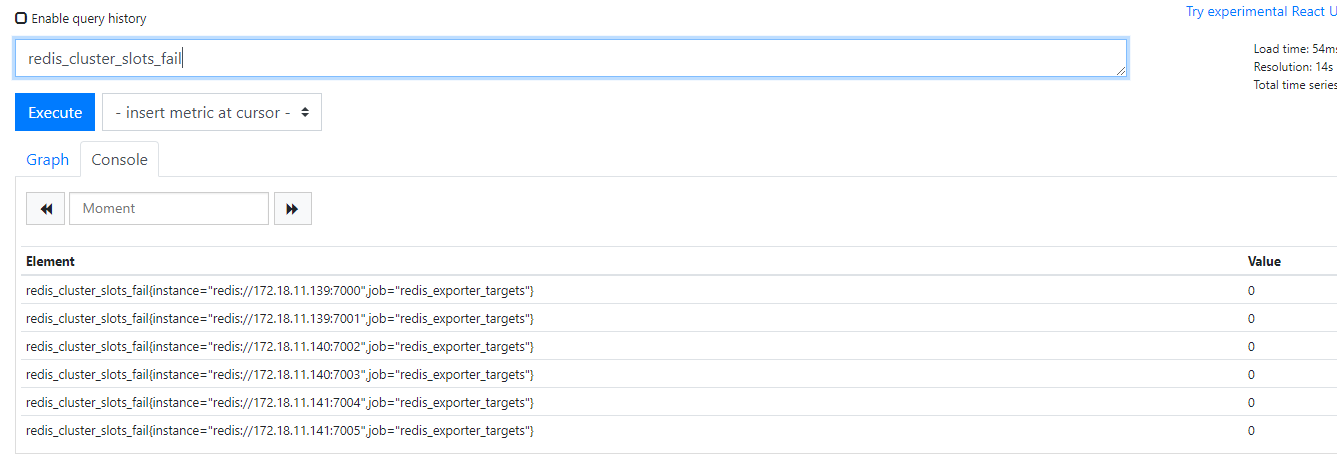
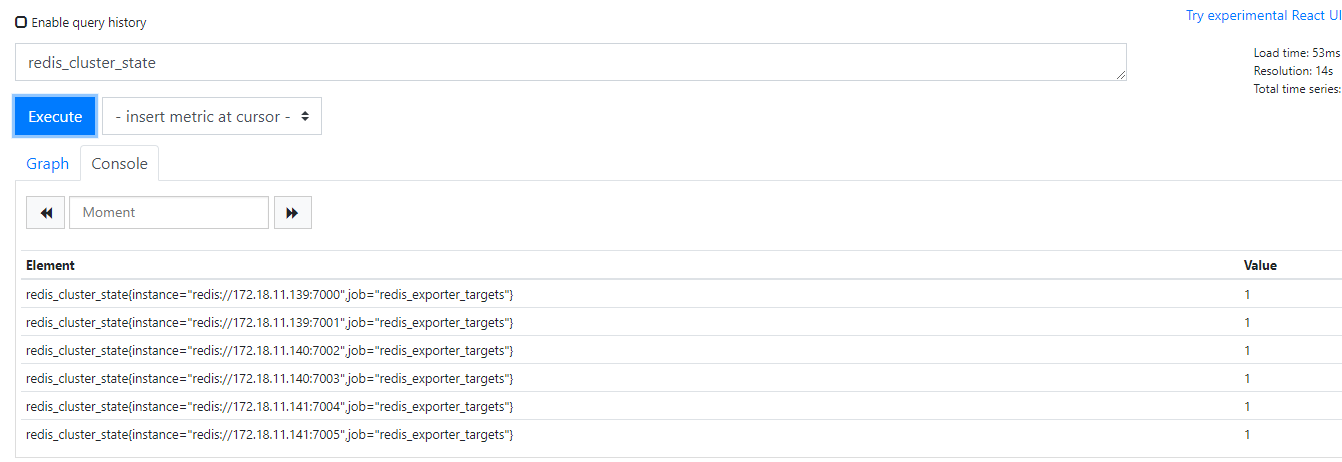
送上几张图片:
告警规则
groups:

- name:  Redis

  rules:

    - alert: RedisDown

      expr: redis_up  == 0

      for: 5m

      labels:

        severity: error

      annotations:

        summary: "Redis down (instance {{ $labels.instance }})"

        description: "Redis 挂了啊,mmp\n  VALUE = {{ $value }}\n  LABELS: {{ $labels }}"

    - alert: MissingBackup

      expr: time() - redis_rdb_last_save_timestamp_seconds > 60 * 60 * 24

      for: 5m

      labels:

        severity: error

      annotations:

        summary: "Missing backup (instance {{ $labels.instance }})"

        description: "Redis has not been backuped for 24 hours\n  VALUE = {{ $value }}\n  LABELS: {{ $labels }}"

    - alert: OutOfMemory

      expr: redis_memory_used_bytes / redis_total_system_memory_bytes * 100 > 90

      for: 5m

      labels:

        severity: warning

      annotations:

        summary: "Out of memory (instance {{ $labels.instance }})"

        description: "Redis is running out of memory (> 90%)\n  VALUE = {{ $value }}\n  LABELS: {{ $labels }}"

    - alert: ReplicationBroken

      expr: delta(redis_connected_slaves[1m]) < 0

      for: 5m

      labels:

        severity: error

      annotations:

        summary: "Replication broken (instance {{ $labels.instance }})"

        description: "Redis instance lost a slave\n  VALUE = {{ $value }}\n  LABELS: {{ $labels }}"

    - alert: TooManyConnections

      expr: redis_connected_clients > 1000

      for: 5m

      labels:

        severity: warning

      annotations:

        summary: "Too many connections (instance {{ $labels.instance }})"

        description: "Redis instance has too many connections\n  VALUE = {{ $value }}\n  LABELS: {{ $labels }}"

    - alert: NotEnoughConnections

      expr: redis_connected_clients < 5

      for: 5m

      labels:

        severity: warning

      annotations:

        summary: "Not enough connections (instance {{ $labels.instance }})"

        description: "Redis instance should have more connections (> 5)\n  VALUE = {{ $value }}\n  LABELS: {{ $labels }}"

    - alert: RejectedConnections

      expr: increase(redis_rejected_connections_total[1m]) > 0

      for: 5m

      labels:

        severity: error

      annotations:

        summary: "Rejected connections (instance {{ $labels.instance }})"

        description: "Some connections to Redis has been rejected\n  VALUE = {{ $value }}\n  LABELS: {{ $labels }}"
Prometheus 监控 Redis 集群的正确姿势的更多相关文章
- Kubernetes集群部署史上最详细(二)Prometheus监控Kubernetes集群
使用Prometheus监控Kubernetes集群 监控方面Grafana采用YUM安装通过服务形式运行,部署在Master上,而Prometheus则通过POD运行,Grafana通过使用Prom ...
- 基于prometheus监控k8s集群
本文建立在你已经会安装prometheus服务的基础之上,如果你还不会安装,请参考:prometheus多维度监控容器 如果你还没有安装库k8s集群,情参考: 从零开始搭建基于calico的kuben ...
- Prometheus 监控K8S集群资源监控
Prometheus 监控K8S集群中Pod 目前cAdvisor集成到了kubelet组件内,可以在kubernetes集群中每个启动了kubelet的节点使用cAdvisor提供的metrics接 ...
- 监控Redis集群,有两种方法
前提条件 redis集群:已搭建三主三从(三台主机) prometheus.grafana已安装 三台主机ip: 192.168.0.39,192.168.0.164,192.168.0.68 第一种 ...
- 监控Redis集群--废弃,使用新教程
prometheus监控redis需要用到redis_exporter. redis_exporter 项目地址:https://github.com/oliver006/redis_exporter ...
- Kubernetes之利用prometheus监控K8S集群
prometheus它是一个主动拉取的数据库,在K8S中应该展示图形的grafana数据实例化要保存下来,使用分布式文件系统加动态PV,但是在本测试环境中使用本地磁盘,安装采集数据的agent使用Da ...
- Prometheus监控elasticsearch集群(以elasticsearch-6.4.2版本为例)
部署elasticsearch集群,配置文件可"浓缩"为以下: cluster.name: es_cluster node.name: node1 path.data: /app/ ...
- 部署prometheus监控kubernetes集群并存储到ceph
简介 Prometheus 最初是 SoundCloud 构建的开源系统监控和报警工具,是一个独立的开源项目,于2016年加入了 CNCF 基金会,作为继 Kubernetes 之后的第二个托管项目. ...
- 如何用prometheus监控k8s集群中业务pod的metrics
一般,我们从网上看到的帖子和资料, 都是用prometheus监控k8s的各项资源, 如api server, namespace, pod, node等. 那如果是自己的业务pod上的自定义metr ...
随机推荐
- 使用 bash 脚本把 GCE 的数据备份到 GCS
目录 一.Google Cloud Storge 介绍 1.1.四种存储类别的比较 1.2.需求 1.3.给虚拟机添加授权认证 二.备份操作 2.1 创建存储分区 2.2 上传对象到存储分区 2.3 ...
- Spark On YARN(Yarn-Cluster模式)启动流程源码分析(二)
转自:https://www.cnblogs.com/yy3b2007com/p/11087180.html 本章将针对yarn-cluster(--master yarn –deploy-mode ...
- 【ABAP系列】SAP ABAP Break Point
公众号:SAP Technical 本文作者:matinal 原文出处:http://www.cnblogs.com/SAPmatinal/ 原文链接:[ABAP系列]SAP ABAP Break P ...
- 一个老程序员PHP程序员说的话(用来提醒自己)
我,一个老程序员,也是一个学生,把玩过甚多语言,大多不精.我既非名牌学校,也不是高学历,仅代表一部分比较蛋疼的人.接触PHP也是很早了,从04年的OFSTAR开始的,到现在六年了,期间也接触过不少的语 ...
- 用Python搞出自己的云词图 | 【带你装起来】
作者:AI算法与图像处理 参考:http://www.sohu.com/a/149657007_236714 云词图简介 什么词云 由词汇组成类似云的彩色图形.“词云”就是对网络文本中出现频率较高的“ ...
- 【VS开发】C/C++预编译命令
C/C++中宏总结C程序的源代码中可包括各种编译指令,这些指令称为预处理命令或预处理器.虽然它们实际上不是C语言的一部分,但却扩展了C程 序设计的环境. 预处理指令的主要作用就是把通过预处理的内建功能 ...
- OpenCV_CS.测试
1.在C#中使用OpenCV(使用OpenCVSharp) - jsxyhelu - 博客园.html(https://www.cnblogs.com/jsxyhelu/p/9669583.html) ...
- 最新 用友网络java校招面经 (含整理过的面试题大全)
从6月到10月,经过4个月努力和坚持,自己有幸拿到了网易雷火.京东.去哪儿.用友网络等10家互联网公司的校招Offer,因为某些自身原因最终选择了用友网络.6.7月主要是做系统复习.项目复盘.Leet ...
- 获取父窗口iframe的ztree对象
问题如下:我要在jqgrid中获取ztree的选中节点对象 var iframe = parent.$("#ztree的iframeId").contents(); var ztr ...
- C语言控制台软件制作
本题要求你写个程序把给定的符号打印成沙漏的形状.例如给定17个“*”,要求按下列格式打印 ***** *** * *** ***** 所谓“沙漏形状”,是指每行输出奇数个符号:各行符号中心对齐:相邻两 ...