Kubernetes之利用prometheus监控K8S集群
prometheus它是一个主动拉取的数据库,在K8S中应该展示图形的grafana数据实例化要保存下来,使用分布式文件系统加动态PV,但是在本测试环境中使用本地磁盘,安装采集数据的agent使用DaemonSet来部署,DaemonSet的特性就是在每个node上部署一个服务进程,这一切都是自动的部署。
此处只讲如何用prometheus来监控K8S集群,关于prometheus的知识参考官方文档。另外有
部署前提: 准备好所需要的文件
$ ls -l

Prometheus/prometheus#:/data/Prometheus/prometheus# ls -l

total 28

drwxr-xr-x 2 root root 4096 Jan 15 02:53 grafana

drwxr-xr-x 2 root root 4096 Jan 15 03:11 kube-state-metrics

-rw-r--r-- 1 root root   60 Jan 14 06:48 namespace.yaml

drwxr-xr-x 2 root root 4096 Jan 15 03:22 node-directory-size-metrics

drwxr-xr-x 2 root root 4096 Jan 15 03:02 node-exporter

drwxr-xr-x 2 root root 4096 Jan 15 02:55 prometheus

drwxr-xr-x 2 root root 4096 Jan 15 02:37 rbac

$ ls grafana/

grafana-configmap.yaml  grafana-core-deployment.yaml  grafana-import-dashboards-job.yaml  grafana-pvc-claim.yaml  grafana-pvc-volume.yaml  grafana-service.yaml

$ ls prometheus/

configmap.yaml  deployment.yaml  prometheus-rules.yaml  service.yaml
grafana和 prometheus 都是部署文件,node-exporter、kube-state-metrics、node-directory-size-metrics这三个是采集器,相当于prometheus的agent
文件准备好了,现在开始一步一步来部署:
1,,创建所需Namespace
因为prometheus 部署的所有的deploy、pod、svc都是在monitoring完成的,所以需要事先创建之。
 $ cat namespace.yaml

 apiVersion: v1

 kind: Namespace

 metadata:

  name: monitoring


 $ kubectl create -f namespace.yaml

 namespace "monitoring" created
2,创建grafana的pv、 pvc
grafana# cat grafana-pvc-volume.yaml

kind: PersistentVolume

apiVersion: v1

metadata:

  name: grafana-pv-volume

  labels:

    type: local

spec:

  storageClassName: grafana-pv-volume

  capacity:

    storage: 10Gi

  accessModes:

    - ReadWriteOnce

  persistentVolumeReclaimPolicy: Recycle

  hostPath:

    path: "/data/volume/grafana"


grafana# cat grafana-pvc-claim.yaml

kind: PersistentVolumeClaim

apiVersion: v1

metadata:

  name: grafana-pvc-volume

  namespace: "monitoring"

spec:

  accessModes:

    - ReadWriteOnce

  resources:

    requests:

      storage: 5Gi

  storageClassName: grafana-pv-volume


$ kubectl create -f grafana/grafana-pvc-volume.yaml -f grafana/grafana-pvc-claim.yaml

persistentvolume "grafana-pv-volume" created

persistentvolumeclaim "grafana-pvc-volume" created

$ kubectl get pvc -n monitoring

NAME          STATUS           VOLUME       CAPACITY   ACCESS MODES   STORAGECLASS     AGE

grafana-pvc-volume   Bound     grafana-pv-volume   10Gi       RWO     grafana-pv-volume   52s


状态bound已绑定到了 grafana-pv-volume
3,创建grafana应用,这些应用都是第三方的,都会有自已的配置,通过configmap来定义
grafana# ls

grafana-configmap.yaml  grafana-core-deployment.yaml  grafana-import-dashboards-job.yaml  grafana-pvc-claim.yaml  grafana-pvc-volume.yaml  grafana-service.yaml

grafana# kubectl create -f ./    #grafana目录下所有文件都创建

configmap "grafana-import-dashboards" created

deployment "grafana-core" created

job "grafana-import-dashboards" created

service "grafana" created

grafana# kubectl get deployment,pod -n monitoring

NAME                  DESIRED   CURRENT   UP-TO-DATE   AVAILABLE   AGE

deploy/grafana-core   1         1         1            0           1m

NAME                              READY     STATUS              RESTARTS   AGE

po/grafana-core-9c7f66868-7q8lx   0/1       ContainerCreating   0          1m

运行po/grafana-core 容器时会下载镜像: grafana/grafana:4.2.0
grafana创建的应用 简单的自已描述了下:
      grafana-pv-volume=/data/volume/grafana =10G

      grafana-pvc-volume=5G--->grafana-pv-volume

      ---configmap=grafana-import-dashboards

      Job=grafana-import-dashboards


      Deployment=grafana-core     replicas: 1  containers=grafana-core   mount:  grafana-pvc-volume:/var

      service=grafana     port: 3000  = nodePort: 30161     (3000是grafana服务的默认端口)
4, 现在grafana的核心应用已部署好了,现在来部署prometheus的RBAC
prometheus/rbac# ls

grant_serviceAccount.sh  prometheus_rbac.yaml

#先创建RBAC文件:

prometheus/rbac# kubectl create -f prometheus_rbac.yaml

clusterrolebinding "prometheus-k8s" created

clusterrolebinding "kube-state-metrics" created

clusterrole "kube-state-metrics" created

serviceaccount "kube-state-metrics" created

clusterrolebinding "prometheus" created

clusterrole "prometheus" created

serviceaccount "prometheus-k8s" created

prometheus/rbac#
5,创建prometheus的deloyment,service
prometheus/prometheus# ls

configmap.yaml  deployment.yaml  prometheus-rules.yaml  service.yaml

prometheus/prometheus#

在configmap.yaml中要注意的是在1.7以后,获取cadvsion监控pod等的信息时,用的是kubelet的4194端口,

注意以下这段:这是采集cadvision信息,必须是通过kubelet的4194端口,所以Kubelet必须监听着,4194部署了cadvsion来获取pod中容器信息

prometheus/prometheus#cat configmap.yaml

 # https://github.com/prometheus/prometheus/blob/master/documentation/examples/prometheus-kubernetes.yml#L37

      - job_name: 'kubernetes-nodes'

        tls_config:

          ca_file: /var/run/secrets/kubernetes.io/serviceaccount/ca.crt

        bearer_token_file: /var/run/secrets/kubernetes.io/serviceaccount/token

        kubernetes_sd_configs:

          - role: node

        relabel_configs:

          - source_labels: [__address__]

            regex: '(.*):10250'

            replacement: '${1}:10255'

            target_label: __address__

      - job_name: 'kubernetes-cadvisor'

        scheme: https

        tls_config:

          ca_file: /var/run/secrets/kubernetes.io/serviceaccount/ca.crt

        bearer_token_file: /var/run/secrets/kubernetes.io/serviceaccount/token

        kubernetes_sd_configs:

          - role: node

        relabel_configs:

        - action: labelmap

          regex: __meta_kubernetes_node_label_(.+)

        - target_label: __address__

          replacement: kubernetes.default.svc.cluster.local:443

        - source_labels: [__meta_kubernetes_node_name]

          regex: (.+)

          target_label: __metrics_path__

          replacement: /api/v1/nodes/${1}:4194/proxy/metrics

      # https://github.com/prometheus/prometheus/blob/master/documentation/examples/prometheus-kubernetes.yml#L79
prometheus-rules.yaml 这是它的发现规则文件
deployment.yaml service.yaml 这两个是部署的文件, deployment部署中资源限制建议放大一点
现在部署prometheus目录下所有文件:
prometheus/prometheus# kubectl create -f ./

configmap "prometheus-core" created

deployment "prometheus-core" created

configmap "prometheus-rules" created

service "prometheus" created

prometheus/prometheus#

prometheus/prometheus# kubectl get deployment,pod -n monitoring

NAME                     DESIRED   CURRENT   UP-TO-DATE   AVAILABLE   AGE

deploy/grafana-core      1         1         1            1           16m

deploy/prometheus-core   1         1         1            1           1m

NAME                                  READY     STATUS    RESTARTS   AGE

po/grafana-core-9c7f66868-wm68j       1/1       Running   0          16m

po/prometheus-core-6dc6777c5b-5nc7j   1/1       Running   0          1m
prometheus应用的部署,简单描述下创建的内容:
    Deployment= prometheus-core   replicas: 1    containers=prometheus   image: prom/prometheus:v1.7.0    containerPort: 9090(webui)

    Service    name: prometheus   NodePort-->port: 9090 -webui
6,prometheus部署完了现在来部署它的agent,也就是采集器:
Prometheus/prometheus# ls node-directory-size-metrics/

daemonset.yaml

Prometheus/prometheus# ls kube-state-metrics/

deployment.yaml  service.yaml

Prometheus/prometheus# ls node-exporter/

exporter-daemonset.yaml  exporter-service.yaml

Prometheus/prometheus#

#其中两个用的是daemonset

Prometheus/prometheus# kubectl create -f node-exporter/ -f kube-state-metrics/ -f node-directory-size-metrics/

daemonset "prometheus-node-exporter" created

service "prometheus-node-exporter" created

deployment "kube-state-metrics" created

service "kube-state-metrics" created

daemonset "node-directory-size-metrics" created

Prometheus/prometheus#

Prometheus/prometheus# kubectl get deploy,pod,svc -n monitoring

NAME                        DESIRED   CURRENT   UP-TO-DATE   AVAILABLE   AGE

deploy/grafana-core         1         1         1            1           26m

deploy/kube-state-metrics   2         2         2            2           1m

deploy/prometheus-core      1         1         1            1           11m

NAME                                     READY     STATUS    RESTARTS   AGE

po/grafana-core-9c7f66868-wm68j          1/1       Running   0          26m

po/kube-state-metrics-694fdcf55f-bqcp8   1/1       Running   0          1m

po/kube-state-metrics-694fdcf55f-nnqqd   1/1       Running   0          1m

po/node-directory-size-metrics-n9wx7     2/2       Running   0          1m

po/node-directory-size-metrics-ppscw     2/2       Running   0          1m

po/prometheus-core-6dc6777c5b-5nc7j      1/1       Running   0          11m

po/prometheus-node-exporter-kchmb        1/1       Running   0          1m

po/prometheus-node-exporter-lks5m        1/1       Running   0          1m

NAME                           TYPE        CLUSTER-IP      EXTERNAL-IP   PORT(S)          AGE

svc/grafana                    NodePort    10.254.231.25   <none>        3000:30161/TCP   26m

svc/kube-state-metrics         ClusterIP   10.254.156.51   <none>        8080/TCP         1m

svc/prometheus                 NodePort    10.254.239.90   <none>        9090:37318/TCP   10m

svc/prometheus-node-exporter   ClusterIP   None            <none>        9100/TCP         1m

Prometheus/prometheus#

--------

Prometheus/prometheus# kubectl get pod -o wide -n monitoring

NAME                                  READY     STATUS    RESTARTS   AGE       IP             NODE

prometheus-node-exporter-kchmb        1/1       Running   0          4m        10.3.1.16      10.3.1.16

prometheus-node-exporter-lks5m        1/1       Running   0          4m        10.3.1.17      10.3.1.17

#这两个是exporter,用的是daemonset 分别在这两个node上运行了。这样就可以采集到所有数据了。
如上部署完成,以下是用自已的话简单描述下:
 node-exporter/exporter-daemonset.yaml 文件:

       DaemonSet=prometheus-node-exporter

          containers: name: prometheus-node-exporter    image: prom/node-exporter:v0.14.0

          containerPort: 9100   hostPort: 9100  hostNetwork: true    #它用的是主机的9100端口


		Prometheus/prometheus/node-exporter# kubectl get  daemonset,pod -n monitoring

		NAME                             DESIRED   CURRENT   READY     UP-TO-DATE   AVAILABLE   NODE SELECTOR   AGE

		ds/node-directory-size-metrics   2         2         2         2            2           <none>          16h

		ds/prometheus-node-exporter      2         2         2         2            2           <none>          16h

           因为它是daemonset,所以相应的也会运行着两个Pod: prometheus-node-exporter

      Service=prometheus-node-exporter   clusterIP: None   port: 9100  type: ClusterIP   #它没有clusterIP


	# kubectl get  service -n monitoring

	NAME                       TYPE        CLUSTER-IP      EXTERNAL-IP   PORT(S)          AGE

	prometheus-node-exporter   ClusterIP   None            <none>        9100/TCP         16h
kube-state-metrics/deployment.yaml 文件:

      Deployment=kube-state-metrics replicas: 2   containers-->name: kube-state-metrics  image: gcr.io/google_containers/kube-state-metrics:v0.5.0

                 containerPort: 8080


      Service     name: kube-state-metrics   port: 8080  #没有映射

                                 #kubectl get deployment,pod,svc -n monitoring

			NAME                        DESIRED   CURRENT   UP-TO-DATE   AVAILABLE   AGE

			deploy/kube-state-metrics   2         2         2            2           16h

			NAME                                     READY     STATUS    RESTARTS   AGE

			po/kube-state-metrics-694fdcf55f-2mmd5   1/1       Running   0          11h

			po/kube-state-metrics-694fdcf55f-bqcp8   1/1       Running   0          16h

			NAME                           TYPE        CLUSTER-IP      EXTERNAL-IP   PORT(S)          AGE

			svc/kube-state-metrics         ClusterIP   10.254.156.51   <none>        8080/TCP         16h
node-directory-size-metrics/daemonset.yaml 文件:

        #因为是daemonset,所以未定义replicas数量,直接运行在每个node之上,但是它没有创建service

      DaemonSet : name: node-directory-size-metrics

                  containers-->name: read-du  image: giantswarm/tiny-tools   mountPath: /mnt/var   mountPath: /tmp

                  containers--> name: caddy    image: dockermuenster/caddy:0.9.3 containerPort: 9102

                               mountPath: /var/www   hostPath /var


		kubectl get daemonset,pod,svc -n monitoring

		NAME                             DESIRED   CURRENT   READY     UP-TO-DATE   AVAILABLE   NODE SELECTOR   AGE

		ds/node-directory-size-metrics   2         2         2         2            2           <none>          16h

		NAME                                     READY     STATUS    RESTARTS   AGE

		po/node-directory-size-metrics-n9wx7     2/2       Running   0          16h

		po/node-directory-size-metrics-ppscw     2/2       Running   0          16h

		NAME                           TYPE        CLUSTER-IP      EXTERNAL-IP   PORT(S)          AGE

                     没有node-directory-size-metrics的service
到此 prometheus算是部署完成了,最后来看下它暴露的端口:
Prometheus/prometheus# kubectl get svc -o wide -n monitoring

NAME                       TYPE        CLUSTER-IP      EXTERNAL-IP   PORT(S)          AGE       SELECTOR

grafana                    NodePort    10.254.231.25   <none>        3000:30161/TCP   31m       app=grafana,component=core

kube-state-metrics         ClusterIP   10.254.156.51   <none>        8080/TCP         6m        app=kube-state-metrics

prometheus                 NodePort    10.254.239.90   <none>        9090:37318/TCP   16m       app=prometheus,component=core

prometheus-node-exporter   ClusterIP   None            <none>        9100/TCP         6m        app=prometheus,component=node-exporter

Prometheus/prometheus#
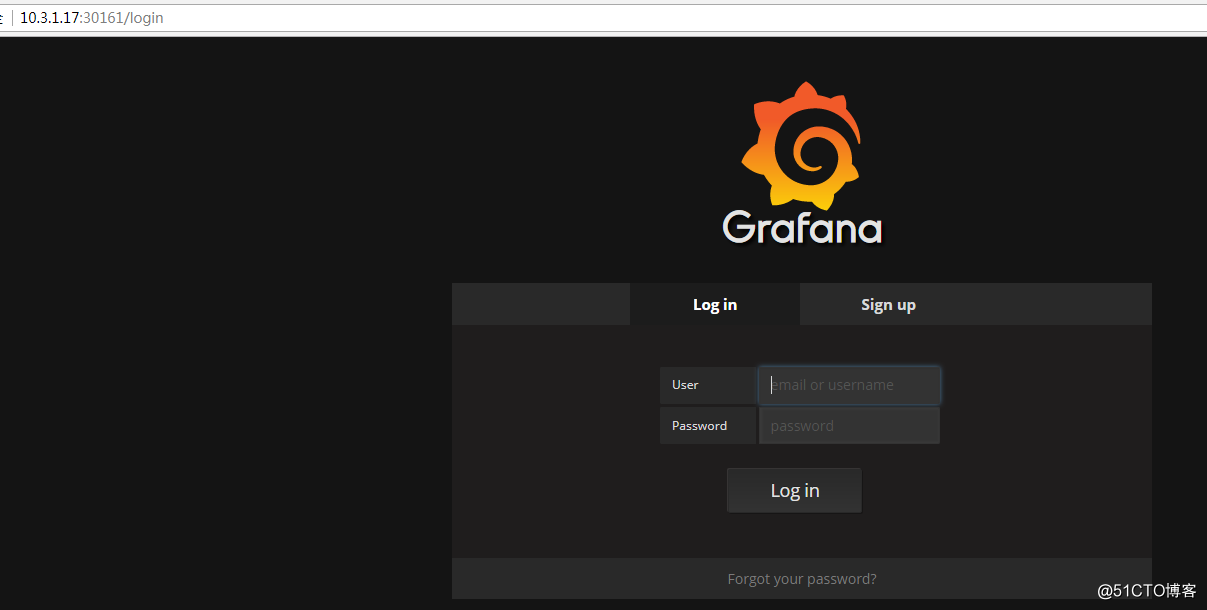
7,访问、使用prometheus
如上可以看到grafana的端口号是30161,NodeIP:30161 就可以打开grafana,默认admin/admin
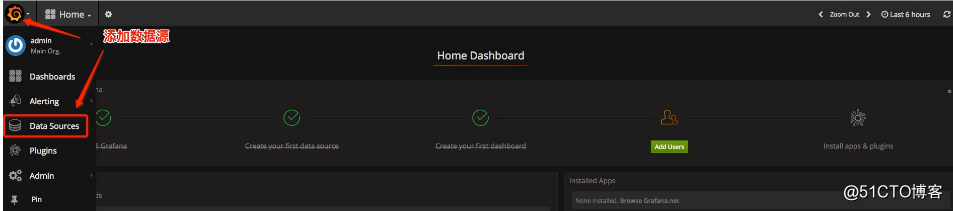
登录后,添加数据源:
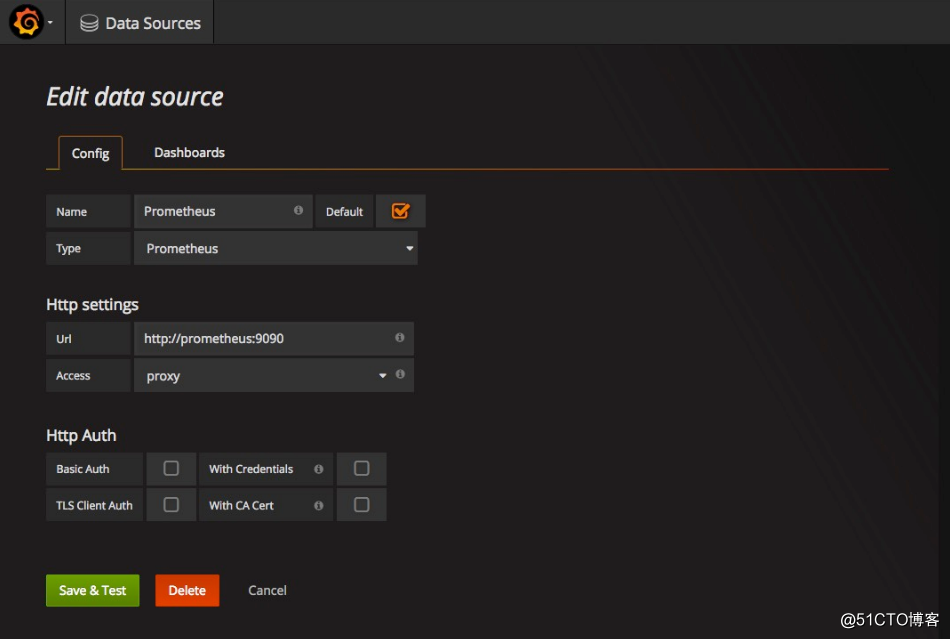
添加Prometheus的数据源:
将Prometheus的作为数据源的相关参数如下图所示:
添加完后,导入模板文件:
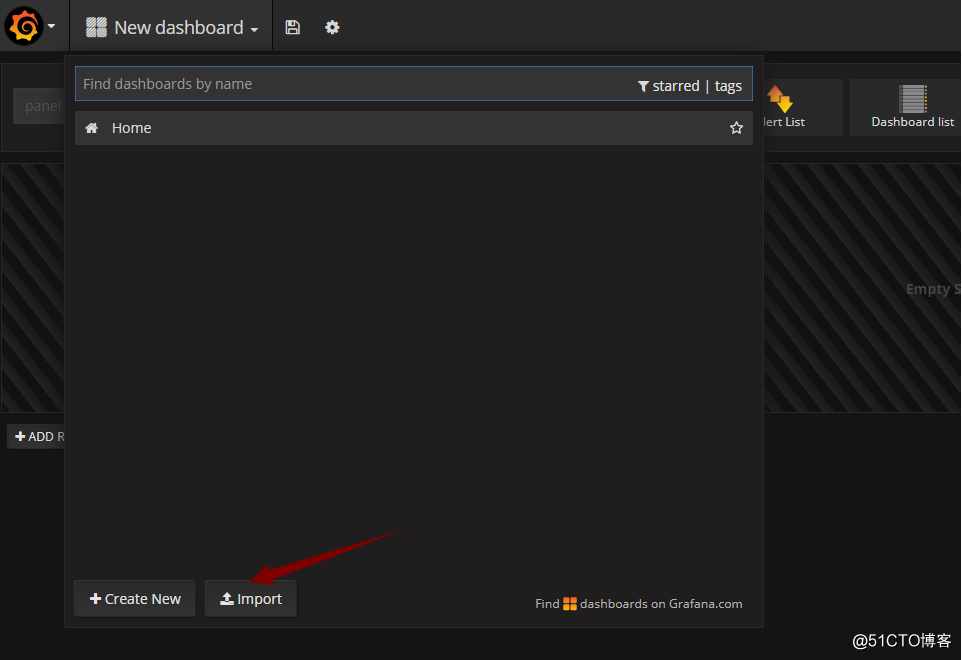
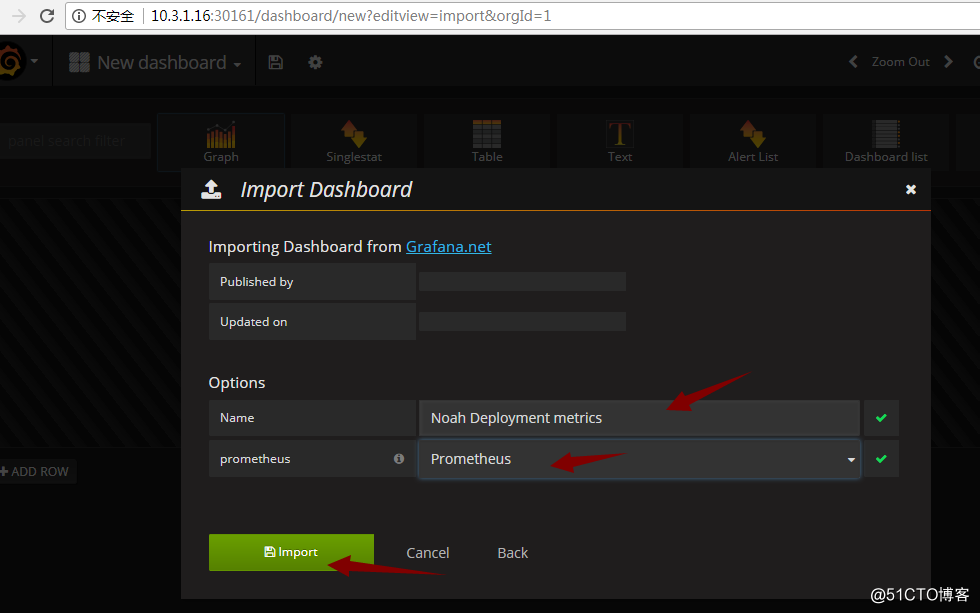
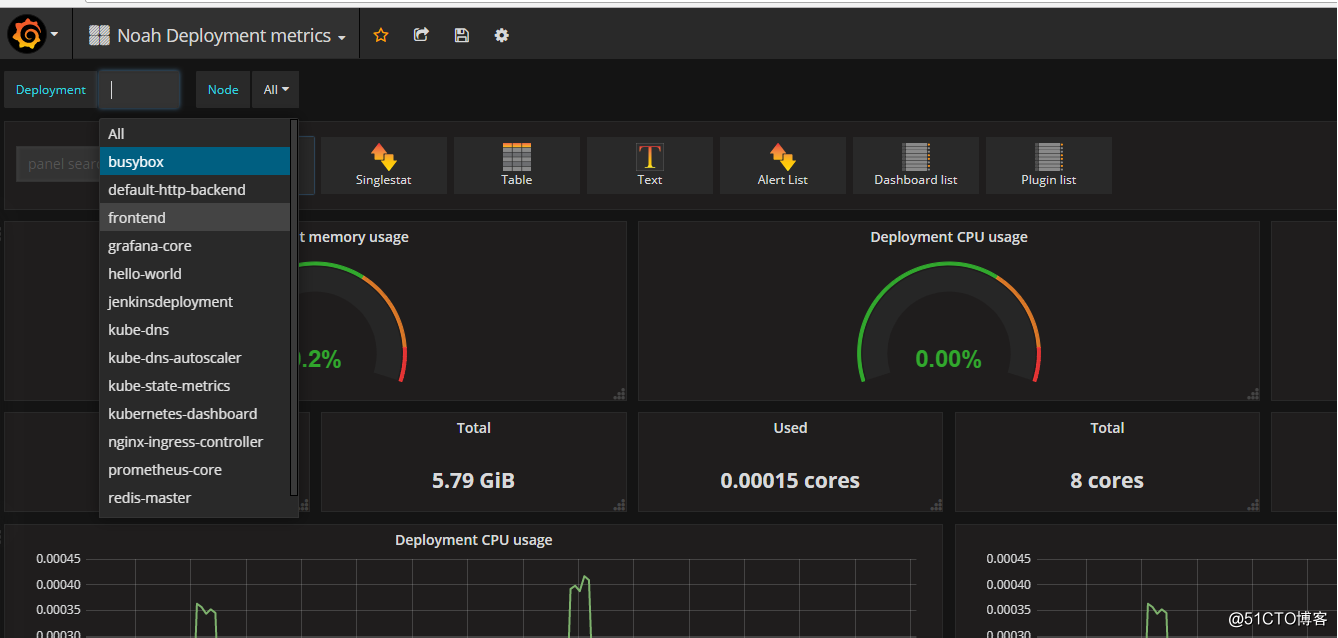
部署完成。
Kubernetes之利用prometheus监控K8S集群的更多相关文章
- 基于prometheus监控k8s集群
本文建立在你已经会安装prometheus服务的基础之上,如果你还不会安装,请参考:prometheus多维度监控容器 如果你还没有安装库k8s集群,情参考: 从零开始搭建基于calico的kuben ...
- Prometheus 监控K8S集群资源监控
Prometheus 监控K8S集群中Pod 目前cAdvisor集成到了kubelet组件内,可以在kubernetes集群中每个启动了kubelet的节点使用cAdvisor提供的metrics接 ...
- 如何用prometheus监控k8s集群中业务pod的metrics
一般,我们从网上看到的帖子和资料, 都是用prometheus监控k8s的各项资源, 如api server, namespace, pod, node等. 那如果是自己的业务pod上的自定义metr ...
- 如何使用helm优雅安装prometheus-operator,并监控k8s集群微服务
前言:随着云原生概念盛行,对于容器.服务.节点以及集群的监控变得越来越重要.Prometheus 作为 Kubernetes 监控的事实标准,有着强大的功能和良好的生态.但是它不支持分布式,不支持数据 ...
- Prometheus 监控 Redis 集群的正确姿势
Prometheus 监控Redis的正确姿势(redis集群) Prometheus 监控 Redis cluster,其实套路都是一样的,使用 exporter. exporter 负责采集指标, ...
- shell脚本监控k8s集群job状态,若出现error通过触发阿里云的进程监控报警
#!/bin/bash while [ 1 ] do job_error_no=`kubectl get pod -n weifeng |grep -i "job"|grep -c ...
- Kubernetes 学习3 kubeadm初始化k8s集群
一.k8s集群 1.k8s整体架构图 2.k8s网络架构图 二.基于kubeadm安装k8s步骤 1.master,nodes:安装kubelet,kubeadm,docker 2.master: k ...
- Prometheus神器之监控K8s集群
Prometheus 简介 Prometheus是SoundCloud开源的一款开源软件.它的实现参考了Google内部的监控实现,与源自Google的Kubernetes结合起来非常合适.另外相比i ...
- Prometheus监控elasticsearch集群(以elasticsearch-6.4.2版本为例)
部署elasticsearch集群,配置文件可"浓缩"为以下: cluster.name: es_cluster node.name: node1 path.data: /app/ ...
随机推荐
- python判断文件和文件夹是否存在、没有则创建文件夹
原文出处:https://www.cnblogs.com/hushaojun/p/4533241.html >>> import os >>> os.path.ex ...
- 数据库——SQL数据定义
数据定义 SQL的数据定义语句 操 作 对 象 操 作 方 式 创 建 删 除 修 改 表 CREATE TABLE DROP TABLE ALTER TABLE 视 图 CREATE ...
- Sprint10
进展:设置事件提醒部分已经完成,接下来是实现完成后在添加主界面显示已添加的事件及时间,并可设置可用与不可用.
- Task 6.3 冲刺Two之站立会议2
今天主要将聊天的主界面加以改善,添加了用户登陆后的提示,实现了好友的增删和查询以及自己的账号的个人信息,也可以使用户实现对自己的头像以及个性签名.个人信息等的管理.
- WebGL学习笔记四点一
上一章是对图形的变换,这一章的第一节主要介绍了光栅化的过程,在创建多个颜色的三角形的过程中顶点着点器的过程如下 ,1.首先通过attribute的变量从javascript中获取数据,根据drawAr ...
- 软工1816 · 作业(十二)Beta答辩总结
组长博客 宣传视频 github团队项目仓库 本组成员 队员姓名与学号 124 王彬(组长) 206 赵畅 215 胡展瑞 320 李恒达 131 佘岳昕 431 王源 206 陈文垚 209 陈志炜 ...
- 【图论】POJ-3255 次短路径
一.题目 Description Bessie has moved to a small farm and sometimes enjoys returning to visit one of her ...
- Week2-作业1——关于阅读《构建之法》第1、2、16章的疑问与感悟
关于阅读<构建之法>第1.2.16章的疑问与感悟 术语解释: 第2章,23页 什么是代码覆盖率? ———————————————————— 在测试中的代码覆盖率是指,你运行测试用例后,走过 ...
- P4安装
P4安装篇 ubuntu 14.04为例子 一.首先要fork到自己的github里面 源码目录 https://github.com/p4lang/p4factory 然后fork到自己的githu ...
- jieba库的应用
#!/usr/bin/python# -*- coding:utf-8 -*- import imp,sys imp.reload(sys)from matplotlib.font_manager i ...