Linux监控工具介绍系列——free
在Linux系统中,我们查看、监控系统内存使用情况,一般最常用的命令就是free。free命令其实非常简单,参数也非常简单,但是里面很多知识点未必你都掌握了。下面总结一下我所了解的free命令。如有不足,敬请指出。文章很多知识点参考了下面参考资料,都是在这些前辈文章的基础上所做的一个验证和总结。
free命令介绍
free命令是一个显示系统中空闲和已用内存大小的工具。大多数Linux发行版都包含有free命令,但是版本可能不一样。free 命令使用/proc/meminfo中的值作为基准来显示内存利用率信息。free命令的英文介绍:free - displays the total amount of free and used physical and swap memory in the system, as well as the buffers used by the kernel. The shared memory column represents the ’Shmem’ value. The available memory column represents the ’MemAvailable’ value.
free参数介绍
你可以在控制台下输入man free命令查看更多关于free命令的信息。另外你可以使用下面命令获取free的使用信息(虽然是一个无效参数)
[root@localhost ~]# free --help
free: invalid option -- '-'
usage: free [-b|-k|-m|-g] [-l] [-o] [-t] [-s delay] [-c count] [-V]
-b,-k,-m,-g show output in bytes, KB, MB, or GB
-l show detailed low and high memory statistics
-o use old format (no -/+buffers/cache line)
-t display total for RAM + swap
-s update every [delay] seconds
-c update [count] times
-a show available memory if exported by kernel (>80 characters per line)
-V display version information and exit
free命令的参数有下面一些,不同版本可能有所区别(procps version 3.2.8):
|
参数 |
功能 |
|
-b -k -m -g |
分别以Byte、KB、MB、GB为单位显示内存的使用情况 |
|
-l |
show detailed low and high memory statistics |
|
-o |
使用旧的格式显示内存的使用信息,没有描述 -/+buffers/cache信息这一行。 |
|
-t |
显示内存总和列 |
|
-s |
<间隔秒数> 持续观察内存使用状况。 |
|
-c |
结合参数-s使用,表示更新多少次。update [count] times |
|
-a |
show available memory if exported by kernel (>80 characters per line) |
|
-V |
显示free命令版本信息并退出该命令 |
例子:
1:以MB为单位显示内存的使用情况
[root@localhost ~]# free -m
total used free shared buffers cached
Mem: 11912 957 10955 1 167 498
-/+ buffers/cache: 291 11620
Swap: 12287 0 12287
[root@localhost ~]#
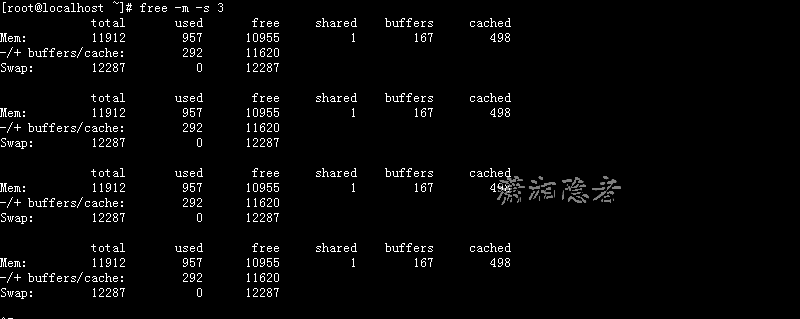
2:每隔3秒显示内存的使用信息
[root@localhost ~]# free -m -s 3
total used free shared buffers cached
Mem: 11912 957 10955 1 167 498
-/+ buffers/cache: 292 11620
Swap: 12287 0 12287
total used free shared buffers cached
Mem: 11912 957 10955 1 167 498
-/+ buffers/cache: 292 11620
Swap: 12287 0 12287
total used free shared buffers cached
Mem: 11912 957 10955 1 167 498
-/+ buffers/cache: 292 11620
Swap: 12287 0 12287
total used free shared buffers cached
Mem: 11912 957 10955 1 167 498
-/+ buffers/cache: 292 11620
Swap: 12287 0 12287
3:显示内存总和列
[root@localhost ~]# free -mt
total used free shared buffers cached
Mem: 11912 957 10955 1 167 498
-/+ buffers/cache: 292 11620
Swap: 12287 0 12287
Total: 24200 957 23243
[root@localhost ~]#

4:显示高低内存利用率
[root@localhost ~]# free -ml
total used free shared buffers cached
Mem: 11912 957 10955 1 167 498
Low: 11912 957 10955
High: 0 0 0
-/+ buffers/cache: 292 11620
Swap: 12287 0 12287
[root@localhost ~]#
5:每2秒显示一次内存使用情况,一共显示3次
[root@localhost ~]# free -s 2 -c 3
total used free shared buffers cached
Mem: 12198496 981976 11216520 1176 171260 510160
-/+ buffers/cache: 300556 11897940
Swap: 12582908 0 12582908
total used free shared buffers cached
Mem: 12198496 981976 11216520 1176 171260 510160
-/+ buffers/cache: 300556 11897940
Swap: 12582908 0 12582908
total used free shared buffers cached
Mem: 12198496 981976 11216520 1176 171260 510160
-/+ buffers/cache: 300556 11897940
Swap: 12582908 0 12582908
free指标介绍
free命令一般显示4行信息,使用参数-t则会显示5行信息(-l 参数会显示6行)。你是否真正理解每一项指标的意义呢?这个我觉得可能不少人不甚了解。那么下面就来看看free命令输出信息的具体含义吧:
1:第一行从全局角度描述系统使用的内存状况:
|
指标 |
指标意义 |
|
total |
总的物理内存大小。total=used + free |
|
used |
已经使用的物理内存。一般情况这个值比较大。used=buffers + cached (maybe add shared also)+ -buffers/cache(used) |
|
free |
完全未使用的物理内存 |
|
shared |
应用程序共享的物理内存 |
|
buffers |
缓存,主要用于块设备缓存,例如用户目录、inode值等(ls大目录可以看到这个值增加) |
|
cached |
缓存,主要用于缓存文件。 |
相信很多人和我一样,对buffers 和cached有点混淆不清。下面是对buffers和cached的一个较权威的解释。
buffers是指用来给块设备做的缓冲大小,它只记录文件系统的metadata以及 tracking in-flight pages.
cached是用来给文件做缓冲。
那就是说:buffers是用来存储目录里面有什么内容,权限等等。而cached直接用来缓存我们打开的文件
下面是关于buffers和cached的英文资料:
Buffers are associated with a specific block device, and cover caching of filesystem metadata as well as tracking in-flight pages. The cache only contains parked file data. That is, the buffers remember what's in directories, what file permissions are, and keep track of what memory is being written from or read to for a particular block device. The cache only contains the contents of the files themselves.
也就是说buffers是用于存放要输出到disk的块设备数据的,而cache是存放从disk上读出的数据。这二者是为了提高IO性能的,并由OS管理。
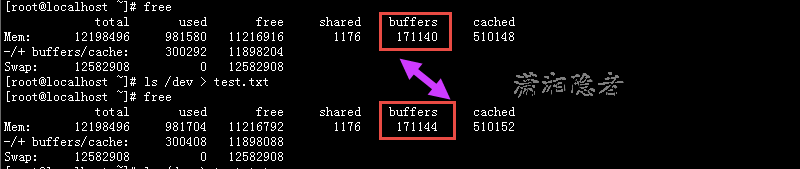
下面我们可以使用ls /dev命令来验证一下buffers增加的实验测试。如下所示。buffers从171140增加到了171144
关于cached,当应用程序读写文件的时候,Linux内核为了提高读写效率与速度,会将文件在内存中进行缓存,这部分内存就是Cache Memory(缓存内存)。即使你的程序运行结束后,Cache Memory也不会自动释放。这就会导致你在Linux系统中程序频繁读写文件后,你会发现可用物理内存变少。前阵子我就碰到这样一个案例,有位网友说他服务器上没有跑什么应用程序,但是内存都被耗尽了。其实真正的原因只是内存被用来做buffer和cached缓存数据了,而他不了解情况,以为free列就是剩余的内存,以为内存被耗尽了。如果free部分很小,但是buffer和cached部分较大的话,完全没有必要担心,缓存内存(Cache Memory)在你需要使用内存的时候会自动释放。
Linux always tries to use RAM to speed up disk operations by using available memory for buffers (file system metadata) and cache (pages with actual contents of files or block devices). This helps the system to run faster because disk information is already in memory which saves I/O operations. If space is needed by programs or applications like Oracle, then Linux will free up the buffers and cache to yield memory for the applications. If your system runs for a while you will usually see a small number under the field "free" on the first line.
关于buffers与cached,Don't Panic! Your ram is fine! 这篇文章对这个有个非常有意思的描述。我简单翻译一下,大家对比英文看看吧
What's going on?
Linux is borrowing unused memory for disk caching. This makes it looks like you are low on memory, but you are not! Everything is fine!
Linux系统从空闲的内存借用内存来做磁盘数据缓存。这个导致你的系统看起来处于内存非常紧急的情况。但是实际上不是这样。一切都非常正常。
Why is it doing this?
Disk caching makes the system much faster! There are no downsides, except for confusing newbies. It does not take memory away from applications in any way, ever!
磁盘数据缓存让Linux运行得更快。它不会也永远不会从应用程序程序拿走内存。它没有任何缺点,只是会混淆新手。
What if I want to run more applications?
If your applications want more memory, they just take back a chunk that the disk cache borrowed. Disk cache can always be given back to applications immediately! You are not low on ram!
如果你的应用程序需要更多的内存,他们会收回一部分用作磁盘数据缓存(disk cache)的物理内存。磁盘数据缓存能很快的将内存返回给应用程序使用。
Do I need more swap?
No, disk caching only borrows the ram that applications don't currently want. It will not use swap. If applications want more memory, they just take it back from the disk cache. They will not start swapping.
不, 磁盘数据缓存只会从应用程序哪里借用不需要使用的物理内存。它不会使用交换分区。如果应用程序需要跟多内存。他们会从磁盘数据缓存里面拿回需要的物理内存。它们将不启动交换。
How do I stop Linux from doing this?
You can't disable disk caching. The only reason anyone ever wants to disable disk caching is because they think it takes memory away from their applications, which it doesn't! Disk cache makes applications load faster and run smoother, but it NEVER EVER takes memory away from them! Therefore, there's absolutely no reason to disable it!
Disk caching是不能禁用的。但是可以使用下面命令释放memory cached:
To free pagecache:
echo 1 > /proc/sys/vm/drop_caches
To free dentries and inodes:
echo 2 > /proc/sys/vm/drop_caches
To free pagecache, dentries and inodes:
echo 3 > /proc/sys/vm/drop_caches
2: 第二行则是第一行各个指标的值:
3: 第三行描述应用程序的内存使用情况:
|
指标 |
指标意义 |
|
前个值表示-buffers/cache |
应用程序使用的内存大小,used减去缓存值:-buffers/cache=used-buffers-cached |
|
后个值表示+buffers/cache |
所有可供应用程序使用的内存大小,free加上缓存值:+buffers/cache=free+buffers+cached |
4: 第四行描述swap使用情况:
|
指标 |
指标意义 |
|
total |
全部交换分区(swap) |
|
used |
已使用交换分区(swap) |
|
free |
未使用交换分区(swap) |
如下图所示,我们来验证一下各指标的关系,看看各指标是否如上述公式所将的那样:

total = used + free
12198496 = 982224 + 11216272
used = buffers + cached (maybe add shared also) + -buffers/cache(used):
982224 =171412 + 510180 + 300632
-buffers/cache(used) 表示第三行的used列的值。-buffers/cache(free) 表示第三行free列的值。
-buffers/cache(used) = used - buffers - cached
-buffers/cache(free) = free+buffers+cached
11897864 = 11216272 + 171412 + 510180
参考资料:
https://linux.cn/article-2443-1.html
http://www.cnblogs.com/ggjucheng/archive/2012/01/08/2316438.html
Linux监控工具介绍系列——free的更多相关文章
- Linux监控工具介绍系列——OSWatcher Black Box
OSWatcher Balck Box简介 OSWatcher Black Box (oswbb)是Oracle开发.提供的一个小巧,但是实用.强大的系统工具,它可以用来抓取操作系统的性能指标,用 ...
- Linux监控工具介绍系列——vmstat
说来惭愧,玩Linux这么久了,居然没有玩转vmstat这个命令,对很多指标的具体意义都有点模糊不清,花了点时间好好学习.整理一下这个命令的相关资料.因为这个命令确实比较重要,而且频繁用到. 命令 ...
- Linux监控工具介绍系列——smem
smem工具介绍 smem是Linux系统上的一款可以生成多种内存耗用报告的命令行工具.与现有工具不一样的是smem可以报告实际使用的物理内存(PSS),这是一种更有意义的指标.可以衡量虚拟内存系统的 ...
- Linux监控工具介绍系列——iostat
文章转自:https://www.cnblogs.com/ghj1976/p/5691857.html Linux系统中的 iostat是I/O statistics(输入/输出统计)的缩写,iost ...
- Linux系统性能监控工具介绍之-tsar
Linux系统性能监控工具介绍之-tsar Linux系统性能监控工具介绍之-tsar 2017-03-02 20:25 175人阅读 评论(0) 收藏 举报 分类: LINUX调优(9) 目 ...
- Java监控工具介绍,VisualVm ,JProfiler,Perfino,Yourkit,Perf4J,JProbe,Java微基准测试【转】
Java监控工具介绍,VisualVm ,JProfiler,Perfino,Yourkit,Perf4J,JProbe,Java微基准测试[转] 本文是本人前一段时间做一个简单Java监控工具调研总 ...
- linux磁盘管理系列-LVM的使用
LVM是什么 LVM是Linux操作系统的逻辑卷管理器. 现在有两个Linux版本的LVM,分别是 LVM1,LVM2.LVM1是一种已经被认为稳定了几年的成熟产品,LVM2 是最新最好的LVM版本. ...
- Linux 系统化学习系列文章总目录(持续更新中)
本页内容都是本人系统化学习Linux 时整理出来的.这些文章中,绝大多数命令类内容都是翻译.整理man或info文档总结出来的,所以相对都比较完整. 本人的写作方式.风格也可能会让朋友一看就恶心到直接 ...
- linux磁盘管理系列三:LVM的使用
磁盘管理系列 linux磁盘管理系列一:磁盘配额管理 http://www.cnblogs.com/zhaojiedi1992/p/zhaojiedi_linux_040_quota.html l ...
随机推荐
- 探秘Tomcat——连接篇
前两篇我们分别粗线条和细粒度的讲解了tomcat的服务是如何启动以及连接器Connector和容器Container又分别是如何被启动的. 本篇我们主要侧重tomcat中server.service以 ...
- 奇葩bug笔记
一.Filemanager-master (jsp) 1.上传的html文件需要保证带外链的<script src="..."></script>标签在&l ...
- 使用 PowerShell 自动化 CloudServices 发布
在软件的开发过程中,自动化的编译和部署能够带来很多的优势.如果可以通过一个脚本实现软件的自动化部署,那么就可以节省大量的时间去做其它事情. 下面介绍如何将云应用程序通过 PowerShell 自动发布 ...
- healthMonitoring与运行状况监视
配置针对应用程序的运行状况监视的一个服务 配置节内容比以往的较为复杂,如下 <healthMonitoring Enabled="true|false" heartbeatI ...
- [WCF编程]12.事务:事务概述
一.事务概述 维护系统一致性和正确地处理错误恢复挑战的最佳方式是使用事务. 一个事务就是一个复杂操作的集合,这个集合中任何一个操作的失败都会引起整个集合的失败. 尽管在事务进行时系统被允许暂时出于不一 ...
- HTTP协议详解
Author :Jeffrey 引言 HTTP 是一个属于应用层的面向对象的协议,由于其简捷.快速的方式,适用于分布式超媒体信息系统.它于1990年提出,经过几年的使用与发展,得到不断地完善和 扩展. ...
- Oracle学习总结_day05_集合_连接查询
本文为博主辛苦总结,希望自己以后返回来看的时候理解更深刻,也希望可以起到帮助初学者的作用. 转载请注明 出自 : luogg的博客园 谢谢配合! day05_集合_连接查询 集合操作符 UNION ( ...
- html&css中的文字对齐问题
html&css的使用过程中,我们经常会遇到很多文字对齐问题.下面我要介绍一个有丁点难的文字对齐问题. 实现效果如下图所示. 两行长度不定的文字,要让它们总体水平居中,然后,这两行字要左对 ...
- P2P核心业务体系
看似一个简单的充值.提现按钮,背后可是巨多的逻辑和业务处理.
- ABP 初探 之 权限设计
大.小项目都要设计权限,都想设计一个通用的权限,把权限做的比较复杂,现在了解了ABP的设计思路,觉得设计很简单,但实现方法与思路耐人寻味. 本篇只介绍AbpPermissions的数据库设计,其它表结 ...