
[数据]matplotlib总结
这里权当一个matplotlib的用法小结,主要用于记录,以防忘记。
需要安装一下Anaconda,这里推荐清华大学的镜像:https://mirrors.tuna.tsinghua.edu.cn/help/anaconda/
matplotlib能将数据进行可视化,更直观地呈现。使数据更加客观,更具说服力。
1. 折线图
from matplotlib import pyplot as plt

# E:\Anaconda3\Library\bin添加到环境变量

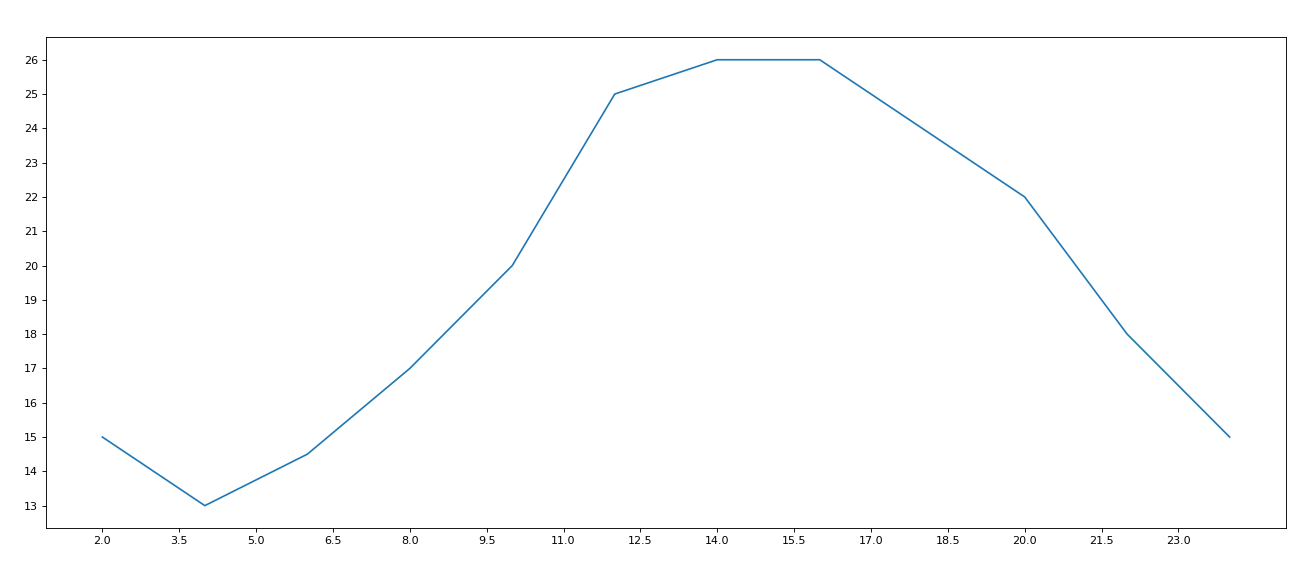
x = range(2, 26, 2)

y = [15, 13, 14.5, 17, 20, 25, 26, 26, 24, 22, 18, 15]

# 设置图片大小,宽20,高8,像素80

plt.figure(figsize=(20, 8), dpi=80)

# 设置x轴的刻度

_xtick_labels = [i / 2 for i in range(4, 49)]

plt.xticks(_xtick_labels[::3]) #步长取3

plt.yticks(range(min(y), max(y) + 1))

# 绘图

plt.plot(x, y)

# 保存,svg矢量图格式,放大不会有锯齿

plt.savefig('./t1.svg')

# 展示图形

plt.show()
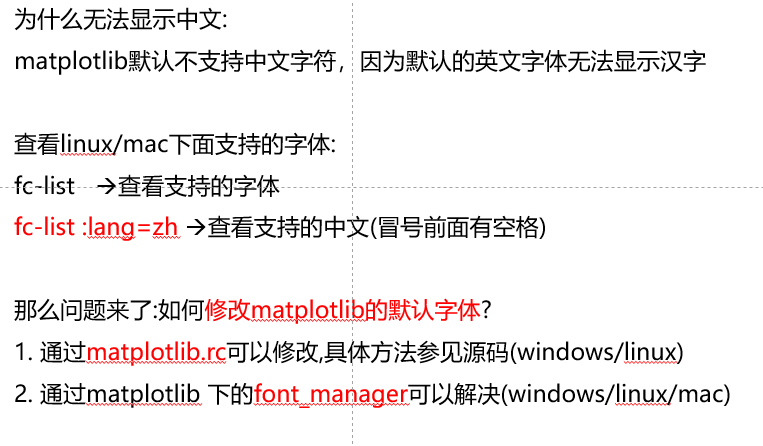
2. 设置中文
import random

from matplotlib import pyplot as plt, font_manager

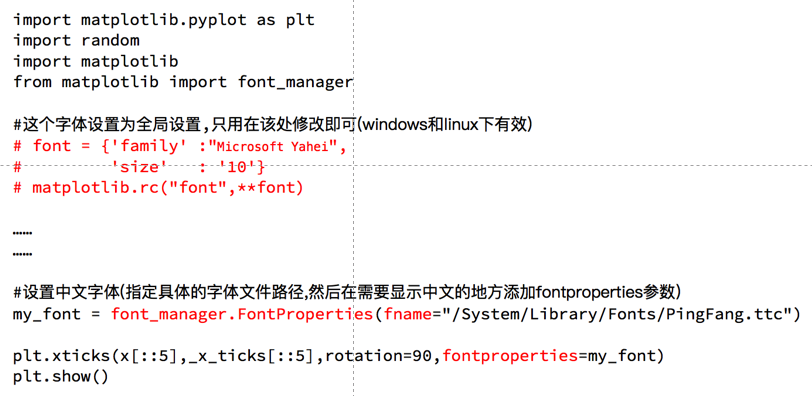
#设置字体(这样可以显示中文字体)

my_font = font_manager.FontProperties(fname='C:\Windows\Fonts\simsun.ttc', size=12)

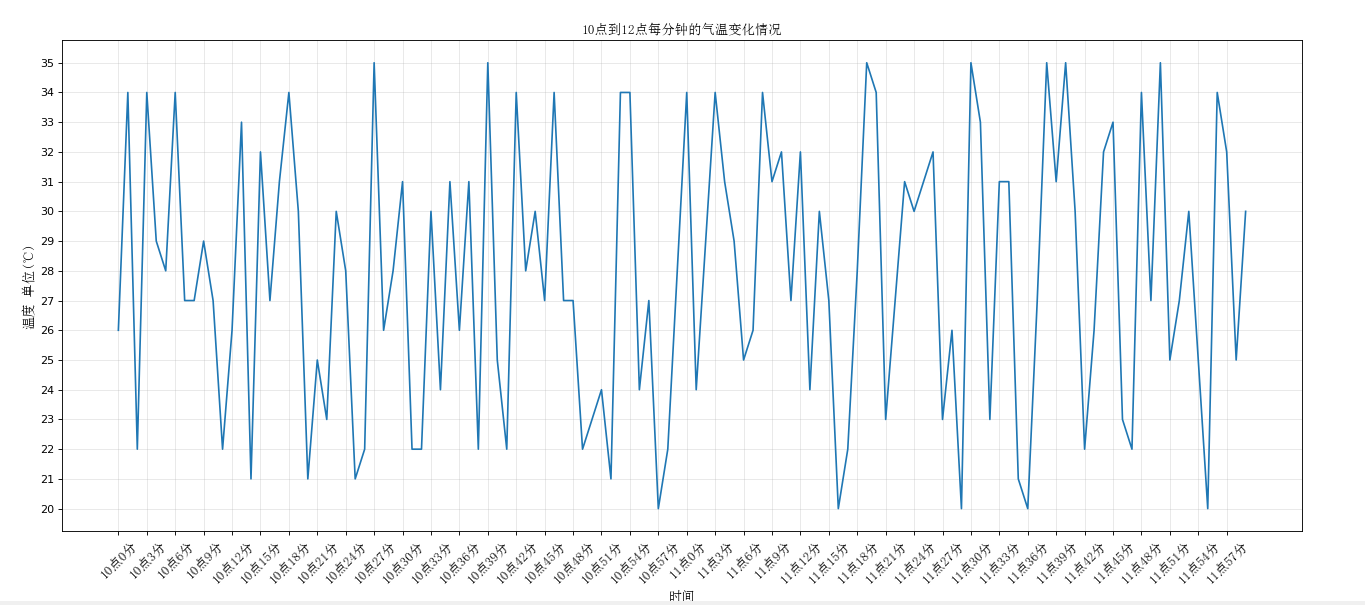
x = range(120)

y = [random.randint(20, 35) for i in range(120)]

plt.figure(figsize=(20, 8), dpi=80)

# 调整x轴的刻度

# _x = list(x)[::10]

# _xtick_labels = ['hello,{}'.format(i) for i in _x]

# plt.xticks(_x, _xtick_labels)

_x = list(x)

_xtick_labels = ['10点{}分'.format(i) for i in range(60)]

_xtick_labels += ['11点{}分'.format(i) for i in range(60)]

#rotation是逆时针旋转角度

# plt.xticks(_x[::3], _xtick_labels[::3], rotation = 45, fontproperties = 'SimHei') #这样是可以的

plt.xticks(_x[::3], _xtick_labels[::3], rotation = 45, fontproperties = my_font)

plt.yticks(range(min(y), max(y) + 1))

#添加描述信息

plt.xlabel('时间', fontproperties = my_font)

plt.ylabel('温度 单位(℃)', fontproperties = my_font)

plt.title('10点到12点每分钟的气温变化情况', fontproperties = my_font)

#网格

#alpha是透明度,0最透明,1最明显

plt.grid(alpha = 0.3)

plt.plot(x, y)

plt.show()
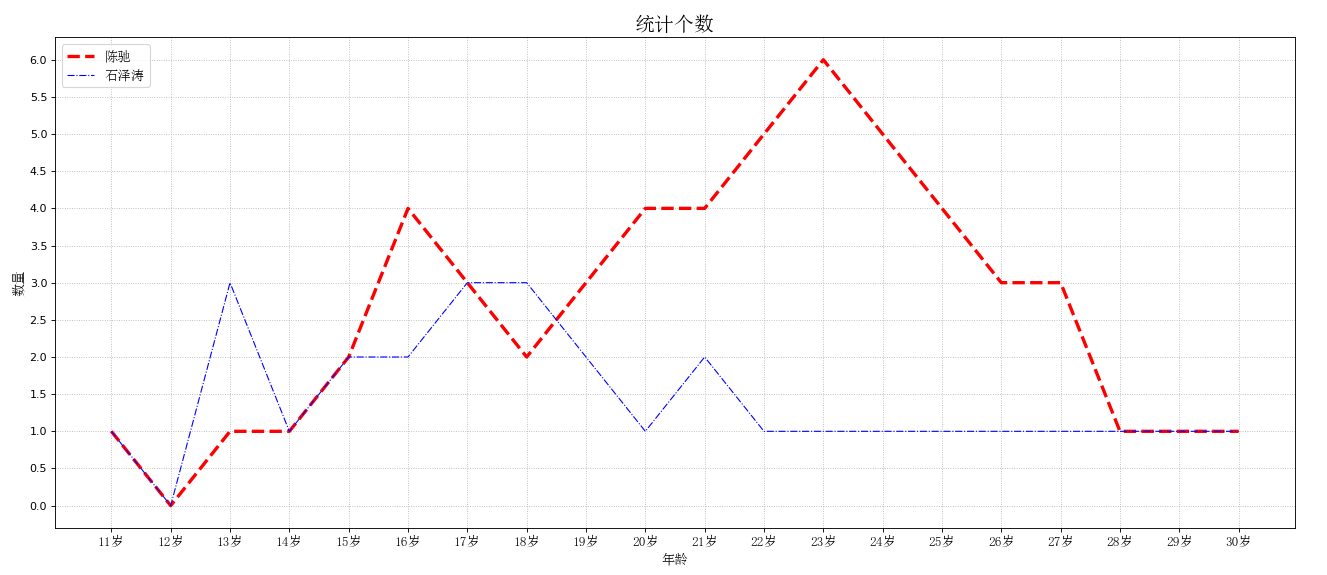
3. 多个折线图
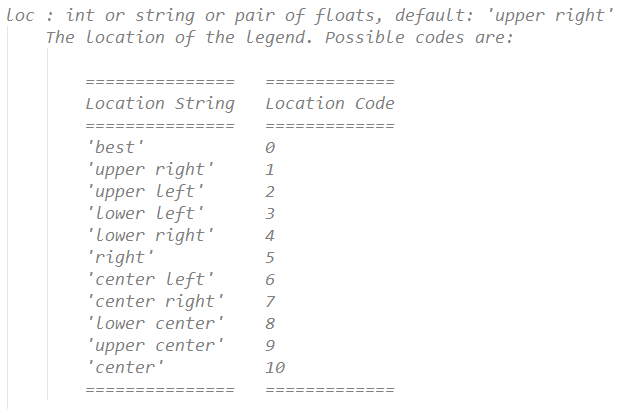
图例的位置loc:
from matplotlib import pyplot as plt, font_manager

plt.figure(figsize=(20, 8), dpi=80)

x = range(11, 31)

y1 = [1,0,1,1,2,4,3,2,3,4,4,5,6,5,4,3,3,1,1,1]

y2 = [1,0,3,1,2,2,3,3,2,1,2,1,1,1,1,1,1,1,1,1]

#设置字体(这样可以显示中文字体)

my_font = font_manager.FontProperties(fname='C:\Windows\Fonts\simsun.ttc', size=12)

plt.xticks(x, ['{}岁'.format(i) for i in list(x)], fontproperties = my_font)

plt.yticks([i / 2 for i in range(2 * min(y1), 2 * max(y1) + 1)])

#描述信息

plt.xlabel('年龄', fontproperties = my_font)

plt.ylabel('数量', fontproperties = my_font)

plt.title('统计个数', fontproperties = my_font, size = 18)

#网格

#alpha是透明度

#linestyle -是实线 :是点虚线 --是线虚线 -.是点线虚线

plt.grid(alpha = 0.9, linestyle = ':')

#两个都画

plt.plot(x, y1, label = '陈驰', color = 'red', linestyle = '--', linewidth = 3)

plt.plot(x, y2, label = '石泽涛', color = 'blue', linestyle = '-.', linewidth = 1)

#添加图例

#这里显示中文需要注意一下

plt.legend(prop=my_font, loc=2)

plt.show()
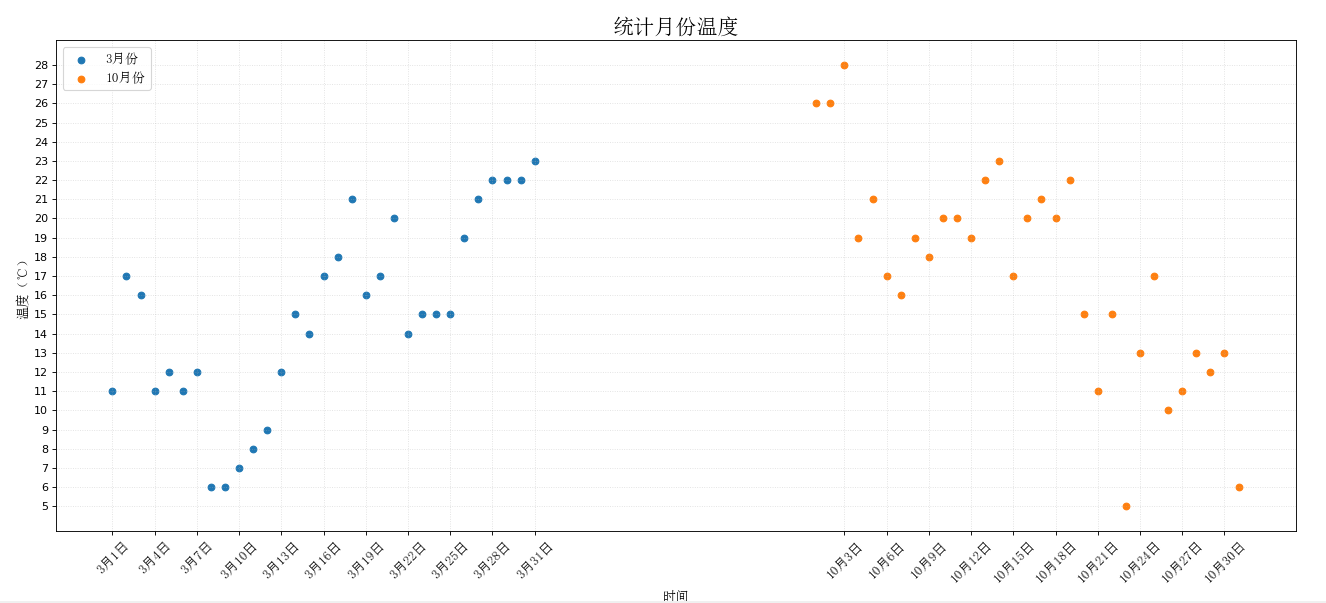
4. 散点图
from matplotlib import pyplot as plt, font_manager

y_3 = [11,17,16,11,12,11,12,6,6,7,8,9,12,15,14,17,18,21,16,17,20,14,15,15,15,19,21,22,22,22,23]

y_10 = [26,26,28,19,21,17,16,19,18,20,20,19,22,23,17,20,21,20,22,15,11,15,5,13,17,10,11,13,12,13,6]

x_3 = range(1, 32)

x_10 = range(51, 82)

plt.figure(figsize=(20, 8), dpi=80)

#设置字体(这样可以显示中文字体)

my_font = font_manager.FontProperties(fname='C:\Windows\Fonts\simsun.ttc', size=12)

#画散点图

plt.scatter(x_3, y_3, label = '3月份')

plt.scatter(x_10, y_10, label = '10月份')

_x = list(x_3) + list(x_10)

_xtick_labels = ['3月{}日'.format(i) for i in x_3]

_xtick_labels += ['10月{}日'.format(i - 50) for i in x_10]

plt.xticks(_x[::3], _xtick_labels[::3], fontproperties = my_font, rotation = 45)

plt.yticks(range(min(y_3 + y_10), max(y_3 + y_10) + 1))

#添加图例

plt.legend(prop = my_font, loc = 2)

#设置描述信息

plt.xlabel('时间', fontproperties = my_font)

plt.ylabel('温度(℃)', fontproperties = my_font)

plt.title('统计月份温度', fontproperties = my_font, size = 19)

plt.grid(alpha = 0.4, linestyle = ':')

plt.show()
5. 柱状图
from matplotlib import pyplot as plt, font_manager

a = ["战狼2", "速度与激情8", "功夫瑜伽", "西游伏妖篇", "变形金刚5:最后的骑士", "摔跤吧!爸爸", "加勒比海盗5:死无对证", "金刚:骷髅岛", "极限特工:终极回归", "生化危机6:终章",

     "乘风破浪", "神偷奶爸3", "智取威虎山", "大闹天竺", "金刚狼3:殊死一战", "蜘蛛侠:英雄归来", "悟空传", "银河护卫队2", "情圣", "新木乃伊", ]

b = [56.01, 26.94, 17.53, 16.49, 15.45, 12.96, 11.8, 11.61, 11.28, 11.12, 10.49, 10.3, 8.75, 7.55, 7.32, 6.99, 6.88,

     6.86, 6.58, 6.23]

#设置字体(这样可以显示中文字体)

my_font = font_manager.FontProperties(fname='C:\Windows\Fonts\simsun.ttc', size=12)

plt.figure(figsize=(20, 8), dpi=80)

plt.yticks(range(len(a)), a, fontproperties = my_font)

plt.xticks(list(range(int(min(b)), int(max(b)) + 1))[::2])

plt.ylabel('电影', fontproperties = my_font)

plt.xlabel('票房(亿元)', fontproperties = my_font)

plt.title('2017电影票房统计', fontproperties = my_font, size = 19)

#width是条形图宽度

#bar是竖着的(width属性),barh是横着的(height属性)

plt.barh(range(len(a)), b, height = 0.3, color = 'orange')

plt.grid(alpha = 0.3, linestyle = ':')

plt.show()

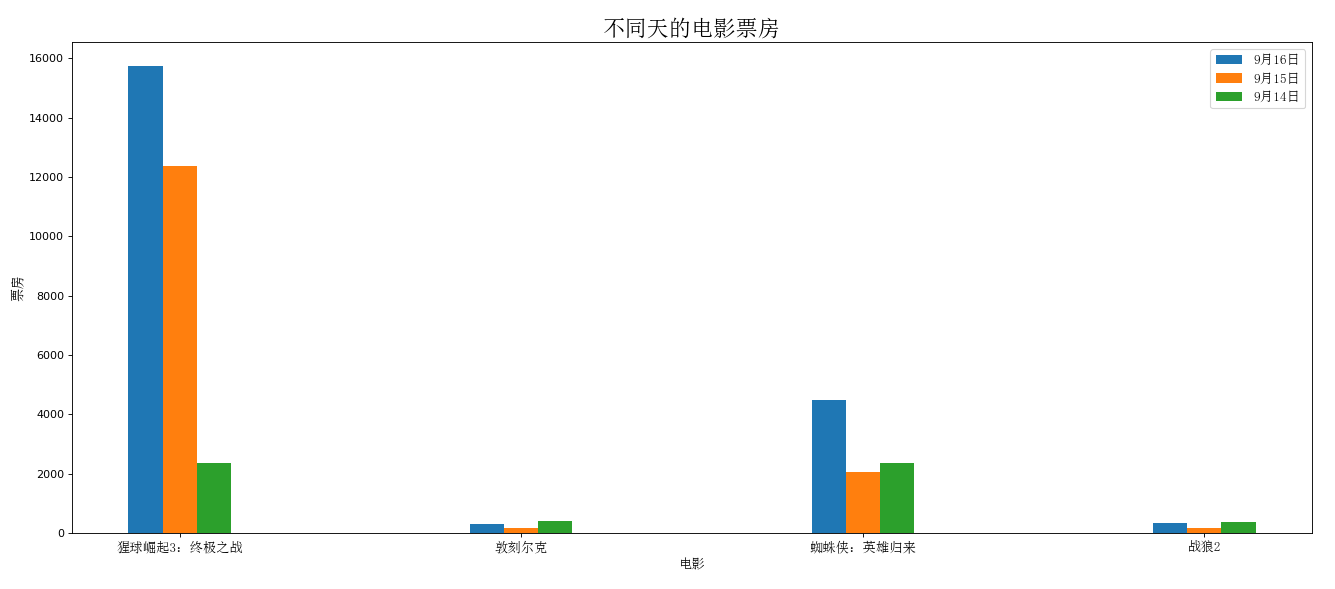
6. 直方图
from matplotlib import pyplot as plt, font_manager

#设置字体(这样可以显示中文字体)

my_font = font_manager.FontProperties(fname='C:\Windows\Fonts\simsun.ttc', size=12)

a = ["猩球崛起3:终极之战","敦刻尔克","蜘蛛侠:英雄归来","战狼2"]

b_16 = [15746,312,4497,319]

b_15 = [12357,156,2045,168]

b_14 = [2358,399,2358,362]

plt.figure(figsize=(20, 8), dpi=80)

_x = list(range(len(a)))

_bar_width = 0.1

plt.xticks([i + _bar_width for i in _x], a, fontproperties = my_font)

plt.xlabel('电影', fontproperties = my_font)

plt.ylabel('票房', fontproperties = my_font)

plt.title('不同天的电影票房', fontproperties = my_font, size = 20)

plt.bar(_x, b_16, width = _bar_width, label = '9月16日')

plt.bar([i + _bar_width for i in _x], b_15, width = _bar_width, label = '9月15日')

plt.bar([i + _bar_width * 2 for i in _x], b_14, width = _bar_width, label = '9月14日')

plt.legend(prop = my_font, loc = 0)

plt.show()
要想进一步学习,参考:
https://matplotlib.org/gallery/index.html
或者选用:
[数据]matplotlib总结的更多相关文章
- 可视化数据matplotlib之安装与简单折线图
matplotlib是一个可视化数据的模块,安装前需要先安装Visual Studio Community:然后去https://pypi.python.org/pypi上查找matplotlib并下 ...
- python爬取旅游数据+matplotlib简单可视化
题目如下: 共由6个函数组成: 第一个函数爬取数据并转为DataFrame: 第二个函数爬取数据后存入Excel中,对于解题来说是多余的,仅当练手以及方便核对数据: 后面四个函数分别对应题目中的四个m ...
- python Matplotlib数据可视化神器安装与基本应用
Matplotlib Matplotlib 是一个非常强大的 Python 画图工具; 手中有很多数据, Matplotlib能帮你画出美丽的: 线图; 散点图; 等高线图; 条形图; 柱状图; 3D ...
- python实战学习之matplotlib绘图
matplotlib 是最流行的Python底层绘图库,主要做数据可视化图表 可以将数据可视化,能够更直观的呈现数据 matplotlib绘图基本要点 首先实现一个简单的绘图 # 导入pyplot f ...
- 无用之学matplotlib,numpy,pandas
一.matplotlib学习 matplotlib: 最流行的Python底层绘图库,主要做数据可视化图表,名字取材于MATLAB,模仿MATLAB构建 例子1: # coding=utf- from ...
- matplotlib表面三维图
1.basic numpy.meshgrid 由一维数组到二维数组,用于生成网格数据 matplotlib python绘图库 2.code In [88]: from mpl_toolkits.mp ...
- 11-2 numpy/pandas/matplotlib模块
目录 numpy模块 一维数组 二维数组 列表list和numpy的区别 获取多维数组的行和列 多维数组的索引 高级功能 多维数组的合并 通过函数方法创建多维数组 矩阵的运算 求最大值最小值 nump ...
- day18-常用模块III (numpy、pandas、matplotlib)
目录 numpy模块 创建矩阵 获取矩阵的行列数 切割矩阵 矩阵元素替换 矩阵的合并 通过函数创建矩阵 矩阵的运算 矩阵的点乘与转置 矩阵的逆 矩阵的其他操作 numpy.random生成随机数 pa ...
- ApacheCN 数据科学译文集 20211109 更新ApacheCN 数据科学译文集 20211109 更新
计算与推断思维 一.数据科学 二.因果和实验 三.Python 编程 四.数据类型 五.表格 六.可视化 七.函数和表格 八.随机性 九.经验分布 十.假设检验 十一.估计 十二.为什么均值重要 十三 ...
随机推荐
- 使用 git clone 的时候出现 fatal: Unable to find remote helper for 'https' 解决办法
安装 libcurl 和 curl yum install libcurl-devel yum install curl-devel 重编译git客户端
- C# DataGridView插入DB
public static bool ContrastColumns(DataColumnCollection co1, DataGridViewColumnCollection co2) { boo ...
- VB.NET只允许打开一个实例
If UBound(Diagnostics.Process.GetProcessesByName(Diagnostics.Process.GetCurrentProcess.ProcessName)) ...
- 洛谷.2709.小B的询问(莫队)
题目链接 /* 数列的最大值保证<=50000(k),可以直接用莫队.否则要离散化 */ #include<cmath> #include<cstdio> #includ ...
- PHP文本处理 中文汉字字符串 转换为数组
在PHP中我们可以通过str_split 将字符串转换为数组,但是却对中文无效,下面记录一下个人将中文字符串转换为数组的方法. 用到的PHP函数 mb_strlen — 获取字符串的长度 functi ...
- Java并发程序设计(十三)锁的性能优化
锁的性能优化 一.优化注意事件 一)减少锁的持有时间 只在必要时进行同步,能明显减少锁的持有时间. 二)锁的细化 缺陷:当系统需要全局锁时,其消耗的资源会比较多. 三)锁的分离 比如读写分离锁 四)锁 ...
- Codechef October Challenge 2018 游记
Codechef October Challenge 2018 游记 CHSERVE - Chef and Serves 题目大意: 乒乓球比赛中,双方每累计得两分就会交换一次发球权. 不过,大厨和小 ...
- 最小生成树之克鲁斯卡尔(kruskal)算法
#include <iostream> #include <string> using namespace std; typedef struct MGraph{ string ...
- Hessian学习总结(一)——Hessian入门
一.远程通讯协议的基本原理 网络通信需要做的就是将流从一台计算机传输到另外一台计算机,基于传输协议和网络 IO 来实现,其中传输协议比较出名的有 http . tcp . udp 等等, http . ...
- LINK:fatal error LNK1123: 转换到 COFF 期间失败: 文件无效或损坏 (转)
很多伙伴在更新VS2010,或者卸载VS2012安装2010后,建立Win32 Console Project/MFC项目时会出现"LINK : fatal error LNK1123: 转 ...