系统信息&&硬件信息查看
系统信息&&硬件信息查看
一系统信息查看
(一)查看系统版本信息
[root@centos7 ~]# cat  /etc/redhat-release

CentOS Linux release 7.6.1810 (Core)
[root@centos61 ~]# cat  /etc/redhat-release

CentOS release 6.8 (Final)
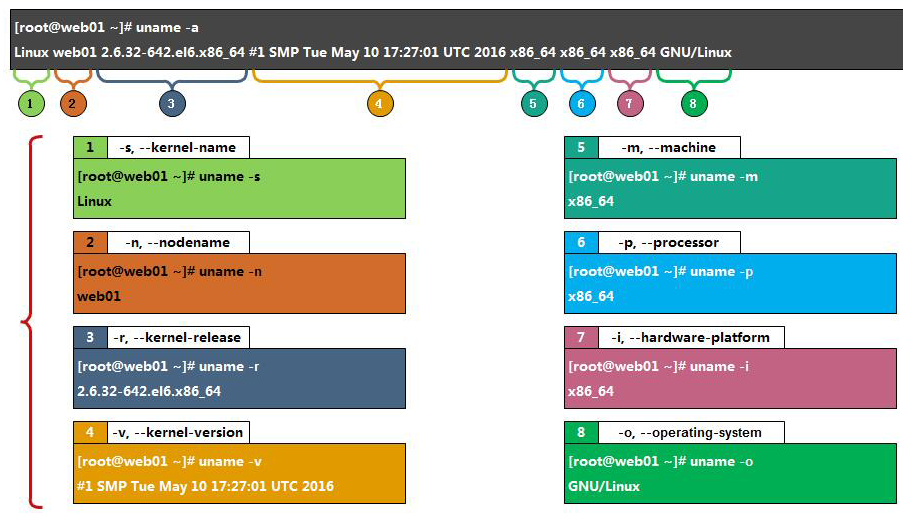
(二)查看系统内核版本
[root@centos7 ~]# uname

Linux

[root@centos7 ~]# uname  -r

3.10.0-957.el7.x86_64

[root@centos7 ~]# uname  -a

Linux centos7.com 3.10.0-957.el7.x86_64 #1 SMP Thu Nov 8 23:39:32 UTC 2018 x86_64 x86_64 x86_64 GNU/Linux
[root@centos61 ~]# uname -r

2.6.32-642.el6.x86_64

[root@centos61 ~]# uname -a

Linux centos61.com 2.6.32-642.el6.x86_64 #1 SMP Tue May 10 17:27:01 UTC 2016 x86_64 x86_64 x86_64 GNU/Linux
二查看硬件信息
(一)CPU
cpu对应文件
[root@centos61 ~]#  cat  /proc/cpuinfo

processor    : 0

vendor_id    : GenuineIntel

cpu family    : 6

model        : 142

model name    : Intel(R) Core(TM) i7-7500U CPU @ 2.70GHz

stepping    : 9

microcode    : 48

cpu MHz        : 2903.998

cache size    : 4096 KB

physical id    : 0

siblings    : 1

core id        : 0

cpu cores    : 1

apicid        : 0

initial apicid    : 0

fpu        : yes

fpu_exception    : yes

cpuid level    : 22

wp        : yes

flags        : fpu vme de pse tsc msr pae mce cx8 apic sep mtrr pge mca cmov pat pse36 clflush mmx fxsr sse sse2 ss syscall nx pdpe1gb rdtscp lm constant_tsc up arch_perfmon xtopology tsc_reliable nonstop_tsc unfair_spinlock pni pclmulqdq ssse3 fma cx16 pcid sse4_1 sse4_2 x2apic movbe popcnt tsc_deadline_timer aes xsave avx f16c rdrand hypervisor lahf_lm abm 3dnowprefetch arat xsaveopt fsgsbase bmi1 avx2 smep bmi2 invpcid rdseed adx

bogomips    : 5807.99

clflush size    : 64

cache_alignment    : 64

address sizes    : 42 bits physical, 48 bits virtual

power management:
注意权限只读
[root@centos7 ~]# ll  /proc/cpuinfo

-r--r--r-- 1 root root 0 Dec  6 15:25 /proc/cpuinfo
cpu的重要参数——physical id
physical id:0 表示服务器上CPU的ID号,目前是1颗CPU,ID为0
对CPU处理
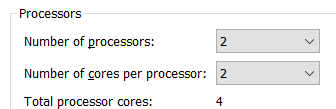
计算服务器上CPU颗数
physical id:0
physical id:0
physical id:1
physical id:1
上面显示4次合并就是2颗CPU
[root@centos7 ~]# cat  /proc/cpuinfo | grep  phy

physical id    : 0

address sizes    : 43 bits physical, 48 bits virtual

physical id    : 0

address sizes    : 43 bits physical, 48 bits virtual

physical id    : 1

address sizes    : 43 bits physical, 48 bits virtual

physical id    : 1

address sizes    : 43 bits physical, 48 bits virtual

[root@centos7 ~]#
快速统计CPU的颗数
[root@centos7 ~]# grep "physical id" /proc/cpuinfo | uniq | wc -l
查看每颗CPU核心数
cpu cores:2
[root@centos7 ~]# cat  /proc/cpuinfo | grep  "cpu cores"

cpu cores    : 2

cpu cores    : 2

cpu cores    : 2

cpu cores    :
每颗CPU核心数法2
[root@centos7 ~]# lscpu  |  grep  "socket"

Core(s) per socket:
服务器CPU总的核心数
[root@centos7 ~]# cat  /proc/cpuinfo | grep  "processor"

processor    : 0

processor    : 1

processor    : 2

processor    :
服务器CPU总的核心数法2
[root@centos7 ~]# lscpu  |  grep  "CPU(s)"

CPU(s):                4

On-line CPU(s) list:   0-3

NUMA node0 CPU(s):     0-
注意/proc目录中的信息不让改动,目录中的所有数据都存储在内存里面,即使可以修改也不能永久保存。
包含数据内存存储信息、系统信息、内核信息、服务进程信息。
(二)内存
MemTotal:         995924 kB    服务器总的内存容量

MemFree:          772912 kB    服务器内存空闲容量,可能被其他占用了

MemAvailable:     746652 kB    服务器可用内容容量,只要关注这个
Buffers:            2076 kB    缓冲(加快写入数据)

Cached:            78476 kB    缓存(加快读取数据)
[root@centos7 ~]# cat /proc/meminfo

MemTotal:         995924 kB    服务器总的内存容量

MemFree:          772912 kB    服务器内存空闲容量,可能被其他占用了

MemAvailable:     746652 kB    服务器可用内容容量,只要关注这个

Buffers:            2076 kB

Cached:            78476 kB

SwapCached:            0 kB

Active:            64164 kB

Inactive:          62348 kB

Active(anon):      46372 kB

Inactive(anon):     7380 kB

Active(file):      17792 kB

Inactive(file):    54968 kB

Unevictable:           0 kB

Mlocked:               0 kB

SwapTotal:       1572860 kB

SwapFree:        1572860 kB

Dirty:                 0 kB

Writeback:             0 kB

AnonPages:         46036 kB

Mapped:            23720 kB

Shmem:              7792 kB

Slab:              44956 kB

SReclaimable:      17504 kB

SUnreclaim:        27452 kB

KernelStack:        4144 kB

PageTables:         4408 kB

NFS_Unstable:          0 kB

Bounce:                0 kB

WritebackTmp:          0 kB

CommitLimit:     2070820 kB

Committed_AS:     225284 kB

VmallocTotal:   34359738367 kB

VmallocUsed:      178292 kB

VmallocChunk:   34359310332 kB

HardwareCorrupted:     0 kB

AnonHugePages:      8192 kB

CmaTotal:              0 kB

CmaFree:               0 kB

HugePages_Total:       0

HugePages_Free:        0

HugePages_Rsvd:        0

HugePages_Surp:        0

Hugepagesize:       2048 kB

DirectMap4k:       73600 kB

DirectMap2M:      974848 kB

DirectMap1G:           0 kB
(三)磁盘
查看挂载信息:/proc/mounts
[root@centos7 ~]# tail -n2   /proc/mounts

/dev/sda1 /boot xfs rw,relatime,attr2,inode64,noquota 0 0

tmpfs /run/user/0 tmpfs rw,nosuid,nodev,relatime,size=99596k,mode=700 0
注意不能达到100%,如果日志文件无法写入那么服务就会出现问题
[root@centos7 ~]# df -h

Filesystem      Size  Used Avail Use% Mounted on

/dev/sda3        40G  1.8G   39G   5% /

devtmpfs        476M     0  476M   0% /dev

tmpfs           487M     0  487M   0% /dev/shm

tmpfs           487M  7.7M  479M   2% /run

tmpfs           487M     0  487M   0% /sys/fs/cgroup

/dev/sda1       197M  105M   93M  54% /boot

tmpfs            98M     0   98M   0% /run/user/
模拟占用内存
在企业里面内存不够用就要找领导添加内存了,下面就是证据
[root@centos7 ~]# free  -h

              total        used        free      shared  buff/cache   available

Mem:           972M         95M        754M        7.6M        122M        729M

Swap:          1.5G          0B        1.5G

[root@centos7 ~]# dd  if=/dev/zero  of=/dev/null  bs=1G  count=1

1+0 records in

1+0 records out

1073741824 bytes (1.1 GB) copied, 7.93657 s, 135 MB/s

[root@centos7 ~]# free  -h

              total        used        free      shared  buff/cache   available

Mem:           972M         54M        856M        1.3M         61M        803M

Swap:          1.5G         49M        1.5G
(四)系统负载情况
CPU压力=系統负载
CPU负载文件
[root@centos7 ~]# cat  /proc/loadavg

0.08 0.05 0.05 1/131
0.08 0.05 0.05
1分钟平均负载 5分钟平均负载 15分钟平均负载
负载数值 <= 总的CPU核心,服务器的核数有很多,比如有128核
因为xshell显示页面太小了
[root@centos7 ~]# w

w: 34 column window is too narrow

[root@centos7 ~]# w

w: 34 column window is too narrow

[root@centos7 ~]# w

w: 34 column window is too narrow
命令行查看系统负载情况
最简单的命令
[root@centos7 ~]# w

 12:23:06 up 45 min,  2 users,  load average: 0.00, 0.01, 0.05

USER     TTY      FROM             LOGIN@   IDLE   JCPU   PCPU WHAT

root     pts/0    10.0.0.1         11:37    5:22   0.19s  0.19s -bash

root     pts/1    10.0.0.1         11:37    2.00s  0.02s  0.00s w
系统信息&&硬件信息查看的更多相关文章
- 重新想象 Windows 8 Store Apps (30) - 信息: 获取包信息, 系统信息, 硬件信息, PnP信息, 常用设备信息
原文:重新想象 Windows 8 Store Apps (30) - 信息: 获取包信息, 系统信息, 硬件信息, PnP信息, 常用设备信息 [源码下载] 重新想象 Windows 8 Store ...
- (转)IBM AIX系统硬件信息查看命令(shell脚本)
IBM AIX系统硬件信息查看命令(shell脚本) 原文:http://blog.itpub.net/22085031/viewspace-1054015/ 查看IBM AIX系统的主机型号.序列号 ...
- Linux下常用的硬件信息查看命令
1.查看CPU型号,这里为了方便查看结合管道符用grep进行了匹配,当然只需要前面的命令也可以,命令如下: cat /proc/cpuinfo | grep "model name" ...
- Linux硬件信息查看
more /proc/cpuinfo more /proc/meminfo more /proc/*info lspci 查看主板信息等cat /proc/cpuinfo CPU信息cat /proc ...
- Centos硬件信息查看命令
[root@yan-001 ~] # uname -a # 查看内核/操作系统/CPU信息的linux系统信息命令 [root@yan-001 ~] # head -n 1 /etc/issue # ...
- ubuntu查看硬件信息
1,外部探针probe sudo apt-get install hwinfo 执行hwinfo获取系统信息 --short
- linux查看硬件信息及驱动设备相关整理
查看声卡设备:cat /proc/asound/cards 查看USB设备:cat /proc/bus/usb/devices 常用命令整理如下:用硬件检测程序kuduz探测新硬件:service k ...
- linux查看硬件信息的方法
目前会Linux的人不少,但是精通的不多,怎样才能做一个符合企业需求的Linux人才,首先要有良好的Linux基础知识.本文为你讲解Linux的知识,今天所讲的是 Linux硬件信息怎样查看,希望你能 ...
- ]# dmesg | grep ATAcentos下查看网卡,主板,CPU,显卡,硬盘型号等硬件信息
centos下查看网卡,主板,CPU,显卡,硬盘型号等硬件信息 osc_4o5tc4xq 2019/10/11 15:03 阅读数 253 centos下查看网卡,主板,CPU,显卡,硬盘型号等硬件信 ...
随机推荐
- jinjia2 模板学习
参考链接https://blog.csdn.net/langkew/article/details/51734423
- eureka注册中心wro.css wro.js 404
注册中心和配置中心放在一个module里面,如果不配置配种中心的访问前缀,会被config拦截.所以改动如下: package com.cloud.stagging.lhcloudeureka; im ...
- 黑马lavarel教程---2、获取用户输入
黑马lavarel教程---2.获取用户输入 一.总结 一句话总结: lavarel中获取用户输入可以通过Input外观模式和Request外观模式,两者的对应的方法啥的都一样,比如get.all.o ...
- 30个有关Python的小技巧,给程序员的 30 个基本 Python 贴士与技巧
30个有关Python的小技巧 2013/07/04 · Python, 开发 · 4 评论 · Python 分享到: 66 本文由 伯乐在线 - Kevin Sun 翻译.未经许可,禁止转载!英文 ...
- Latex数学公式中的矩阵
目录 矩阵的括号形式 array环境 上三角矩阵 分块矩阵 行内矩阵 矩阵的括号形式 使用matrix.pmatrix.bmatrix.Bmatrix.vmatrix或者Vmatrix环境: $$ \ ...
- 通过VLC的ActiveX进行二次开发,实现一个多媒体播放器 2011-04-10 00:57:23
http://blog.chinaunix.net/xmlrpc.php?r=blog/article&uid=25498312&id=218294 通过VLC的ActiveX进行二 ...
- 使用定时器settimeout、setInterval执行能传递参数的函数
无论是window.setTimeout还是window.setInterval,在使用函数名作为调用句柄时都不能带参数,而在许多场合必须要带参数,这就需要想方法解决.经网上查询后整理如下: 例如对于 ...
- 机器学习实战笔记-11-Apriori与FP-Growth算法
Apriori算法 优点:易编码实现:缺点:大数据集上较慢:适用于:数值型或标称型数据. 关联分析:寻找频繁项集(经常出现在一起的物品的集合)或关联规则(两种物品之间的关联关系). 概念:支持度:数据 ...
- C# 压缩、解压缩
/// <summary> /// 压缩文件 FNameArry 为客户端传回来的文件列表:文件名数组,压缩包的名称strZipName /// </summary> /// ...
- EasyUI的columns中列标题居中
$("#supDataList").datagrid({ url: "../Ajax/SupplierAjax.ashx", queryParams: ...