
【六】Hystrix Dashboard
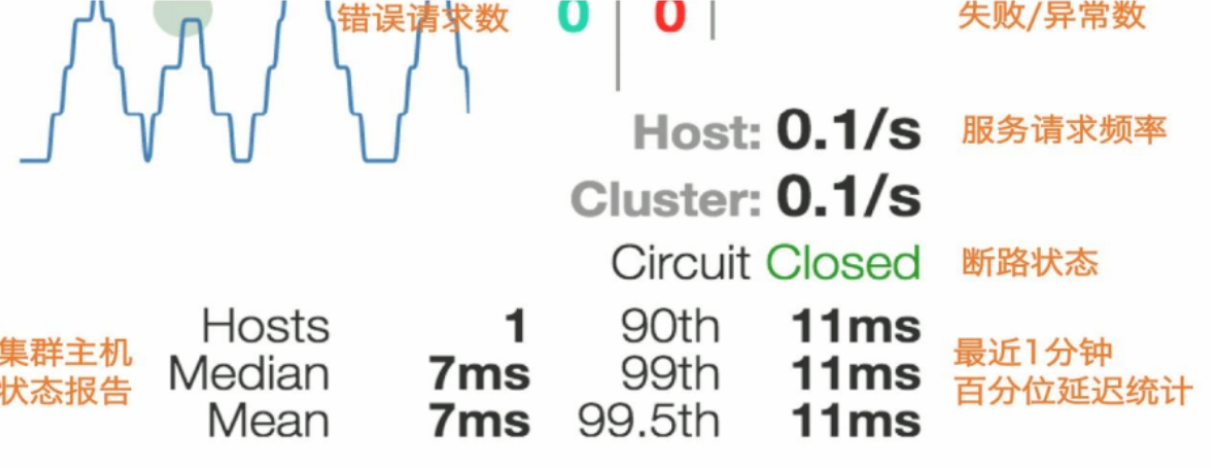
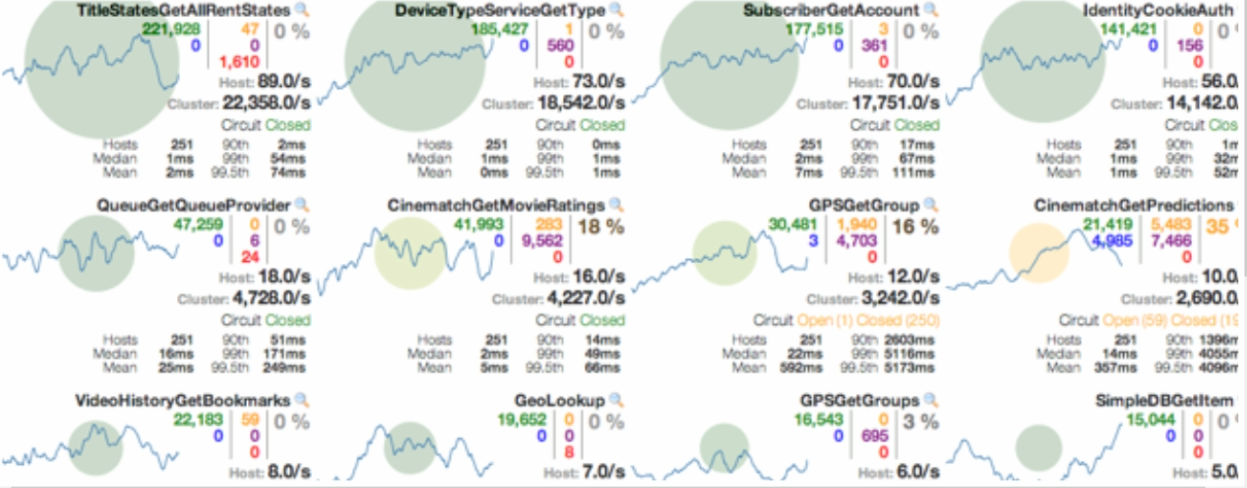
除了隔离依赖服务的调用以外,Hystrix还提供了准实时的调用监控(Hystrix Dashboard) , Hystrix会持续地记录所有通过 Hystrix发起的请求的执行信息,并以统计报表和图形的形式展示给用户,包括每秒执行多少请求多少成功,多少失败等。 Netflix通过hystrix-metrics-event-stream项目实现了对以上指标的监控。Spring Cloud也提供了Hystrix Dashboard的整合, 对监控内容转化成可视化界面。
1.pom.xml
<project xmlns="http://maven.apache.org/POM/4.0.0" xmlns:xsi="http://www.w3.org/2001/XMLSchema-instance"

    xsi:schemaLocation="http://maven.apache.org/POM/4.0.0 http://maven.apache.org/xsd/maven-4.0.0.xsd">

    <modelVersion>4.0.0</modelVersion>

    <parent>

        <groupId>com.atguigu.springcloud</groupId>

        <artifactId>microservicecloud</artifactId>

        <version>0.0.1-SNAPSHOT</version>

    </parent>

    <artifactId>microservicecloud-consumer-hystrix-dashboard</artifactId>

    <dependencies>

        <!-- 自己定义的api -->

        <dependency>

            <groupId>com.everjiankang.springcloud</groupId>

            <artifactId>microservicecloud-api</artifactId>

            <version>${project.version}</version>

        </dependency>

        <dependency>

            <groupId>org.springframework.boot</groupId>

            <artifactId>spring-boot-starter-web</artifactId>

        </dependency>

        <!-- 修改后立即生效,热部署 -->

        <dependency>

            <groupId>org.springframework</groupId>

            <artifactId>springloaded</artifactId>

        </dependency>

        <dependency>

            <groupId>org.springframework.boot</groupId>

            <artifactId>spring-boot-devtools</artifactId>

        </dependency>

        <!-- Ribbon相关 -->

        <dependency>

            <groupId>org.springframework.cloud</groupId>

            <artifactId>spring-cloud-starter-eureka</artifactId>

        </dependency>

        <dependency>

            <groupId>org.springframework.cloud</groupId>

            <artifactId>spring-cloud-starter-ribbon</artifactId>

        </dependency>

        <dependency>

            <groupId>org.springframework.cloud</groupId>

            <artifactId>spring-cloud-starter-config</artifactId>

        </dependency>

        <!-- feign相关 -->

        <dependency>

            <groupId>org.springframework.cloud</groupId>

            <artifactId>spring-cloud-starter-feign</artifactId>

        </dependency>

        <!-- hystrix和 hystrix-dashboard相关 -->

        <dependency>

            <groupId>org.springframework.cloud</groupId>

            <artifactId>spring-cloud-starter-hystrix</artifactId>

        </dependency>

        <dependency>

            <groupId>org.springframework.cloud</groupId>

            <artifactId>spring-cloud-starter-hystrix-dashboard</artifactId>

        </dependency>

    </dependencies>

</project>
2. application.yml
server:
port: 9001
3.启动类
import org.springframework.boot.SpringApplication;

import org.springframework.boot.autoconfigure.SpringBootApplication;

import org.springframework.cloud.netflix.hystrix.dashboard.EnableHystrixDashboard;

@SpringBootApplication

@EnableHystrixDashboard

public class DeptConsumer_DashBoard_App

{

    public static void main(String[] args)

    {

        SpringApplication.run(DeptConsumer_DashBoard_App.class, args);

    }

}
4.在被监控(有方法调用的)微服务项目的Pom.xml文件中添加: (8001,8002,8003集群项目中)
<!-- actuator监控信息完善 -->

<dependency>

    <groupId>org.springframework.boot</groupId>

    <artifactId>spring-boot-starter-actuator</artifactId>

</dependency>
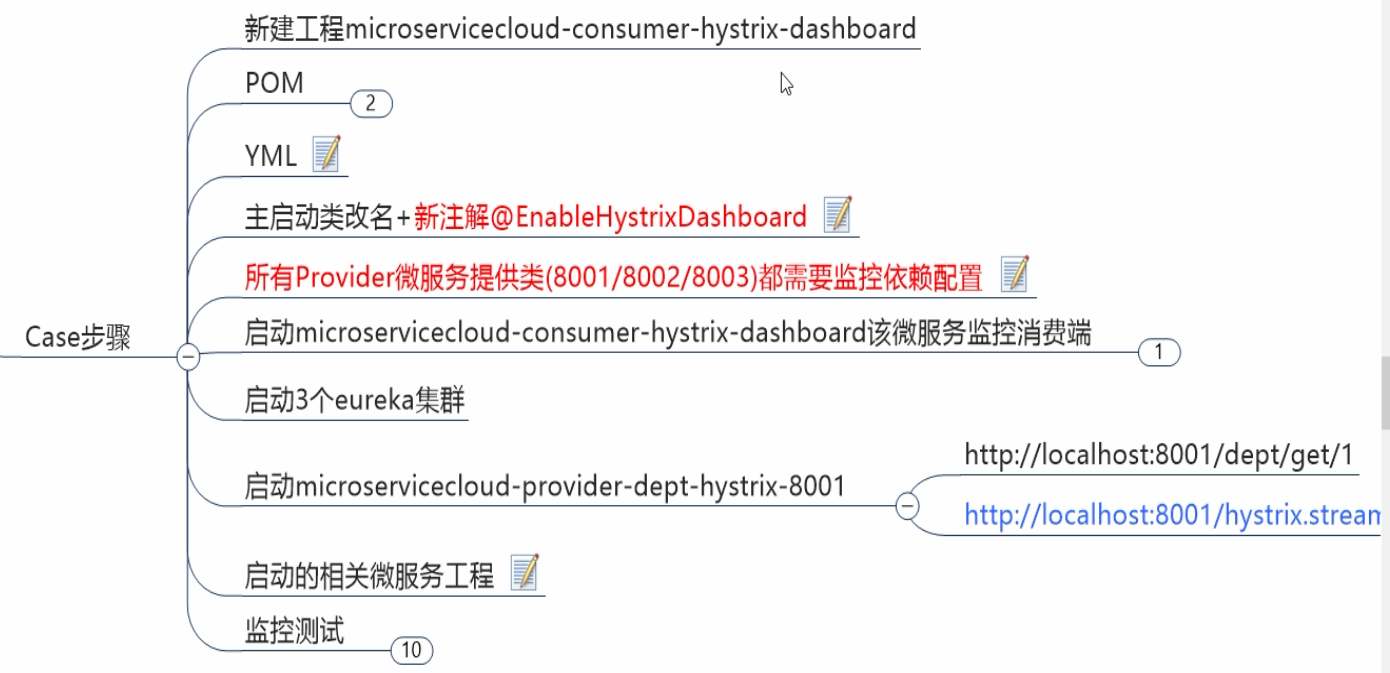
5.启动启动类
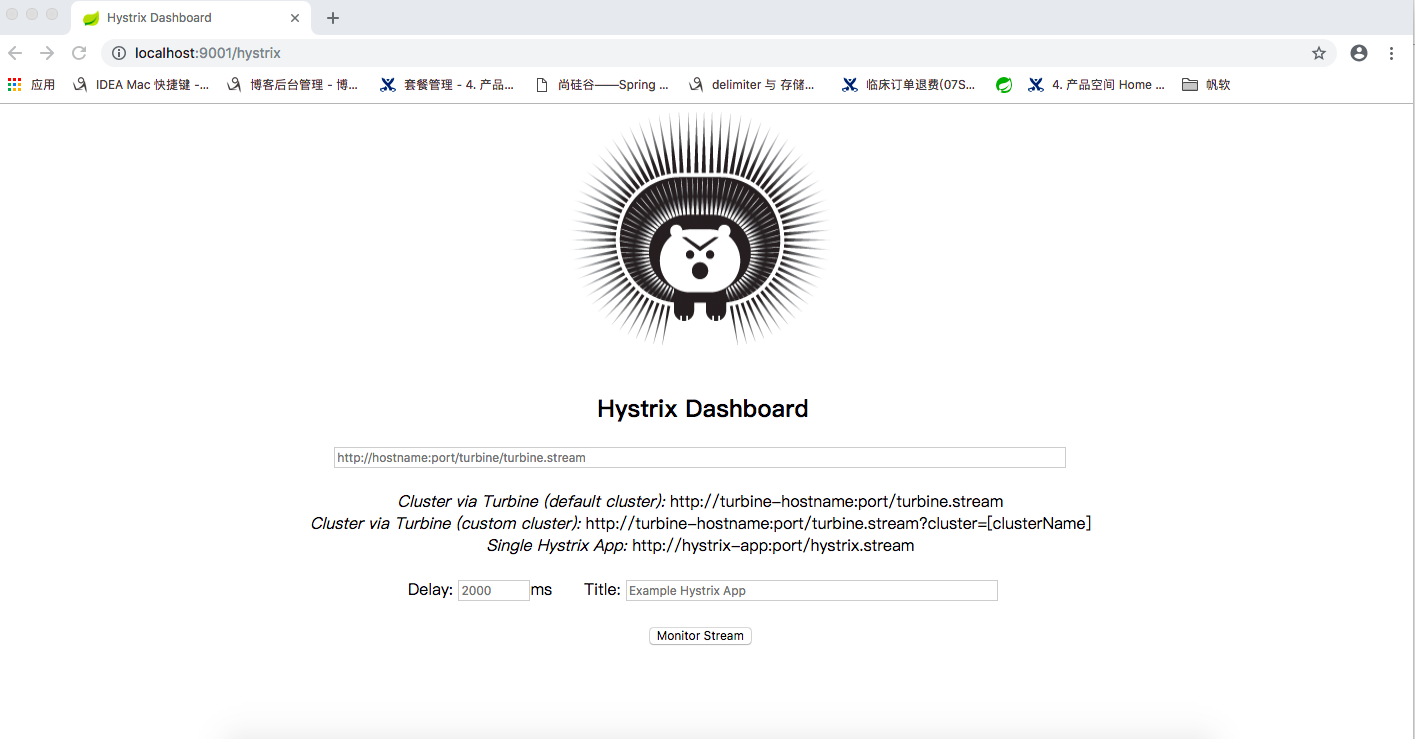
6.访问http://localhost:9001/hystrix
按图解启动三个euraka集群服务
microservicecloud-eureka-7001
microservicecloud-eureka-7002
microservicecloud-eureka-7003
然后启动项目:
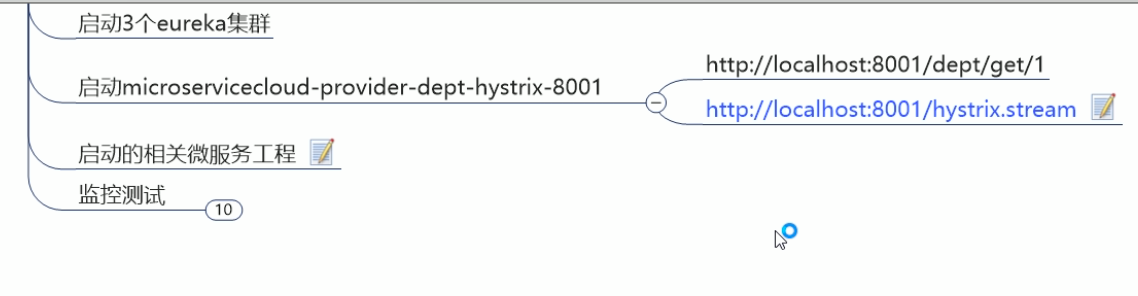
microservicecloud-provider-dept-8001-hystrix
(带有熔断功能的微服务注册到了eureka集群,且被豪猪仪表盘项目【microservicecloud-consumer-hystrix-dashboard】监控)
访问:
http://localhost:8001/dept/get/1
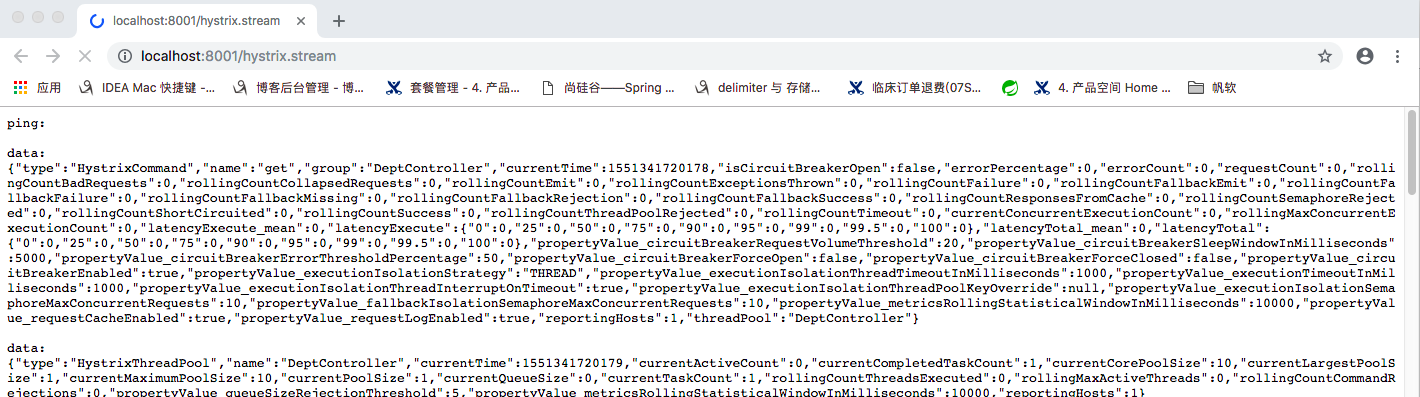
http://localhost:8001/hystrix.stream
ping 监控的仪表盘 json数据
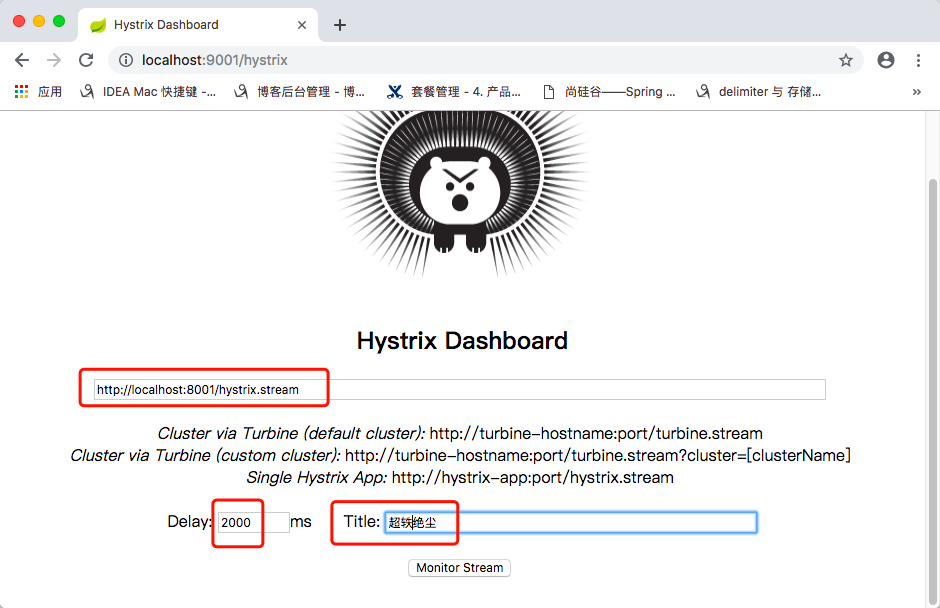
1 : Delay :该参数用来控制服务器上轮询监控信息的延迟时间,默认为 2000毫秒,可以通过配置该属性来降低客户端的网络和 CPU 消耗。
2 : Title :该参数对应了头部标题Hystrixstream 之后的内容,默认会使用具体监控实例的 URL ,可以通过配置该信息来展示更合适的标题。
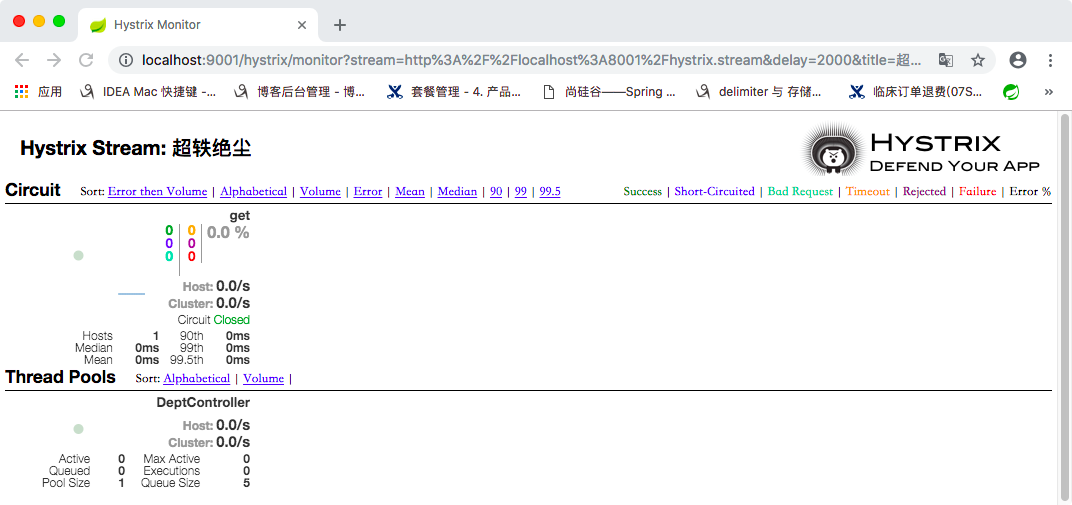
多次刷8001的功能接口: http://localhost:8001/dept/get/1,会看到仪表盘图形页面有如下变化:
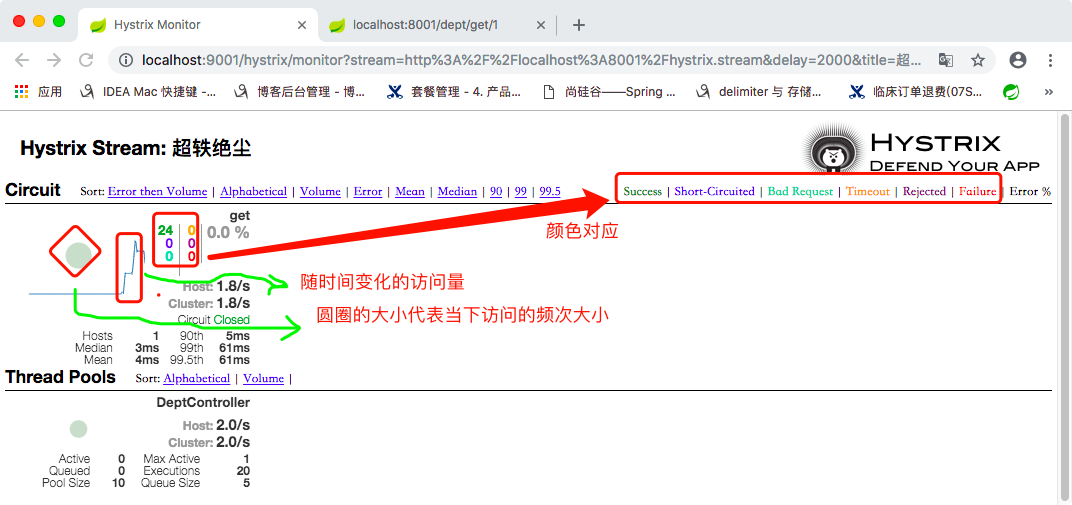
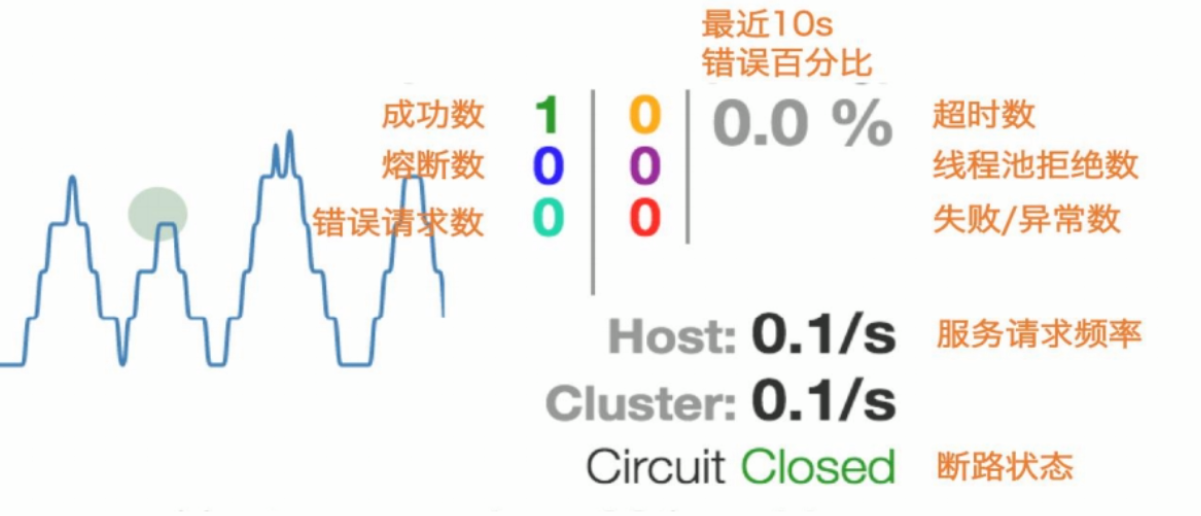
实心圆:共有两种含义。它通过颜色的变化代表了实例的健康程度,它的健康度从绿色<黄色<橙色<红色递减。
该实心圆除了颜色的变化之外,它的大小也会根据实例的请求流量发生变化,流量越大该实心圆就越大。
所以通过该实心圆的展示,就可以在大量的实例中快速的发现故障实例和高压力实例。
【六】Hystrix Dashboard的更多相关文章
- Spring Cloud第六篇 | Hystrix仪表盘监控Hystrix Dashboard
本文是Spring Cloud专栏的第六篇文章,了解前五篇文章内容有助于更好的理解本文: Spring Cloud第一篇 | Spring Cloud前言及其常用组件介绍概览 Spring Cloud ...
- Spring Cloud Hystrix Dashboard熔断器-Turbine集群监控(六)
序言 上一篇说啦hystrix的使用方法与配置还有工作流程及为何存在,我去,上一篇这么屌,去看看吧,没这么屌的话,我贴的有官方文档,好好仔细看看 hystrix除啦基本的熔断器功能之外,还可以对接口的 ...
- spring cloud深入学习(六)-----熔断监控Hystrix Dashboard和Turbine
Hystrix-dashboard是一款针对Hystrix进行实时监控的工具,通过Hystrix Dashboard我们可以在直观地看到各Hystrix Command的请求响应时间, 请求成功率等数 ...
- 服务容错保护断路器Hystrix之三:断路器监控(Hystrix Dashboard)-单体监控
turbine:英 [ˈtɜ:baɪn] 美 [ˈtɜ:rbaɪn] n.汽轮机;涡轮机;透平机 一.Hystrix Dashboard简介 在微服务架构中为了保证程序的可用性,防止程序出错导致网络阻 ...
- SpringCloud (十) Hystrix Dashboard单体监控、集群监控、与消息代理结合
一.前言 Dashboard又称为仪表盘,是用来监控项目的执行情况的,本文旨在Dashboard的使用 分别为单体监控.集群监控.与消息代理结合. 代码请戳我的github 二.快速入门 新建一个Sp ...
- 【SpringCloud】第十一篇: 断路器监控(Hystrix Dashboard)
前言: 必需学会SpringBoot基础知识 简介: spring cloud 为开发人员提供了快速构建分布式系统的一些工具,包括配置管理.服务发现.断路器.路由.微代理.事件总线.全局锁.决策竞选. ...
- springcloud(五):熔断监控Hystrix Dashboard和Turbine
Hystrix-dashboard是一款针对Hystrix进行实时监控的工具,通过Hystrix Dashboard我们可以在直观地看到各Hystrix Command的请求响应时间, 请求成功率等数 ...
- spring cloud熔断监控Hystrix Dashboard和Turbine
参考: http://blog.csdn.net/ityouknow/article/details/72625646 完整pom <?xml version="1.0" e ...
- 解决Hystrix Dashboard 一直是Loading ...的情况
Hystrix是什么 Hystrix 能使你的系统在出现依赖服务失效的时候,通过隔离系统所依赖的服务,防止服务级联失败,同时提供失败回退机制,更优雅地应对失效,并使你的系统能更快地从异常中恢复. Hy ...
随机推荐
- hexo博客添加功能
设置Hexo主题模式 Hexo主题中,有三种不同的模式,通过切换模式,让NexT主题显示不一样的样式.在NexT根目录下有一个同样名称为_config.yml,为了区分hexo根目录下的_config ...
- CentOS下Denyhosts的安装和使用
安装 默认yum就可以进行安装 yum install denyhosts* -y 配置 配置文件路径: /etc/denyhosts.conf ; YUM安装时其实已经配置好了大部分,我们自己稍作改 ...
- HDU--5519 Sequence II (主席树)
题目链接 2016年长春ccpc I 题 题目大意 : 给你n(n≤2∗105n≤2∗105)个数,每个数的大小 0<Ai≤2∗10^5 0<Ai≤2∗10^5. 再给你m(m≤2∗1 ...
- Learn to securely share files on the blockchain with IPFS!
https://medium.com/@mycoralhealth/learn-to-securely-share-files-on-the-blockchain-with-ipfs-219ee47d ...
- P1966 火柴排队
这道题需要小小的思考一波 (然而我思考了两节课) 好,我们先得出一个结论:a中第k大的与b中第k大的一定要排在一起,才能保证最小. 然后发现:挪a,b其实没有区别,故我们固定a,挪b. 然后我们就思考 ...
- A1120. Friend Numbers
Two integers are called "friend numbers" if they share the same sum of their digits, and t ...
- TP5.0+小程序商城构建(1)
1.导语 1.整体的思路与编程思想(大局观.AOP面向切面编程,10-20%) 2.具体的编程知识与技巧(TP5.小程序.数据库等80%) 2.课程内容与产品技术点 1.ThinkPHP5框架 1.编 ...
- tensorflow不同版本安装与升级/降级
https://blog.csdn.net/junmuzi/article/details/78357371 首先,可以安装一个anaconda. 然后使用python的pip可以安装特定版本的ten ...
- [转]深入理解CSS中的层叠上下文和层叠顺序
http://www.zhangxinxu.com/wordpress/2016/01/understand-css-stacking-context-order-z-index/ 零.世间的道理都是 ...
- 斯坦福大学公开课机器学习: machine learning system design | error analysis(误差分析:检验算法是否有高偏差和高方差)
误差分析可以更系统地做出决定.如果你准备研究机器学习的东西或者构造机器学习应用程序,最好的实践方法不是建立一个非常复杂的系统.拥有多么复杂的变量,而是构建一个简单的算法.这样你可以很快地实现它.研究机 ...