
Top 10 Java Debugging Tips with Eclipse
In this tutorial we will see about debugging java applications using Eclipse. Debugging helps us to identify and fix defects in the application. We will focus on run-time issues and not compile time errors. There are command line debuggers like gdb available. In this tutorial we will focus on GUI based debugger and we take our favourite IDE Eclipse to run through the tutorial. Though we say Eclipse, the points are mostly generic and is suitable for debugging using most of the IDEs like NetBeans too.
Before going through this tutorial, I recommend you to have a look at Eclipse shortcuts and it will really help. My Eclipse version is Juno as of writing this tutorial.
- Do not use System.out.println as a tool to debug.
- Enable detailed log level of all the components involved.
- Use a log analyzer to read logs.
1. Conditional Breakpoint
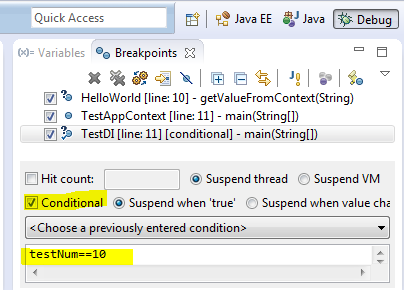
Hope we know how to add a breakpoint. If not, just click on the left pane (just before the line number) and a breakpoint will be created. In debug perspective, ‘Breakpoints’ view will list the breakpoint created. We can add a boolean condition to it. That is, the breakpoint will be activated and execution will hold only if the boolean condition is met otherwise this breakpoint will be skipped.
2. Exception Breakpoint
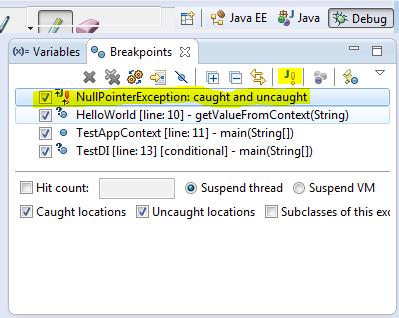
In Breakpoints view there is a button labeled as J! We can use that button to add a java exception based breakpoint. For example we want the program to halt and allow to debug when a NullPointerException is thrown we can add a breakpoint using this.
3. Watch Point
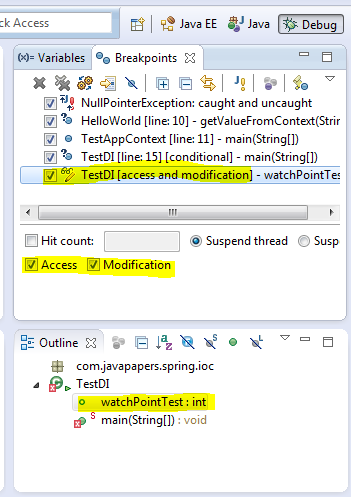
This is one nice feature I love. When a chosen attribute is accessed or modified program execution will halt and allow to debug. Select a class variable in Outline view and from its context menu select Toggle Watchpoint. This will create a watch point for that attribute and it will be listed in Breakpoints view.
4. Evaluation (Display or Inspect or Watch)
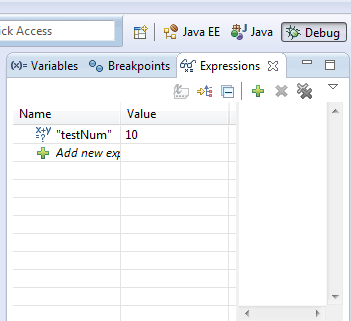
Ctrl+Shift+d or Ctrl+Shift+i on a selected variable or expression
will show the value. We can also add a permanent watch on an
expression/variable which will be shown in Expressions view when debug
is on.
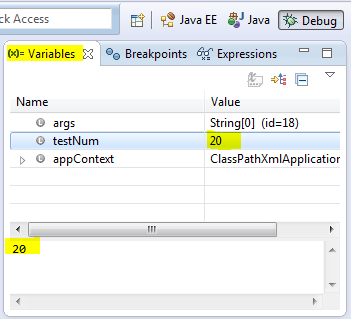
5. Change Variable Values
We can change the value of a variable on the fly during debug. Choose
a variable and go to Variables view and select the value, type and
enter.
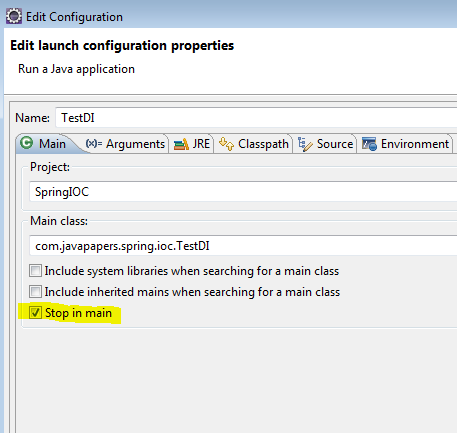
6. Stop in Main
In Run/Debug Settings, Edit Configuration we can enable a check box
that says Stop in main. If enabled when we debug a java program that
launches with a main method, the execution halts at first line of main
method.
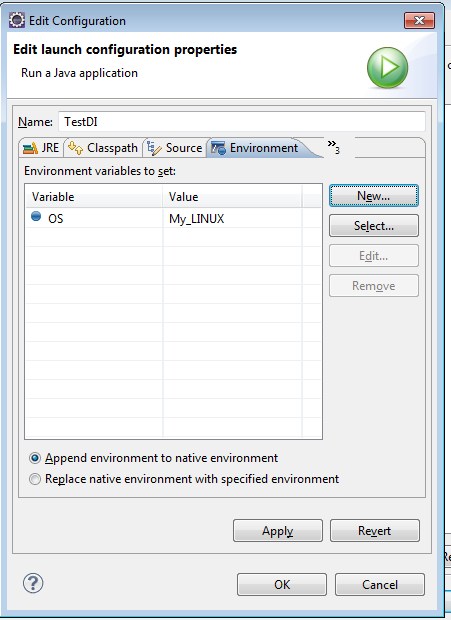
7. Environment Variables
Instead of going to System properties to add an environment variable,
we can conveniently add it through Edit Configuration dialog box.
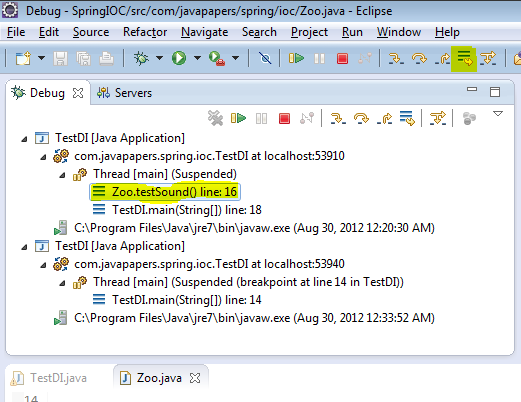
8. Drop to Frame
This is the second best feature I love. We can just return the
control to any frame in the call stack during debug. Changes made to
variables will not be reset. Choose the stack level which you want to go
back and restart debug from there and click the drop to frame button
from debug toolbar. Eclipse is cool!
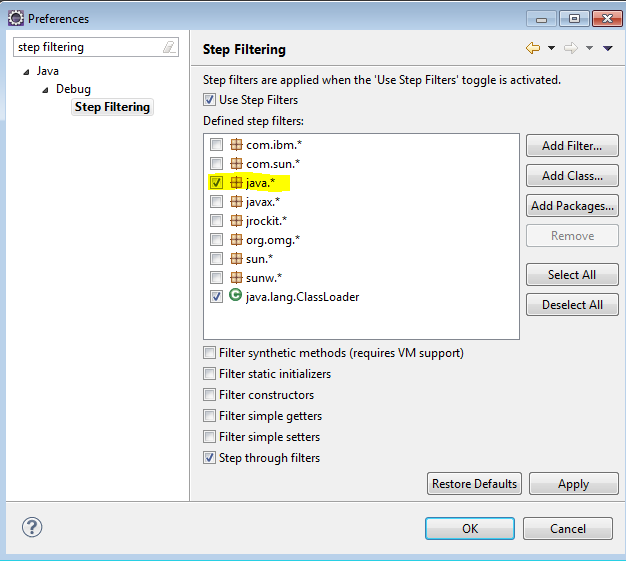
9. Step Filter
When we Step Into (F5) a method we may go into external libraries
(like java) and we may not need it. We can add a filter in preferences
and exclude packages.
10. Step Into, Over and Return
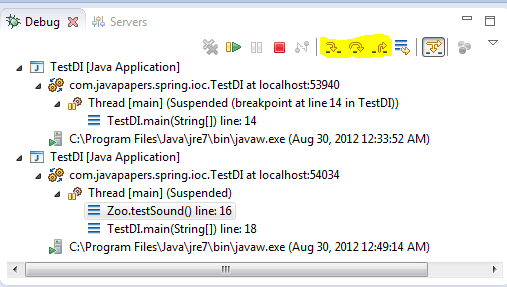
I kept this as the last point as this is the first thing to learn in debugging :-)
- F5 – Step Into: moves to next step and if the current line has a
method call the control will go into the first line of the called
method. - F6 – Step Over: moves the control to next line. If there is a method
call in the current line, it executes the method call internally and
just moves the control to next line. - F7 – Step Return: When done from inside a method the control will
move to the calling line from where the current method is invoked. - F8 – Move to next breakpoint.
This Core Java tutorial was added on 30/08/2012.
Top 10 Java Debugging Tips with Eclipse的更多相关文章
- Top 10 Methods for Java Arrays
作者:X Wang 出处:http://www.programcreek.com/2013/09/top-10-methods-for-java-arrays/ 转载文章,转载请注明作者和出处 The ...
- Top 10 Questions about Java Exceptions--reference
reference from:http://www.programcreek.com/2013/10/top-10-questions-about-java-exceptions/ This arti ...
- Top 10 Mistakes Java Developers Make--reference
This list summarizes the top 10 mistakes that Java developers frequently make. #1. Convert Array to ...
- Top 10 Mistakes Java Developers Make(转)
文章列出了Java开发者最常犯的是个错误. 1.将数组转换为ArrayList 为了将数组转换为ArrayList,开发者经常会这样做: ? 1 List<String> list = A ...
- Java Debugging with Eclipse - Tutorial
1.1. What is debugging? Debugging allows you to run a program interactively while watching the sourc ...
- 【翻译】Java Array的排名前十方法(Top 10 Methods for Java Arrays)
这里列举了Java Array 的前十的方法.他们在stackoverflow最大投票的问题. The following are top 10 methods for Java Array. The ...
- TOP 10 ONLINE COMPILER
Top 10 Online Compilers +1338 Tweet Share106 Share Pin 444 Shares Online compilers are one type of t ...
- TOP 10开源的推荐系统简介
最近这两年推荐系统特别火,本文搜集整理了一些比较好的开源推荐系统,即有轻量级的适用于做研究的SVDFeature.LibMF.LibFM等,也有重量级的适用于工业系统的 Mahout.Oryx.Eas ...
- Top 10 Algorithms for Coding Interview--reference
By X Wang Update History:Web Version latest update: 4/6/2014PDF Version latest update: 1/16/2014 The ...
随机推荐
- iOS开发内购图文教程
2015年最全的内购图文教程,首先是填各种资料,最后是代码,废话不多说,直接上图 ======================第一部分协议=============== 第一步.png 第二步.jpg ...
- View.setTag()的作用
//这个东西在一些需要用到Adapter自定控件显示方式的时候非常有用 //Adapter 有个getView方法,可以使用setTag把查找的view缓存起来方便多次重用 public View g ...
- Shell脚本——中继DHCP服务器自动部署
详细说明参照: (四)跟我一起玩Linux网络服务:DHCP服务配置之中继代理 vm1的脚本是: #! /bin/bash HIPSEG="10.10.10" SIPSEG=&qu ...
- jquery data方法取值与js attr取值的区别
<a data-v="3"></a> jquery data方法的运行机制: 第一次查找dom,使用attributes获取到dom节点值,并将其值存到缓存 ...
- 受教了,memcache比较全面点的介绍,受益匪浅,适用memcached的业务场景有哪些?memcached的cache机制是怎样的?在设计应用时,可以通过Memcached缓存那些内容?
基本问题 1.memcached的基本设置 1)启动Memcache的服务器端 # /usr/local/bin/memcached -d -m 10 -u root -l 192.168.0.200 ...
- 使用awstats统计分析tengine日志访问量及各种http网站数据
下载awstats最新安装包并解压 cd /usr/local/src wget http://www.awstats.org/files/awstats-7.3.tar.gz tar -zxvf a ...
- MVC5 学习笔记1
新装了vs2013 开始试着学习MVC5 首先用了2013的内置的框架 这里提三点 1. bootstrap (现已加入mvc5豪华套餐) 他的框架已经加入了bootstrap 3.0的版本(http ...
- TaskMgr C#技术拾遗
1. DataGridView和ContextMenuStrip的绑定是发生在DataGridView的CellMouseClick事件,在事件中指定右键菜单弹出: 2. DataGridView的列 ...
- 使用expect实现批量操作的自动化
http://blog.csdn.net/hijk139/article/details/9121345
- xstream 别名的用法<转>
1.xstream的alias使用方法: 1.1 作用:将序列化中的类全量名称,用别名替换. 1.2 使用方法:xstream.alias("blog", Blog.class) ...