[D3] 9. Scatter Plot
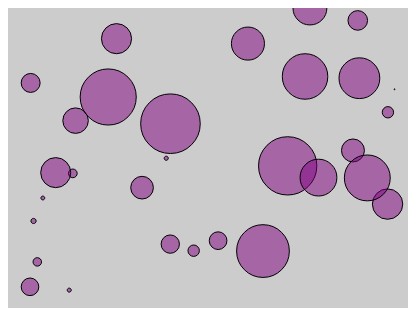
Up until now we've just looked at bar charts. A handy chart, no doubt, but D3 offers a variety of charts you can work with. In this lesson we'll convert the bar chart into a basic scatter (or bubble) chart.
<!DOCTYPE html>

<html>

<head lang="en">

    <meta charset="UTF-8">

    <title></title>

    <script src="../bower_components/underscore/underscore-min.js"></script>

    <script src="../ventor/d3.min.js"></script>

    <style type="text/css">

        body

        {

            padding-top: 50px;

            padding-left: 100px;

        }

        #chartArea {

            width: 400px;

            height: 300px;

            background-color: #CCC;

        }

        .bar

        {

            display: inline-block;

            width: 20px;

            height: 75px; /* Gets overriden by D3-assigned height below */

            margin-right: 2px;

           /* fill: teal; *//* SVG doesn't have background prop, use fill instead*/

            z-index:99;

        }

        .bubble {

            display: inline-block;

            fill: purple;

            fill-opacity: 0.5;

            stroke: black;

            stroke-weight: 1px;

        }

    </style>

</head>

<body>

<section id="chartArea"></section>

<script>

    var dataset = _.map(_.range(30), function(num) {

        return {

            x: Math.random() * 100,

            y: Math.random() * 100,

            r: Math.random() * 30

        }

    }), //reandom generate 15 data from 1 to 50

            margin = {top: 0, bottom: 0, left: 0, right: 0},

            w = 400 - margin.left - margin.right,

            h = 300 -margin.top - margin.bottom;

    var svg = d3.select('#chartArea').append('svg')

            .attr('width', w + margin.left + margin.right)

            .attr('height', h + margin.top + margin.bottom)

            .append('g') //The last step is to add a G element which is a graphics container in SBG.

            .attr('transform', 'translate(' + margin.left + ', ' + margin.top + ')'); //Then offset that graphic element by our left and top margins.

    var yScale = d3.scale.linear()

            .domain([0, d3.max(dataset, function(d) {

                return d.y; //tell the max function just need to care about y prop

            })])

            .range([h, 0]);

    var xScale = d3.scale.linear()

            .domain([0, 100])

            .range([0, w]);

    svg.selectAll('circle')

            .data(dataset)

            .enter()

            .append('circle')// svg doesn't have div, use rect instead

            .attr('class', "bubble")

            .attr('cx', function(each_data, index){

                return xScale(each_data.x);

            })

            .attr('cy', function(each_data){

                return yScale(each_data.y);

            })

            .attr('r', function(each_data, i){

                return each_data.r;

            });

</script>

</body>

</html>
[D3] 9. Scatter Plot的更多相关文章
- [D3] Build a Scatter Plot with D3 v4
Scatter plots, sometimes also known as bubble charts, are another common type of visualization. They ...
- Matplotlib学习---用matplotlib画散点图,气泡图(scatter plot, bubble chart)
Matplotlib里有两种画散点图的方法,一种是用ax.plot画,一种是用ax.scatter画. 一. 用ax.plot画 ax.plot(x,y,marker="o",co ...
- [Python] Scatter Plot for daily return
Sploe = 2: means that SPY move up 1, ABC move up 2 Correlation: how close those dots close to the li ...
- use matplotlib to draw scatter plot
There are many pionts in this kind of table. How to do it? We can use scatter() to draw it. Code: im ...
- D3 JS study notes
如何使用d3来解析自定义格式的数据源? var psv = d3.dsvFormat("|"); // This parser can parse pipe-delimited t ...
- d3基础图形模板笔记
散点图(scatter plot): http://bl.ocks.org/weiglemc/6185069 雷达图(radar): http://xgfe.github.io/uploads/che ...
- matplotlib多plot可视化
代码: # -*- coding: utf-8 -*- """ Created on Thu Jul 12 16:37:47 2018 @author: zhen &qu ...
- Python基础-画图:matplotlib.pyplot.scatter
转载自博客:https://blog.csdn.net/qiu931110/article/details/68130199 matplotlib.pyplot.scatter 1.scatter函数 ...
- Python中scatter函数参数用法详解
1.scatter函数原型 2.其中散点的形状参数marker如下: 3.其中颜色参数c如下: 4.基本的使用方法如下: #导入必要的模块 import numpy as np import matp ...
随机推荐
- ssh登录docker容器
ssh登录docker容器1.启动一个docker容器# docker run -t -i ubuntu/ruby:v1 /bin/bash2.然后在容器里,安装openssh-server open ...
- Vue.js 2.0 和 React、Augular
Vue.js 2.0 和 React.Augular 引言 这个页面无疑是最难编写的,但也是非常重要的.或许你遇到了一些问题并且先前用其他的框架解决了.来这里的目的是看看Vue是否有更好的解决方案.那 ...
- ubuntu16.04添加开机启动任务
比如要把run-nexus.sh这个脚本制作成开机启动项. 系统工具->首选项->启动应用程序.添加该文件,即可.
- CommonsChunkPlugin的一些总结
CommonsChunkPlugin 官方文档地址 https://webpack.github.io/docs/list-of-plugins.html#commonschunkplugin new ...
- http://www.w3cplus.com/animation/create-animated-text-fills.html
关于svg的资料: http://www.w3cplus.com/animation/create-animated-text-fills.html asp.net中jquery的ajax调用cs文件 ...
- 高远介绍的好东东--django-celery
终于可以到异步消息机制的高档产品啦~~~ 不知能不能代替AJAX.. 参照官方文档试下: 中文文档: http://docs.jinkan.org/docs/celery/getting-starte ...
- 【BZOJ 1319】 Sgu261Discrete Rootsv (原根+BSGS+EXGCD)
1319: Sgu261Discrete Roots Time Limit: 1 Sec Memory Limit: 64 MBSubmit: 389 Solved: 172 Descriptio ...
- android 双向滑动 seekbar
实现原理: 1.自定义View,在onDraw(Canvas canvas)中,画出2个Drawable滑动块,2个Drawable滑动条,2个Paint(text) 2.监听onTouchEvent ...
- 使用Systrace分析UI性能
开发应用的时候,应该检查它是否有流畅的用户体验,即60fps的帧率.如果由于某种原因丢帧,我们首先要做的就是知道系统在做什么(造成丢帧的原因). Systrace允许你监视和跟踪Android系统的行 ...
- 转:Java图形化界面设计——布局管理器之FlowLayout(流式布局)其他请参考转载出处网址
http://blog.csdn.net/liujun13579/article/details/7771191 前文讲解了JFrame.JPanel,其中已经涉及到了空布局的使用.Java虽然可以以 ...