python数据可视化神库:Matplotlib快速入门
Matplotlib易于使用,是Python中了不起的可视化库。它建立在NumPy数组的基础上,旨在与更广泛的SciPy堆栈一起工作,并由几个图组成:线图、条形图、散点图、直方图等。
快速入门
import matplotlib.pyplot as plt
# initializing the data
x = [10, 20, 30, 40]
y = [20, 30, 40, 50]
# plotting the data
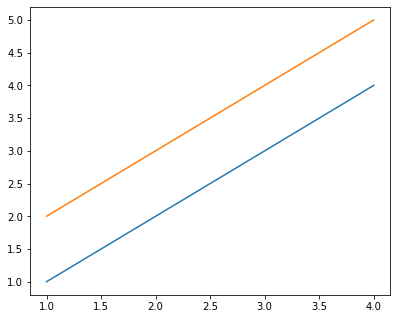
plt.plot(x, y)
# Adding the title
plt.title("Simple Plot")
# Adding the labels
plt.ylabel("y-axis")
plt.xlabel("x-axis")
plt.show()
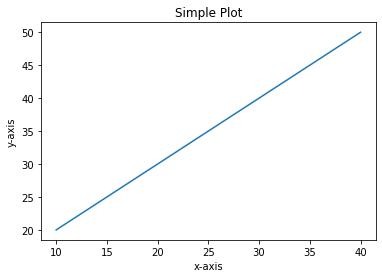
在上面的例子中,X和Y的元素提供了X轴和Y轴的坐标,并根据这些坐标绘制了一条直线。
Pyplot
Pyplot是一个Matplotlib模块,它提供了一个类似MATLAB的接口。Pyplot提供了与图形交互的函数,即创建图形,用标签装饰绘图,并在图形中创建绘图区。
语法:
matplotlib.pyplot.plot(*args, scalex=True, scaley=True, data=None, **kwargs)
import matplotlib.pyplot as plt

plt.plot([1, 2, 3, 4], [1, 4, 9, 16])

plt.axis([0, 6, 0, 20])

plt.show()

Matplotlib负责创建内置的默认值,如图(Figure)和轴(Axes)。
Figure
这个类是所有绘图的顶层容器,意味着它是整个窗口或页面,所有东西都在上面绘制。图形对象可以被认为是类似盒子的容器,可以容纳一个或多个轴。Axes
该类是创建子图的最基本和最灵活的组件。你可能会把轴混淆为轴的复数,但它是一个单独的情节或图形。给定的图可以包含许多轴,但给定的轴只能在一个图中出现。
Figure类
图类是包含一个或多个轴的顶层容器。它是整体的窗口或页面,所有的东西都在上面绘制。
语法:
class matplotlib.figure.Figure(figsize=None, dpi=None, facecolor=None, edgecolor=None, lineewidth=0.0, frameon=None, subplotpars=None, tight_layout=None, constrained_layout=None)
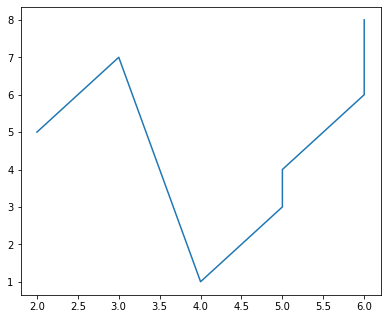
例1:
import matplotlib.pyplot as plt

from matplotlib.figure import Figure

# Creating a new figure with width = 5 inches

# and height = 4 inches

fig = plt.figure(figsize =(5, 4))

# Creating a new axes for the figure

ax = fig.add_axes([1, 1, 1, 1])

# Adding the data to be plotted

ax.plot([2, 3, 4, 5, 5, 6, 6],

        [5, 7, 1, 3, 4, 6 ,8])

plt.show()
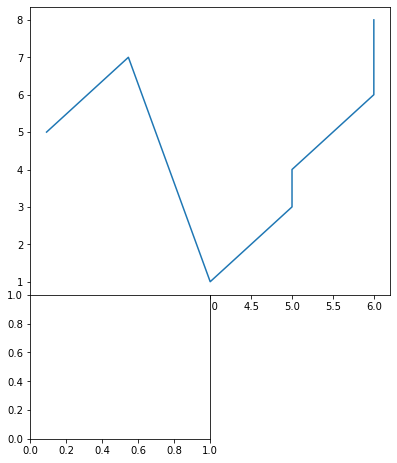
- 例2 多plot
import matplotlib.pyplot as plt

from matplotlib.figure import Figure

# Creating a new figure with width = 5 inches

# and height = 4 inches

fig = plt.figure(figsize =(5, 4))

# Creating first axes for the figure

ax1 = fig.add_axes([1, 1, 1, 1])

# Creating second axes for the figure

ax2 = fig.add_axes([1, 0.5, 0.5, 0.5])

# Adding the data to be plotted

ax1.plot([2, 3, 4, 5, 5, 6, 6],

         [5, 7, 1, 3, 4, 6 ,8])

ax2.plot([1, 2, 3, 4, 5],

         [2, 3, 4, 5, 6])

plt.show()
参考资料
- 本文涉及的python测试开发库 谢谢点赞! https://github.com/china-testing/python_cn_resouce
- python精品书籍下载 https://github.com/china-testing/python_cn_resouce/blob/main/python_good_books.md
- https://www.geeksforgeeks.org/matplotlib-tutorial/
- https://github.com/rougier/matplotlib-tutorial
Axes 类
轴类是创建子图的最基本和最灵活的单元。给定的图可以包含许多轴,但给定的轴只能出现在一个图中。axes()函数创建轴对象。让我们看看下面的例子。
语法:
matplotlib.pyplot.axis(*args, emit=True, **kwargs)
例1:
import matplotlib.pyplot as plt

from matplotlib.figure import Figure

# Creating the axes object with argument as

# [left, bottom, width, height]

ax = plt.axes([1, 1, 1, 1])
输出:
例2:
import matplotlib.pyplot as plt

from matplotlib.figure import Figure

fig = plt.figure(figsize = (5, 4))

# Adding the axes to the figure

ax = fig.add_axes([1, 1, 1, 1])

# plotting 1st dataset to the figure

ax1 = ax.plot([1, 2, 3, 4], [1, 2, 3, 4])

# plotting 2nd dataset to the figure

ax2 = ax.plot([1, 2, 3, 4], [2, 3, 4, 5])

plt.show()
输出:
- 三维图
Matplotlib在推出时,考虑到的只是二维绘图。但是在1.0版本发布的时候,三维工具是在二维的基础上开发的,因此,我们今天有一个三维数据的实现。
例子:
import matplotlib.pyplot as plt

# Creating the figure object

fig = plt.figure()

# keeping the projection = 3d

# creates the 3d plot

ax = plt.axes(projection = '3d')
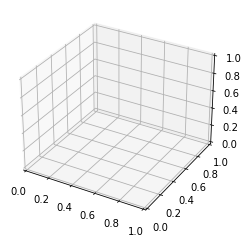
上面的代码让我们在Matplotlib中创建了一个三维图。我们可以创建不同类型的3D图,如散点图、等高线图、曲面图等。让我们来创建一个简单的三维线图。
例子:
import matplotlib.pyplot as plt

x = [1, 2, 3, 4, 5]

y = [1, 4, 9, 16, 25]

z = [1, 8, 27, 64, 125]

# Creating the figure object

fig = plt.figure()

# keeping the projection = 3d

# creates the 3d plot

ax = plt.axes(projection = '3d')

ax.plot3D(z, y, x)
输出:

处理图片
使用图像工作
matplotlib库中的图像模块是用来在Python中处理图像的。图像模块还包括两个有用的方法,即用于读取图像的imread和用于显示图像的imshow。
例子:
# importing required libraries

import matplotlib.pyplot as plt

import matplotlib.image as img

# reading the image

testImage = img.imread('test.png')

# displaying the image

plt.imshow(testImage)
python数据可视化神库:Matplotlib快速入门的更多相关文章
- Python数据可视化-seaborn库之countplot
在Python数据可视化中,seaborn较好的提供了图形的一些可视化功效. seaborn官方文档见链接:http://seaborn.pydata.org/api.html countplot是s ...
- dython:Python数据建模宝藏库
尽管已经有了scikit-learn.statsmodels.seaborn等非常优秀的数据建模库,但实际数据分析过程中常用到的一些功能场景仍然需要编写数十行以上的代码才能实现. 而今天要给大家推荐的 ...
- python 基本语法速览,快速入门
https://zhuanlan.zhihu.com/p/24536868 学习参考于这个博文. 我做一个笔记. 关于python一些常用的语法快速的预览,适合已经掌握一门编程语言的人.零基础,没有任 ...
- Matplotlib快速入门笔记
我正以Python作为突破口,入门机器学习相关知识.出于机器学习实践过程中的需要,快速了解了一下matplotlib绘图库.下图是我学习过程中整理的一些概念. 本文将以该图为线索梳理相关概念. 简介 ...
- Python数据科学“冷门”库
Python是一种神奇的语言.事实上,它是近几年世界上发展最快的编程语言之一,它一次又一次证明了它在开发工作和数据科学立场各行业的实用性.整个Python系统和库是对于世界各地的用户(无论是初学者或者 ...
- Python 什么是flask框架?快速入门
一:Python flask框架 前言 1.Python 面向对象的高级编程语言,以其语法简单.免费开源.免编译扩展性高,同时也可以嵌入到C/C++程序和丰富的第三方库,Python运用到大数据分析. ...
- Python 什么是flask框架?快速入门(flask安装,登录,新手三件套,登录认证装饰器,配置文件,路由系统,CBV)
目录 一:Python flask框架 前言 补充一下,我们前面学习的库都是叫模块,那么框架与库的区别? 二:flask 框架概述 1.简介 2.须知: 3.flask框架的优势 三:flask 安装 ...
- 【数据可视化-pyecharts】pyecharts快速入门
pyecharts快速开始 首先开始来绘制你的第一个图表 from pyecharts import Bar bar = Bar("我的第一个图表", "这里是副标题&q ...
- Matplotlib快速入门
Matplotlib 可能还有小伙伴不知道Matplotlib是什么,下面是维基百科的介绍. Matplotlib 是Python编程语言的一个绘图库及其数值数学扩展 NumPy.它为利用通用的图形用 ...
- python自然语言处理函数库nltk从入门到精通
1. 关于Python安装的补充 若在ubuntu系统中同时安装了Python2和python3,则输入python或python2命令打开python2.x版本的控制台:输入python3命令打开p ...
随机推荐
- JavaScript之jQuery要点记录
一 属性和属性节点 1.什么是属性? 对象身上保存的变量就是属性 2.如何操作属性? 对象.属性名称 = 值; 对象.属性名称; 对象["属性名称"] = 值; 对象[" ...
- ValueError: unsupported format character ‘Y‘ (0x59) at index 70
错误信息:ValueError: unsupported format character 'Y' (0x59) at index 70产生原因:因为python执行的sql中存在类似DATE_FOR ...
- 【python】yaml文件的读写
[python]yaml文件的读写 冰冷的希望 2020-10-22 18:31:47 442 收藏 1分类专栏: python 文章标签: python yaml版权 python专栏收录该内容67 ...
- VUE配置proxy代理、开发环境、测试环境、生产环境
VUE配置proxy代理.开发环境.测试环境.生产环境 前端开发过程中,我们经常会碰到跨域的问题,下面我们来配置下,不同的环境下,统一的跨域问题解决. 1.根目录下新建三个环境的配置文件,.env.d ...
- 文件的上传&预览&下载学习(五)
1.背景 一个知识库,要求文件对不同的角色有不同的实现,比如某些角色只能在线预览,某些可以下载.在线观看. 2.分析 知识库其实也可以看做商品表,商品有商品图片(商品表与文件信息表做关联,因为商品有多 ...
- AD域安全攻防实践(附攻防矩阵图)
以域控为基础架构,通过域控实现对用户和计算机资源的统一管理,带来便利的同时也成为了最受攻击者重点攻击的集权系统. 01.攻击篇 针对域控的攻击技术,在Windows通用攻击技术的基础上自成一套技术体系 ...
- 认识流媒体协议,从 RTSP 协议解析开始!
RTSP 是 Internet 协议规范,是 TCP/IP 协议体系中的一个应用层协议级网络通信系统.专为娱乐(如音频和视频)和通信系统的使用,以控制流媒体服务器.该协议用于在端点之间建立和控制媒体会 ...
- C++/Qt网络通讯模块设计与实现(四)
在C++/Qt网络通讯模块设计与实现(三)中提到了一个概念,即接受者所依附的线程:关注我微信公众号的技术朋友留言对该概念还是不解,这节就单独讲述这个概念的理论与实际应用,这种应用无处不在,因为与Qt的 ...
- CSS 高阶小技巧 - 角向渐变的妙用!
本文将介绍一个角向渐变的一个非常有意思的小技巧! 我们尝试使用 CSS 绘制如下图形: 在之前,类似的图案,其实我们有尝试过,在 单标签实现复杂的棋盘布局 一文中,我们用单标签实现了这样一个棋盘布局: ...
- IntelliJ IDEA 下载安装及配置使用教程(图文步骤详解)
前言 壹哥在前面的文章中,带大家下载.安装.配置了Eclipse这个更好用的IDE开发工具,并教会了大家如何在Eclipse中进行项目的创建和代码编写.运行.但是实际上,在各种IDE开发工具中,Ecl ...