
ELk(Elasticsearch, Logstash, Kibana)的安装配置
ELk(Elasticsearch, Logstash, Kibana)的安装配置
本文中所有的版本都是基于5.2.0,因为公司es(Elasticsearch)的环境是5.2.0。
1. Elasticsearch的安装-官网
关于Elasticsearch的安装在之前的文章中已经写过了,这里不再赘述。
[elasticsearch及head插件安装与配置](https://www.cnblogs.com/chaos-x/p/9446250.html)
2. Kibana的安装配置-官网
Kibana是一个能把你es中数据进行可视化显示的工具,包括实时统计和分析,基本上是零配置。
1. Kibana下载地址
Kibana 5.2.0 linux 64-bit tar.gz
wget https://artifacts.elastic.co/downloads/kibana/kibana-5.2.0-linux-x86_64.tar.gz
2.解压
tar -zxvf kibana-5.2.0-linux-x86_64.tar.gz
3. 配置
vim kibana-5.2.0-linux-x86_64/config/kibana.yml
# Kibana is served by a back end server. This setting specifies the port to use.

server.port: 30000

# Specifies the address to which the Kibana server will bind. IP addresses and host names are both valid values.

# The default is 'localhost', which usually means remote machines will not be able to connect.

# To allow connections from remote users, set this parameter to a non-loopback address.

server.host: "0.0.0.0"

# The URL of the Elasticsearch instance to use for all your queries.

# es的访问地址和商品号

elasticsearch.url: "http://localhost:19200"
- 启动
sh kibana-5.2.0-linux-x86_64/bin/kibana
在浏览器中访问Kibana的服务器加端口号就可以看到Kibana的页面了。
3. Logstash的安装配置-官网
Logstash是日志的收集工具,可以对日志进行收集,分析,解码,过滤,输出。一般使用Filebeat收集日志到Logstash,由Logstash处理后保存到es。关于Filebeat后面再说。
1. 下载
https://artifacts.elastic.co/downloads/logstash/logstash-5.2.0.tar.gz
wget https://artifacts.elastic.co/downloads/logstash/logstash-5.2.0.tar.gz
2. 解压
tar -zxvf logstash-5.2.0.tar.gz
3. 启动
sh logstash-5.2.0/bin/logstash -e 'input{stdin{}}output{stdout{codec=>rubydebug}}'
启动后输入'hello word',回车。会输出如下结果
{

       "message" => "Hello World",

      "@version" => "1",

    "@timestamp" => "2014-08-07T10:30:59.937Z",

          "host" => "raochenlindeMacBook-Air.local",

}
Logstash 会给事件添加一些额外信息。最重要的就是 @timestamp,用来标记事件的发生时间。因为这个字段涉及到 Logstash 的内部流转,所以必须是一个 joda 对象,如果你尝试自己给一个字符串字段重命名为 @timestamp 的话,Logstash 会直接报错。所以,请使用 filters/date 插件 来管理这个特殊字段。
4. 配置
可以把把配置写到一个文件中,来启动Logstash。
- 在Logstash的配置文件目录中创建
test.yml文件
cd logstash-5.2.0/config/

vim test.yml
- 配置文件内容
input{

    stdin{}

}

ouput{

    stdout{

        codec=>rubydebug

    }

}
- 启动
sh logstash-5.2.0/bin/logstash -f logstash-5.2.0/config/test.yml
可以达步骤3的效果。
4. 使用ELK收集nginx的访问日志
1.配置Logstash
- 在Logstash的配置文件目录中创建
nginx-log.yml文件
cd logstash-5.2.0/config/

vim nginx-log.yml
- 配置文件内容
input {

  file {  # 指定一个文件作为输入源

    path => "/usr/local/nginx/logs/access.log"  # 指定文件的路径

    start_position => "beginning"  # 指定何时开始收集,这时设置从文件的最开头收集

    type => "nginx"  # 定义日志类型,可自定义

  }

}

filter {  # 配置过滤器

    grok {

        match => { "message" => "%{IPORHOST:http_host} %{IPORHOST:clientip} - %{USERNAME:remote_user} \[%{HTTPDATE:timestamp}\] \"(?:%{WORD:http_verb} %{NOTSPACE:http_request}(?: HTTP/%{NUMBER:http_version})?|%{DATA:raw_http_request})\" %{NUMBER:response} (?:%{NUMBER:bytes_read}|-) %{QS:referrer} %{QS:agent} %{QS:xforwardedfor} %{NUMBER:request_time:float}"}  # 定义日志的输出格式

    }

    geoip {

        source => "clientip"

    }

}

output {

	# 标准输出,是输出到终端

    stdout { codec => rubydebug }

    # 输出到es

    elasticsearch {

        hosts => ["127.0.0.1:19200"]

        index => "nginx-log-%{+YYYY.MM.dd}"

  }

}
- 检查配置文件
sh logstash --path.settings /etc/logstash/ -f logstash-5.2.0/config/nginx-log.yml --config.test_and_exit
2. 配置nginx的配置文件
- 打开nginx的配置文件
vim /usr/local/nginx/conf/nginx.conf
- 在http中增加如下内容
http {

    include       mime.types;

    default_type  application/octet-stream;

    #log_format  main  '$remote_addr - $remote_user [$time_local] "$request" '

    #                  '$status $body_bytes_sent "$http_referer" '

    #                  '"$http_user_agent" "$http_x_forwarded_for"';

    log_format main2 '$http_host $remote_addr - $remote_user [$time_local] "$request" '

                      '$status $body_bytes_sent "$http_referer" '

                      '"$http_user_agent" "$upstream_addr" $request_time';

}
- 在要格式化日志的 server中增加如下配置
 		#access_log  logs/host.access.log  main;

        # 增加如下内容, 日志格式化main2要在上面定义,不然这里无法引用

        access_log  logs/elk_access.log  main2;

        location / {

            root   html;

            index  index.html index.htm;

            # 增加如下三行内容,分别是携带访问host,远程地址和各层代理地址

            proxy_set_header Host   $host;

            proxy_set_header X-Real-IP      $remote_addr;

            proxy_set_header X-Forwarded-For $proxy_add_x_forwarded_for;

        }
- 重启nginx
sh /usr/local/nginx/sbin/nginx -s reload
3. 检查启动
- 检查
sh logstash-5.2.0/bin/logstash -f logstash-5.2.0/config/nginx-log.yml --config.test_and_exit
- 启动
sh logstash-5.2.0/bin/logstash -f logstash-5.2.0/config/nginx-log.yml
当终端输出如下内容就成功了
{

         "@timestamp" => 2018-12-18T08:44:56.361Z,

    "plugin_instance" => "vda",

               "read" => 467266,

             "plugin" => "disk",

               "host" => "172.24.121.18",

           "@version" => "1",

      "collectd_type" => "disk_ops",

               "type" => "collectd",

              "write" => 12204609

}

{

         "longterm" => 0.08,

       "@timestamp" => 2018-12-18T08:44:46.362Z,

           "plugin" => "load",

        "shortterm" => 0.06,

             "host" => "172.24.121.18",

         "@version" => "1",

    "collectd_type" => "load",

             "type" => "collectd",

          "midterm" => 0.04

}
5. Kibana展示nginx访问日志
进入Kibana页面如下

- 配置Index Patterns
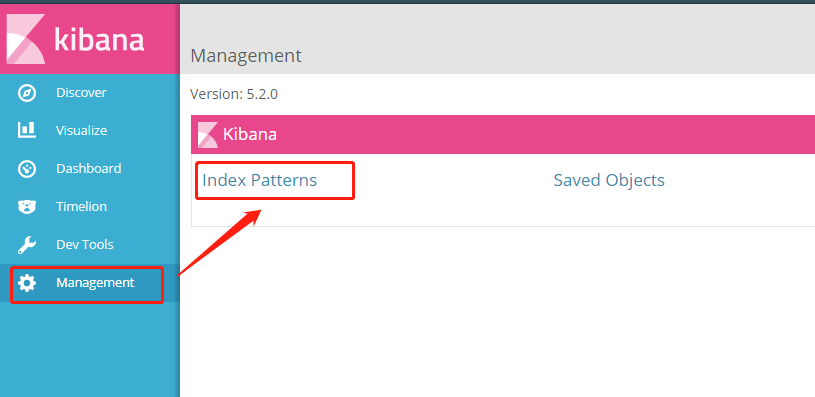
- 进入后点击左上角的 ‘add new’ 进行创建索引模板
在Kibana中,要分析展示数据时,要先创建Index Patterns

选择index的时候可以用通配符 ‘*’ 来把所有的nginx-log的访问日志分成一个组。
Time-field name 是要指定一个日期格式的字段,以便于后面统计使用。
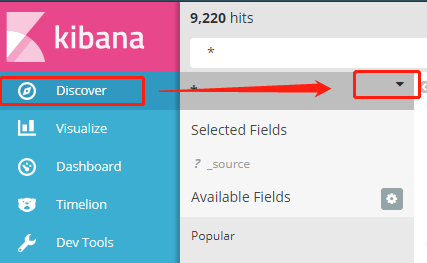
然后就可以在这里选择配置好的Index patterns了。

其中x轴的时间就是创建Index Patterns的时候选择的那个日期字段。
参考:
本文中所有的版本都是基于5.2.0,因为公司es(Elasticsearch)的环境是5.2.0。
1. Elasticsearch的安装-官网
关于Elasticsearch的安装在之前的文章中已经写过了,这里不再赘述。
[elasticsearch及head插件安装与配置](https://www.cnblogs.com/chaos-x/p/9446250.html)
2. Kibana的安装配置-官网
Kibana是一个能把你es中数据进行可视化显示的工具,包括实时统计和分析,基本上是零配置。
1. Kibana下载地址
Kibana 5.2.0 linux 64-bit tar.gz
wget https://artifacts.elastic.co/downloads/kibana/kibana-5.2.0-linux-x86_64.tar.gz
2.解压
tar -zxvf kibana-5.2.0-linux-x86_64.tar.gz
3. 配置
vim kibana-5.2.0-linux-x86_64/config/kibana.yml
# Kibana is served by a back end server. This setting specifies the port to use.

server.port: 30000

# Specifies the address to which the Kibana server will bind. IP addresses and host names are both valid values.

# The default is 'localhost', which usually means remote machines will not be able to connect.

# To allow connections from remote users, set this parameter to a non-loopback address.

server.host: "0.0.0.0"

# The URL of the Elasticsearch instance to use for all your queries.

# es的访问地址和商品号

elasticsearch.url: "http://localhost:19200"
- 启动
sh kibana-5.2.0-linux-x86_64/bin/kibana
在浏览器中访问Kibana的服务器加端口号就可以看到Kibana的页面了。
3. Logstash的安装配置-官网
Logstash是日志的收集工具,可以对日志进行收集,分析,解码,过滤,输出。一般使用Filebeat收集日志到Logstash,由Logstash处理后保存到es。关于Filebeat后面再说。
1. 下载
https://artifacts.elastic.co/downloads/logstash/logstash-5.2.0.tar.gz
wget https://artifacts.elastic.co/downloads/logstash/logstash-5.2.0.tar.gz
2. 解压
tar -zxvf logstash-5.2.0.tar.gz
3. 启动
sh logstash-5.2.0/bin/logstash -e 'input{stdin{}}output{stdout{codec=>rubydebug}}'
启动后输入'hello word',回车。会输出如下结果
{

       "message" => "Hello World",

      "@version" => "1",

    "@timestamp" => "2014-08-07T10:30:59.937Z",

          "host" => "raochenlindeMacBook-Air.local",

}
Logstash 会给事件添加一些额外信息。最重要的就是 @timestamp,用来标记事件的发生时间。因为这个字段涉及到 Logstash 的内部流转,所以必须是一个 joda 对象,如果你尝试自己给一个字符串字段重命名为 @timestamp 的话,Logstash 会直接报错。所以,请使用 filters/date 插件 来管理这个特殊字段。
4. 配置
可以把把配置写到一个文件中,来启动Logstash。
- 在Logstash的配置文件目录中创建
test.yml文件
cd logstash-5.2.0/config/

vim test.yml
- 配置文件内容
input{

    stdin{}

}

ouput{

    stdout{

        codec=>rubydebug

    }

}
- 启动
sh logstash-5.2.0/bin/logstash -f logstash-5.2.0/config/test.yml
可以达步骤3的效果。
4. 使用ELK收集nginx的访问日志
1.配置Logstash
- 在Logstash的配置文件目录中创建
nginx-log.yml文件
cd logstash-5.2.0/config/

vim nginx-log.yml
- 配置文件内容
input {

  file {  # 指定一个文件作为输入源

    path => "/usr/local/nginx/logs/access.log"  # 指定文件的路径

    start_position => "beginning"  # 指定何时开始收集,这时设置从文件的最开头收集

    type => "nginx"  # 定义日志类型,可自定义

  }

}

filter {  # 配置过滤器

    grok {

        match => { "message" => "%{IPORHOST:http_host} %{IPORHOST:clientip} - %{USERNAME:remote_user} \[%{HTTPDATE:timestamp}\] \"(?:%{WORD:http_verb} %{NOTSPACE:http_request}(?: HTTP/%{NUMBER:http_version})?|%{DATA:raw_http_request})\" %{NUMBER:response} (?:%{NUMBER:bytes_read}|-) %{QS:referrer} %{QS:agent} %{QS:xforwardedfor} %{NUMBER:request_time:float}"}  # 定义日志的输出格式

    }

    geoip {

        source => "clientip"

    }

}

output {

	# 标准输出,是输出到终端

    stdout { codec => rubydebug }

    # 输出到es

    elasticsearch {

        hosts => ["127.0.0.1:19200"]

        index => "nginx-log-%{+YYYY.MM.dd}"

  }

}
- 检查配置文件
sh logstash --path.settings /etc/logstash/ -f logstash-5.2.0/config/nginx-log.yml --config.test_and_exit
2. 配置nginx的配置文件
- 打开nginx的配置文件
vim /usr/local/nginx/conf/nginx.conf
- 在http中增加如下内容
http {

    include       mime.types;

    default_type  application/octet-stream;

    #log_format  main  '$remote_addr - $remote_user [$time_local] "$request" '

    #                  '$status $body_bytes_sent "$http_referer" '

    #                  '"$http_user_agent" "$http_x_forwarded_for"';

    log_format main2 '$http_host $remote_addr - $remote_user [$time_local] "$request" '

                      '$status $body_bytes_sent "$http_referer" '

                      '"$http_user_agent" "$upstream_addr" $request_time';

}
- 在要格式化日志的 server中增加如下配置
 		#access_log  logs/host.access.log  main;

        # 增加如下内容, 日志格式化main2要在上面定义,不然这里无法引用

        access_log  logs/elk_access.log  main2;

        location / {

            root   html;

            index  index.html index.htm;

            # 增加如下三行内容,分别是携带访问host,远程地址和各层代理地址

            proxy_set_header Host   $host;

            proxy_set_header X-Real-IP      $remote_addr;

            proxy_set_header X-Forwarded-For $proxy_add_x_forwarded_for;

        }
- 重启nginx
sh /usr/local/nginx/sbin/nginx -s reload
3. 检查启动
- 检查
sh logstash-5.2.0/bin/logstash -f logstash-5.2.0/config/nginx-log.yml --config.test_and_exit
- 启动
sh logstash-5.2.0/bin/logstash -f logstash-5.2.0/config/nginx-log.yml
当终端输出如下内容就成功了
{

         "@timestamp" => 2018-12-18T08:44:56.361Z,

    "plugin_instance" => "vda",

               "read" => 467266,

             "plugin" => "disk",

               "host" => "172.24.121.18",

           "@version" => "1",

      "collectd_type" => "disk_ops",

               "type" => "collectd",

              "write" => 12204609

}

{

         "longterm" => 0.08,

       "@timestamp" => 2018-12-18T08:44:46.362Z,

           "plugin" => "load",

        "shortterm" => 0.06,

             "host" => "172.24.121.18",

         "@version" => "1",

    "collectd_type" => "load",

             "type" => "collectd",

          "midterm" => 0.04

}
5. Kibana展示nginx访问日志
进入Kibana页面如下
- 配置Index Patterns
- 进入后点击左上角的 ‘add new’ 进行创建索引模板
在Kibana中,要分析展示数据时,要先创建Index Patterns
选择index的时候可以用通配符 ‘*’ 来把所有的nginx-log的访问日志分成一个组。
Time-field name 是要指定一个日期格式的字段,以便于后面统计使用。
然后就可以在这里选择配置好的Index patterns了。
其中x轴的时间就是创建Index Patterns的时候选择的那个日期字段。
参考:
- http://blog.51cto.com/zero01/2082794
- https://doc.yonyoucloud.com/doc/logstash-best-practice-cn/input/stdin.html
ELk(Elasticsearch, Logstash, Kibana)的安装配置的更多相关文章
- 基于CentOS6.5或Ubuntu14.04下Suricata里搭配安装 ELK (elasticsearch, logstash, kibana)(图文详解)
前期博客 基于CentOS6.5下Suricata(一款高性能的网络IDS.IPS和网络安全监控引擎)的搭建(图文详解)(博主推荐) 基于Ubuntu14.04下Suricata(一款高性能的网络ID ...
- 使用ELK(Elasticsearch + Logstash + Kibana) 搭建日志集中分析平台实践--转载
原文地址:https://wsgzao.github.io/post/elk/ 另外可以参考:https://www.digitalocean.com/community/tutorials/how- ...
- CentOS 6.x ELK(Elasticsearch+Logstash+Kibana)
CentOS 6.x ELK(Elasticsearch+Logstash+Kibana) 前言 Elasticsearch + Logstash + Kibana(ELK)是一套开源的日志管理方案, ...
- 键盘侠Linux干货| ELK(Elasticsearch + Logstash + Kibana) 搭建教程
前言 Elasticsearch + Logstash + Kibana(ELK)是一套开源的日志管理方案,分析网站的访问情况时我们一般会借助 Google / 百度 / CNZZ 等方式嵌入 JS ...
- 【转】ELK(ElasticSearch, Logstash, Kibana)搭建实时日志分析平台
[转自]https://my.oschina.net/itblog/blog/547250 摘要: 前段时间研究的Log4j+Kafka中,有人建议把Kafka收集到的日志存放于ES(ElasticS ...
- ELK(ElasticSearch+Logstash+ Kibana)搭建实时日志分析平台
一.简介 ELK 由三部分组成elasticsearch.logstash.kibana,elasticsearch是一个近似实时的搜索平台,它让你以前所未有的速度处理大数据成为可能. Elastic ...
- 【Big Data - ELK】ELK(ElasticSearch, Logstash, Kibana)搭建实时日志分析平台
摘要: 前段时间研究的Log4j+Kafka中,有人建议把Kafka收集到的日志存放于ES(ElasticSearch,一款基于Apache Lucene的开源分布式搜索引擎)中便于查找和分析,在研究 ...
- ELK(elasticsearch+logstash+kibana)入门到熟练-从0开始搭建日志分析系统教程
#此文篇幅较长,涵盖了elk从搭建到运行的知识,看此文档,你需要会点linux,还要看得懂点正则表达式,还有一个聪明的大脑,如果你没有漏掉步骤的话,还搭建不起来elk,你来打我. ELK使用elast ...
- ELK (Elasticsearch , Logstash, Kibana [+FileBeat])
ELK 简述: ELK 是: Elasticsearch , Logstash, Kibana 简称, 它们都是开源软件. Elasticsearch[搜索]是个开源分布式基于Lucene的搜索引擎, ...
随机推荐
- mybatis框架(3)---SqlMapConfig.xml解析
SqlMapConfig.xml SqlMapConfig.xml是Mybatis的全局配置参数,关于他的具体用的有专门的MyBatis - API文档,这里面讲的非常清楚,所以我这里就挑几个讲下: ...
- mysql 开发进阶篇系列 4 SQL 优化(各种优化方法点)
1 通过handler_read 查看索引使用情况 如果索引经常被用到 那么handler_read_key的值将很高,这个值代表了一个行被索引值读的次数, 很低的值表明增加索引得到的性能改善不高,索 ...
- 新生命Redis组件(.Net Core 开源)
NewLife.Redis 是一个Redis客户端组件,以高性能处理大数据实时计算为目标.Redis协议基础实现Redis/RedisClient位于X组件,本库为扩展实现,主要增加列表结构.哈希结构 ...
- WebAssembly是解决JavaScript 痼疾的银弹?
写在前面 <没有银弹>是 Fred Brooks 在 1987 年所发表的一篇关于软件工程的经典论文.该论文的主要论点是,没有任何一项技术或方法可以能让软件工程的生产力在十年内提高十倍. ...
- Java网络编程的Java流介绍
前言 网络程序所做的很大一部分工作都是简单的输入输出:将数据字节从一个系统移动到另一个系统.Java的I/O建立于流(stream)之上.输入流读取数据,输出流写入数据.过滤器流(filter)流可以 ...
- 第5章 Linux上管理文件系统
5.1 机械硬盘 机械硬盘由多块盘片组成,它们都绕着主轴旋转.每块盘片上下方都有读写磁头悬浮在盘片上下方,它们与盘片的距离极小.在每次读写数据时盘片旋转,读写磁头被磁臂控制着不断的移动来读取其中的数据 ...
- QTimer 的使用
QTimer(重复和单发计时器) 应用 QTimer 时,先创建一个 QTimer 类,利用 connect 将 timeout() 与对应槽函数连接,在调用 start() 函数设置定时器时间间隔, ...
- Linux某些命令找不到/无法使用
1.zip/unzip: command not found yum list | grep zip/unzip yum install zip yum install unzip 2.rz -y/s ...
- 南大算法设计与分析课程复习笔记(2)L2 - Asymptotics
一.几种比较复杂度的符号 数据结构有描述,相关严格数学定义也不想说了,就这么过了吧. 二.最大子数组的几种解决方法 从最复杂的暴力解法过渡到最简单的动态规划 解析和代码见这里:http://www.c ...
- 5.QT-QString类
Qt中的字符串类 介绍 采用Unicode编码 采用隐式共享技术,节省内存和不必要的数据拷贝 隐式共享介于浅拷贝和深拷贝之间,当两个string对象赋值时,会实现浅拷贝(共享一块内存),如果某个对象 ...