A quike guide teaching you how to use matlab to read netCDF file and plot a figure
2. A brief introduce to netCDF. 4
4.1 Get data from netCDF file. 12
4.2 Get subset data of specified variable. 13
Example 1: get the time series of a specified point (lon(11),lat(10))13
Example 2: get data of every point at time(0)14
1. Preparation
Software: Matlab 2014a;
Used netCDF File: example.nc(containd in Matlab Install files), pres.tropp.2015.nc.
Instruction/Reference:
1. Matlab help documention
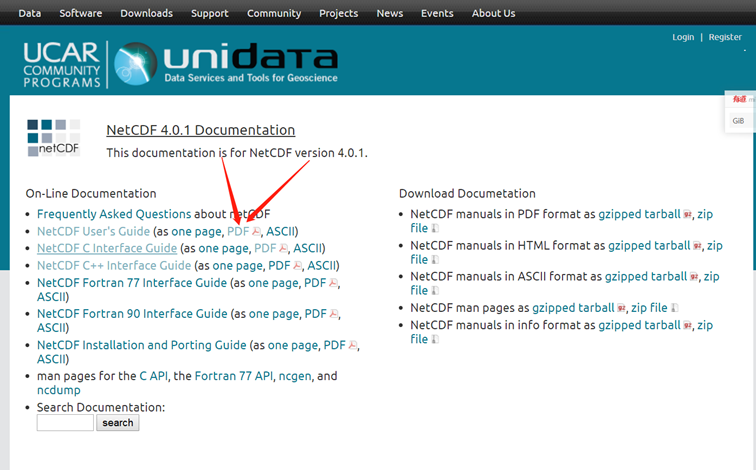
2. NetCDF User's Guide
https://www.unidata.ucar.edu/software/netcdf/old_docs/docs_4_0_1/
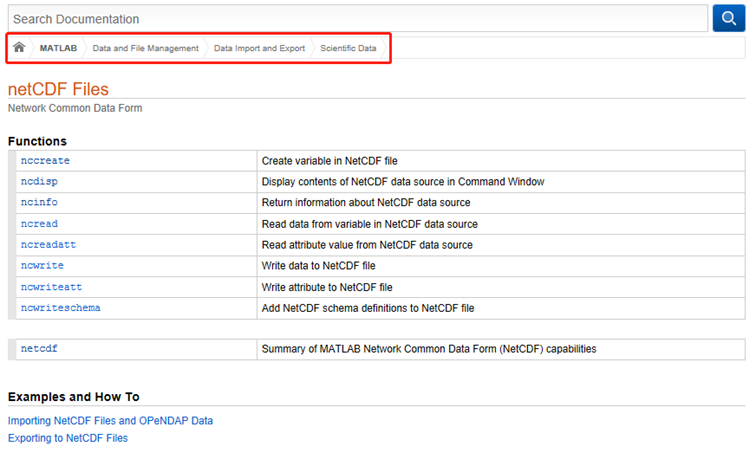
3. NetCDF Documentation
https://www.unidata.ucar.edu/software/netcdf/docs/index.html
2. A brief introduce to netCDF
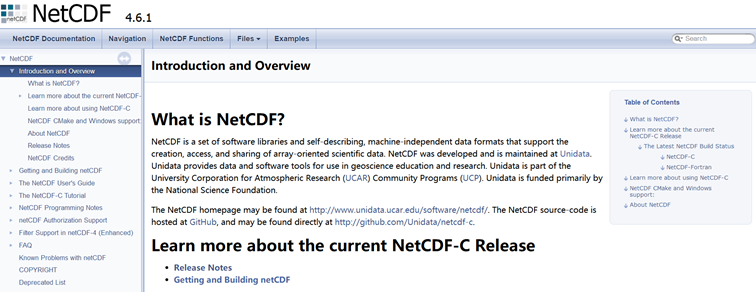
NetCDF is a set of software libraries and self-describing, machine-independent data formats that support the creation, access, and sharing of array-oriented scientific data. NetCDF was developed and is maintained at Unidata. Unidata provides data and software tools for use in geoscience education and research.
|
Format |
Model |
Version |
Released Year |
|
Classic format |
classic model |
1.0~3.5 |
1989~2000 |
|
64-bit offset format |
3.6 |
2004 |
|
|
netCDF-4 classic model format |
|||
|
enhanced model (netCDF-4 data model) |
4.0 |
2008 |
|
|
netCDF-4 format |
l data represented with the classic model can also be represented using the enhanced model;
l datasets that use features of the enhanced model, such as user-defined nested data types, cannot be represented with the classic model;
l Evolution will continue the commitment to keep the Backwards Compatibility;
n Backwards means the “previous” and Forwards means the “future”;
l Knowledge of format details is not required to read or write netCDF datasets, unless you want to understand the performance issues related to disk or server access.
l The netCDF reference library, developed and supported by Unidata, is written in C,with Fortran77, Fortran90, and C++ interfaces. A number of community and commercially supported interfaces to other languages are also available, including IDL, Matlab, Perl,Python, and Ruby. An independent implementation, also developed and supported by Unidata, is written entirely in Java.
3. Data Structure
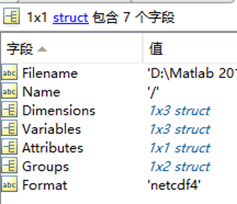
By use of the “ncinfo” we can get the structure information of the data source. This information is store in the Workspace. You can also use “ncdisp” to display the contents of the netCDF file in the Command Window.
|
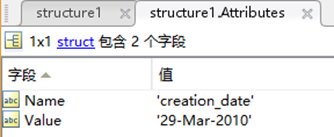
structure1 = ncinfo('example.nc'); |
structure2 = ncinfo('pres.tropp.2015.nc'); |
 |
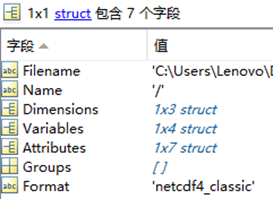 |
If we sort the data, we can get:
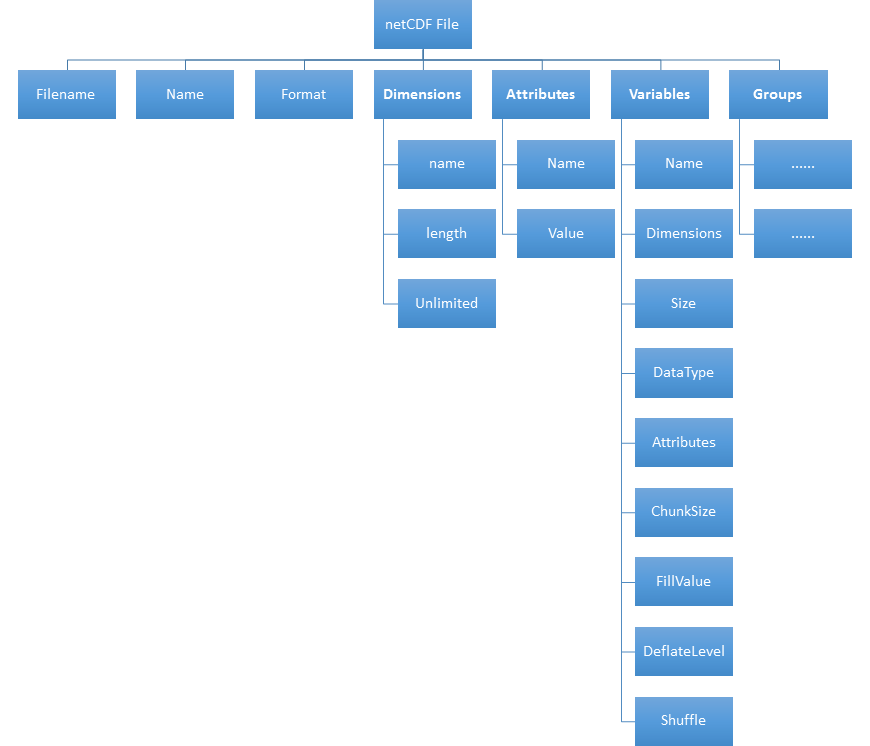
l Filename: netCDF file name or URL.
l Name: “/” indicating the full file
l Format: the format of the netCDF file, see section 2.
l Groups: An empty array([]) for all netCDF file format except netCDF-4 format.
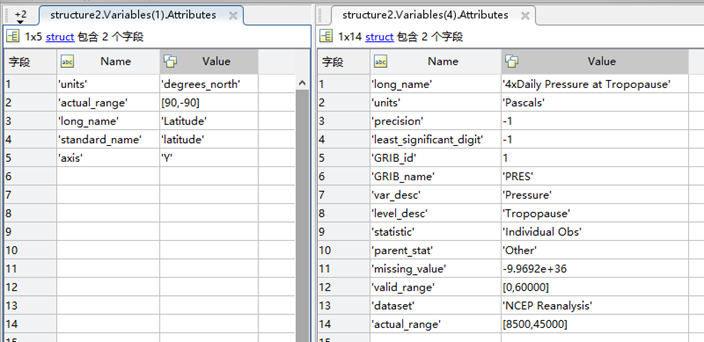
3.1 Attributes
概述:File有attributes,variable有attributes;就近原则,描述自己。
NetCDF attributes are used to store data about the data (ancillary data or metadata(元数据,描述数据的数据)), we can call them Global Attributes.
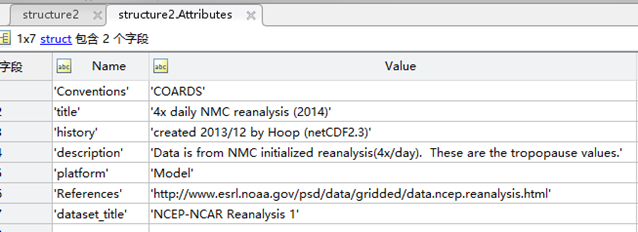
Most attributes provide information about a specific variable. These are identified by the name (or ID) of that variable, together with the name of the attribute.
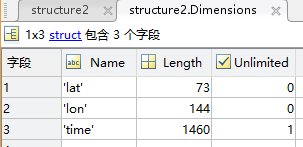
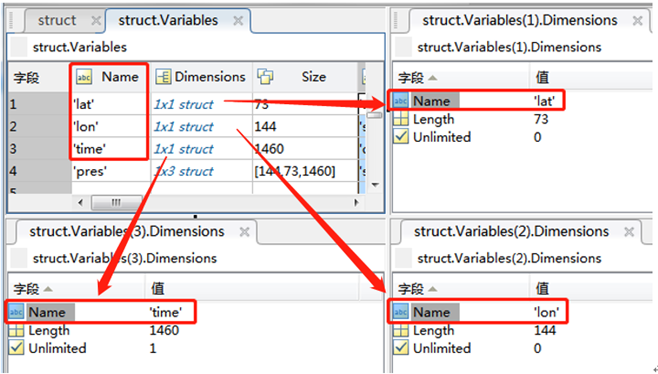
3.2 Dimensions
A dimension may be used to represent a real physical dimension, for example, time, latitude, longitude, or height. A dimension might also be used to index other quantities, for example station or People.
l Name: the name of the dimension;
l Length: number(sample) of values;
l Unlimited: Boolean value. Indicates whether this dimension’s length is limited.
In a classic or 64-bit offset format dataset you can have at most one UNLIMITED dimension;
In a netCDF-4 format dataset, multiple UNLIMITED dimensions can be used.
3.3 Variables
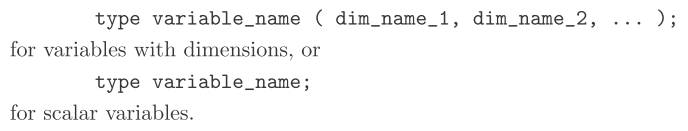
When a variable is defined, its shape is specified as a list of dimensions. These dimensions must already exist.
A scalar has no dimension, a vector has one dimension and a matrix has 2 dimensions.
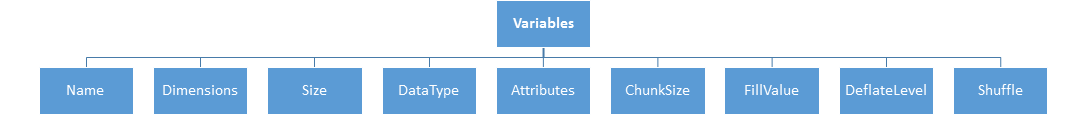
l Dimensions: the same as “independent variables”.
l Size: Like the matlab function “size” if the variable is matrix, like the matlab function “length” if the variable is verctor or scalar.
l Attributes: see section 3.1
l ChunkSize: specifying the size of one chunk. If the storage type specified is CONTIGUOUS it is “[]”.
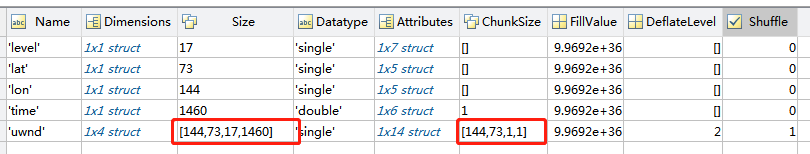
l Fillvalue:Specifies the value to the variable when no other value is specified and use of fill values has been enabled.
最后这两个参数和数据的压缩有关,若数据是压缩过的,则需要解压后才能够读取。不过这些都是由底层的APIs(interface)实现的,我们可以不用管它。
l DeflateLevel:Scalar value between 0 and 9 specifying the amount of compression, where 0 is no compression and 9 is the most compression
l Shuffle:Boolean value. True indicates the shuffle filter is enabled for this variable. The shuffle filter can assist with the compression of integer data by changing the byte order in the data stream.
Classfication
Class One: Coordinate variables
l A variable with the same name as a dimension.
l It typically defines a physical coordinate corresponding to that dimension.
n So that you have alternative means of specifying position along the variable.
|
Index (C convention) |
0 |
1 |
2 |
3 |
4 |
… |
|
Index (Fortran convention) |
1 |
2 |
3 |
4 |
5 |
… |
|
physical coordinate (lat,lon,time etc.) |
0 |
2.5 |
5 |
7.5 |
10 |
… |
n Matlab netCDF functions adopt C convention such that the counting starts from zero. Diagram below illustrates the actual index that we should use to extract the data using the Matlab functions.
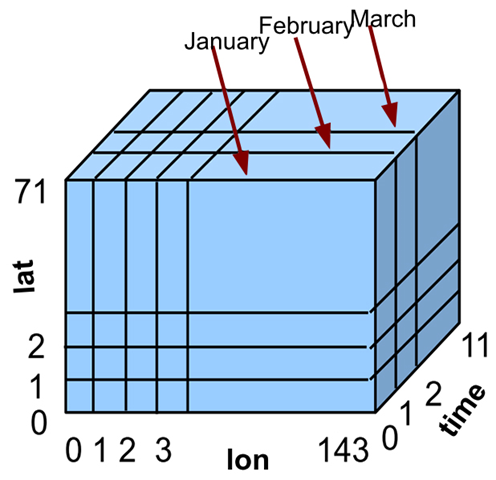
http://www.public.asu.edu/~hhuang38/matlab_netcdf_guide.pdf
Class Two: Primary variables
l This class can also be devied into two class:the Record variables and the others(just call it Fixed variables here)
l Record variables: these variables has the unlimited dimension(like time), their size is variable.
l Fixed variables: have a fixed size (number of data values) given by the product(叉乘、笛卡尔积) of its dimension lengths.
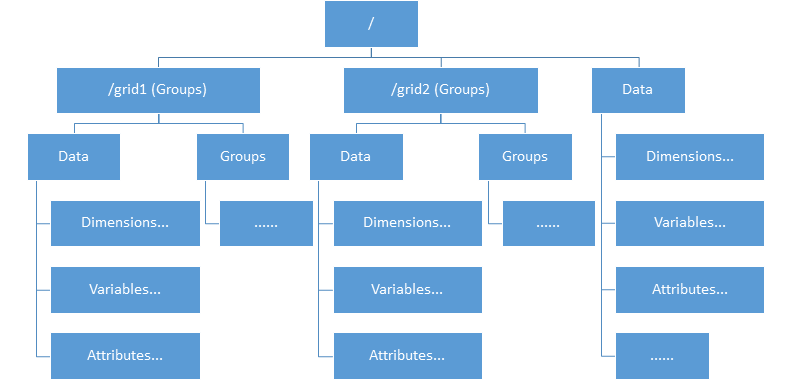
3.4 Groups
l Starting with version 4.0, groups can help organize data within a dataset.
l It’s not a type of data. Like a directory structure on a Unix file-system, the grouping feature allows users to organize variables and dimensions into distinct, named, hierarchical areas, called groups.
l Here we use the file “example.nc” to demonstrate the groups’ structure
4. Source Code
After get know the file structure, we can extract the data of specific “variables”. Here illustrate the step of process.
Step 0: use function “ncinfo” or “ncdisp” to check the structure and information of the netCDF file; (this step is unnecessary if you have got known with the data.)
Step 1: Open the file;
Step 2: Extract data from specific “variables”;
Step 3: close the file;
4.1 Get data from netCDF file
% get information/structure data
struct = ncinfo('pres.tropp.2015.nc');
% open the file(pres.tropp.2015.nc) by Read-only access(NC_NOWRITE)
% ncid is a NetCDF file identifier
ncid = netcdf.open('pres.tropp.2015.nc','NC_NOWRITE');
% get variable ID(varid) by given its name(pres)
varid = netcdf.inqVarID(ncid,'pres');
% get data(pres_data) by specifying the variable ID(varid)
pres_data = netcdf.getVar(ncid,varid);
% clos the file
netcdf.close(ncid);
% clear defunct parameters, leave alone the data(pres_data)
clear ncidvarid
4.2 Get subset data of specified variable
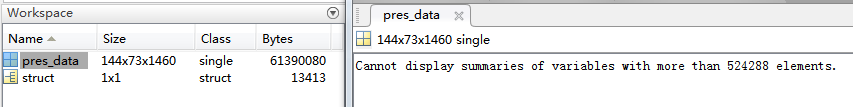
The size of the “pres_data” matrix is 144×73×1460, what if I want to get the sub-matrix of “pres_data”?
Example 1: get the time series of a specified point (lon(11),lat(10))
ncid = netcdf.open('pres.tropp.2015.nc','NC_NOWRITE');
varid = netcdf.inqVarID(ncid,'pres');
series_data = netcdf.getVar(ncid,varid,[10,9,0],[1,1,1460]);
% "[10,9,0]" represent the start point (Again, remember that counting starts from zero.)
% "[1,1,1460]" specifies the amount of the data in each dimension.
% plot the data
% plot(series_data(:));
netcdf.close(ncid);
clear ncidvarid
series_data is still a 3-dimention matrix, and the first two dimentions’ length is 1. The relation between “series_data” and “pres_data” is below:
series_data(1,1,i) = pres_data(11,10,i),i=1,2,…,1460.
Example 2: get data of every point at time(0)
ncid = netcdf.open('pres.tropp.2015.nc','NC_NOWRITE');
varid = netcdf.inqVarID(ncid,'pres');
map_data = netcdf.getVar(ncid,varid,[0,0,0],[144,73,1]);
netcdf.close(ncid);
clear ncidvarid
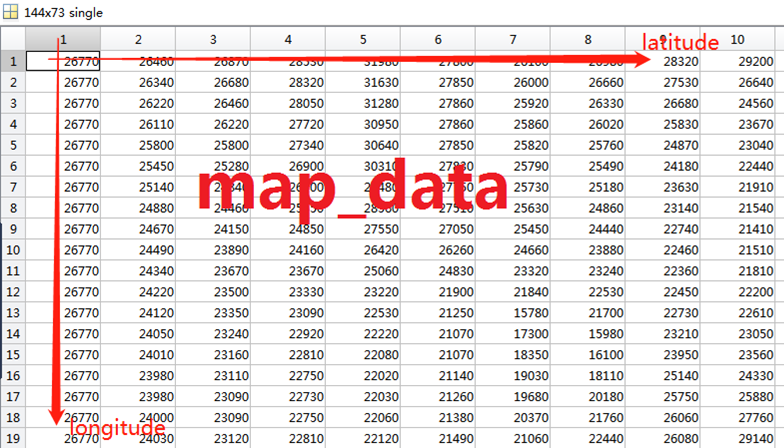
map_data is a 2-dimention matrix. The relation between “map_data” and “pres_data” is below:
map_data(i,j) = pres_data(i,j,1),i=1,2,…,144;j=1,2,…,73
4.3 Plot a figure
% open the file
ncid = netcdf.open('pres.tropp.2015.nc','NC_NOWRITE');
% get data
map_data = netcdf.getVar(ncid,netcdf.inqVarID(ncid,'pres'),[0,0,0],[144,73,1]);
longitude = netcdf.getVar(ncid,netcdf.inqVarID(ncid,'lon'));
latitude = netcdf.getVar(ncid,netcdf.inqVarID(ncid,'lat'));
% Time = netcdf.getVar(ncid,netcdf.inqVarID(ncid,'time'));
% clos the file
netcdf.close(ncid);
% plot the data
map_data = map_data'; % map_data must be transposed(see below for details)
[x,y]=meshgrid(longitude,latitude);
pcolor(x,y,map_data);
colorbar('location','eastoutside');
shading interp;colormap parula
% clear defunct parameters
clear ncidxy
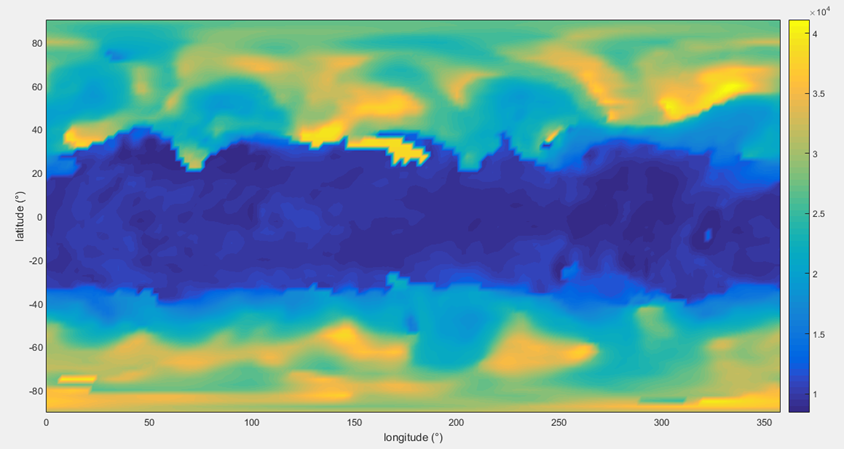
l Be careful when you plot the figure, the 1st dimension of the “map_data” is longitude, same as row of the matrix.
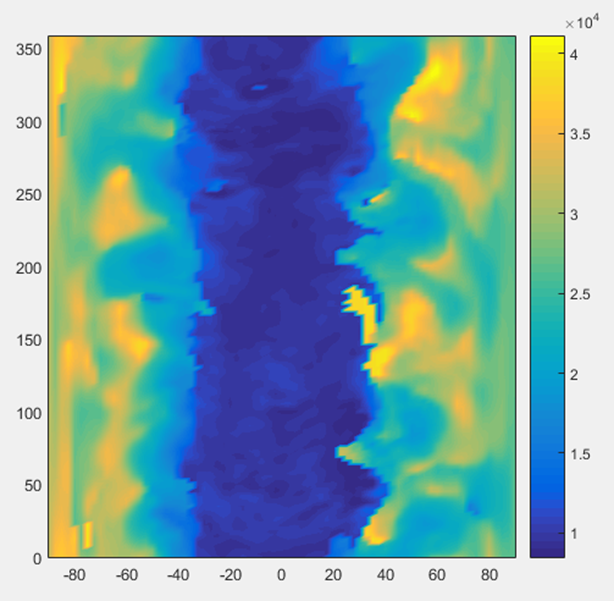
l The y-axis of the figure will be “longitude” if “map_dat” is not transposed.
A quike guide teaching you how to use matlab to read netCDF file and plot a figure的更多相关文章
- ZooKeeper Getting Started Guide
http://zookeeper.apache.org/doc/trunk/zookeeperStarted.html What is ZooKeeper? ZooKeeper is a centra ...
- [C3] Andrew Ng - Neural Networks and Deep Learning
About this Course If you want to break into cutting-edge AI, this course will help you do so. Deep l ...
- GO语言的开源库
Indexes and search engines These sites provide indexes and search engines for Go packages: godoc.org ...
- Android Lint Checks
Android Lint Checks Here are the current list of checks that lint performs as of Android Studio 2.3 ...
- Matlab编程基础
平台:Win7 64 bit,Matlab R2014a(8.3) “Matlab”是“Matrix Laboratory” 的缩写,中文“矩阵实验室”,是强大的数学工具.本文侧重于Matlab的编程 ...
- LaTeX插入图片方法 Inserting Images
Inserting Images Images are essential elements in most of the scientific documents. LATEX provides s ...
- Machine Learning for hackers读书笔记(四)排序:智能收件箱
#数据集来源http://spamassassin.apache.org/publiccorpus/ #加载数据 library(tm)library(ggplot2)data.path<-'F ...
- 对于fmri的设计矩阵构造的一个很直观的解释-by 西南大学xulei教授
本程序意在解释这样几个问题:完整版代码在本文的最后. 1.实验的设计如何转换成设计矩阵? 2.设计矩阵的每列表示一个刺激条件,如何确定它们? 3.如何根据设计矩阵和每个体素的信号求得该体素对刺激的敏感 ...
- Go语言(golang)开源项目大全
转http://www.open-open.com/lib/view/open1396063913278.html内容目录Astronomy构建工具缓存云计算命令行选项解析器命令行工具压缩配置文件解析 ...
随机推荐
- Django 框架介绍
Django 框架介绍 MVC框架和MTV框架 简单了解一下什么是MVC框架.MVC(Model View Controller),是模型(model)-视图(view)-控制器(controller ...
- 哪些异常是RuntimeException?Sql异常属于RuntimeException吗?Spring下SQL异常事务回滚
一,为什么框架中根本没有对Exception的一般子类进行回滚配置,异常发生时,事务都进行了回滚 ,说好的只会对RuntimeException(Unchecked 非受检异常)回滚呢? 此时,我们就 ...
- Git撤销commit消息保留修改
有时候commit后发现commit信息错了或者是添加了不想commit的内容,但还没有push到远程仓库 这个时候 git reset --soft [commit_id] 就可以回滚到某一个com ...
- linux centos-7.2-64bit 安装配置启动nginx
1.安装依赖包yum -y install openssl openssl-develyum install pcre*yum install openssl*yum install zlib yum ...
- hdu-2639 Bone Collector II---第k大背包
题目链接: http://acm.hdu.edu.cn/showproblem.php?pid=2639 题目大意: 求第k大背包. 思路: 由01背包递推式dp[i][j] = max(dp[i][ ...
- CNN中减少网络的参数的三个思想
CNN中减少网络的参数的三个思想: 1) 局部连接(Local Connectivity) 2) 权值共享(Shared Weights) 3) 池化(Pooling) 局部连接 局部连接是相对于全连 ...
- ECSHOP3.6版 钻石小鸟模板修改教程
ecshop3.6版 钻石小鸟 模板修改明细 (1) 钻石小鸟 首页轮播图修改 (2)首页布局设置 (修改前建议先备份下数据库. 后台/数据备份) (3)修改模板头部内容. 如下图. 后台,模板设置 ...
- 1025InnoDB log file 设置多大合适
转自 http://blog.csdn.net/langkeziju/article/details/51094289 数据库的东西,往往一个参数就牵涉N多知识点.所以简单的说一下.大家都知道inno ...
- TP-LINK | TL-WR842N设置无线转有线
首先点击右上角的"高级设置". 点击左侧的"无线设置"栏,点击"WDS无线桥接",然后一步步设置可以使路由器连接到当前的一个无线网络. 然后 ...
- [LeetCode] Employee Importance 员工重要度
You are given a data structure of employee information, which includes the employee's unique id, his ...