Matlab 曲线绘制之线型和颜色 示例
估计很多人会碰到,当绘制的曲线特别多的时候,需要用不同的颜色和线型区分开这些曲线。根据STC论文,自己整理了一个颜色和线型的例子,供大家直接使用,直接引用PlotStyle这个数据结构就可以了。
示例1
PlotStyle={
struct('Color',[1,0,0],'LineStyle','-'),...
struct('Color',[0,1,0],'LineStyle','-'),...
struct('Color',[0,0,1],'LineStyle','-'),...
struct('Color',[0,0,0],'LineStyle','-'),...% struct('Color',[1,1,0],'LineStyle','-'),...%yellow
struct('Color',[1,0,1],'LineStyle','-'),...%pink
struct('Color',[0,1,1],'LineStyle','-'),...
struct('Color',[0.5,0.5,0.5],'LineStyle','-'),...%gray-25%
struct('Color',[136,0,21]/255,'LineStyle','-'),...%dark red
struct('Color',[255,127,39]/255,'LineStyle','-'),...%orange
struct('Color',[0,162,232]/255,'LineStyle','-'),...%Turquoise
struct('Color',[163,73,164]/255,'LineStyle','-'),...%purple %%%%%%%%%%%%%%%%%%%%
struct('Color',[1,0,0],'LineStyle','--'),...
struct('Color',[0,1,0],'LineStyle','--'),...
struct('Color',[0,0,1],'LineStyle','--'),...
struct('Color',[0,0,0],'LineStyle','--'),...% struct('Color',[1,1,0],'LineStyle','--'),...%yellow
struct('Color',[1,0,1],'LineStyle','--'),...%pink
struct('Color',[0,1,1],'LineStyle','--'),...
struct('Color',[0.5,0.5,0.5],'LineStyle','--'),...%gray-25%
struct('Color',[136,0,21]/255,'LineStyle','--'),...%dark red
struct('Color',[255,127,39]/255,'LineStyle','--'),...%orange
struct('Color',[0,162,232]/255,'LineStyle','--'),...%Turquoise
struct('Color',[163,73,164]/255,'LineStyle','--'),...%purple %%%%%%%%%%%%%%%%%%%
struct('Color',[1,0,0],'LineStyle','-.'),...
struct('Color',[0,1,0],'LineStyle','-.'),...
struct('Color',[0,0,1],'LineStyle','-.'),...
struct('Color',[0,0,0],'LineStyle','-.'),...% struct('Color',[1,1,0],'LineStyle',':'),...%yellow
struct('Color',[1,0,1],'LineStyle','-.'),...%pink
struct('Color',[0,1,1],'LineStyle','-.'),...
struct('Color',[0.5,0.5,0.5],'LineStyle','-.'),...%gray-25%
struct('Color',[136,0,21]/255,'LineStyle','-.'),...%dark red
struct('Color',[255,127,39]/255,'LineStyle','-.'),...%orange
struct('Color',[0,162,232]/255,'LineStyle','-.'),...%Turquoise
struct('Color',[163,73,164]/255,'LineStyle','-.'),...%purple
};
x = 0.1:.1:10;
len = length(PlotStyle)
for i = 1:len
y = x.*log(x)+i*2;
hold on;
plot(x,y,'Color',PlotStyle{1,i}.Color,'LineStyle',PlotStyle{1,i}.LineStyle,'lineWidth', 2);%call method
end
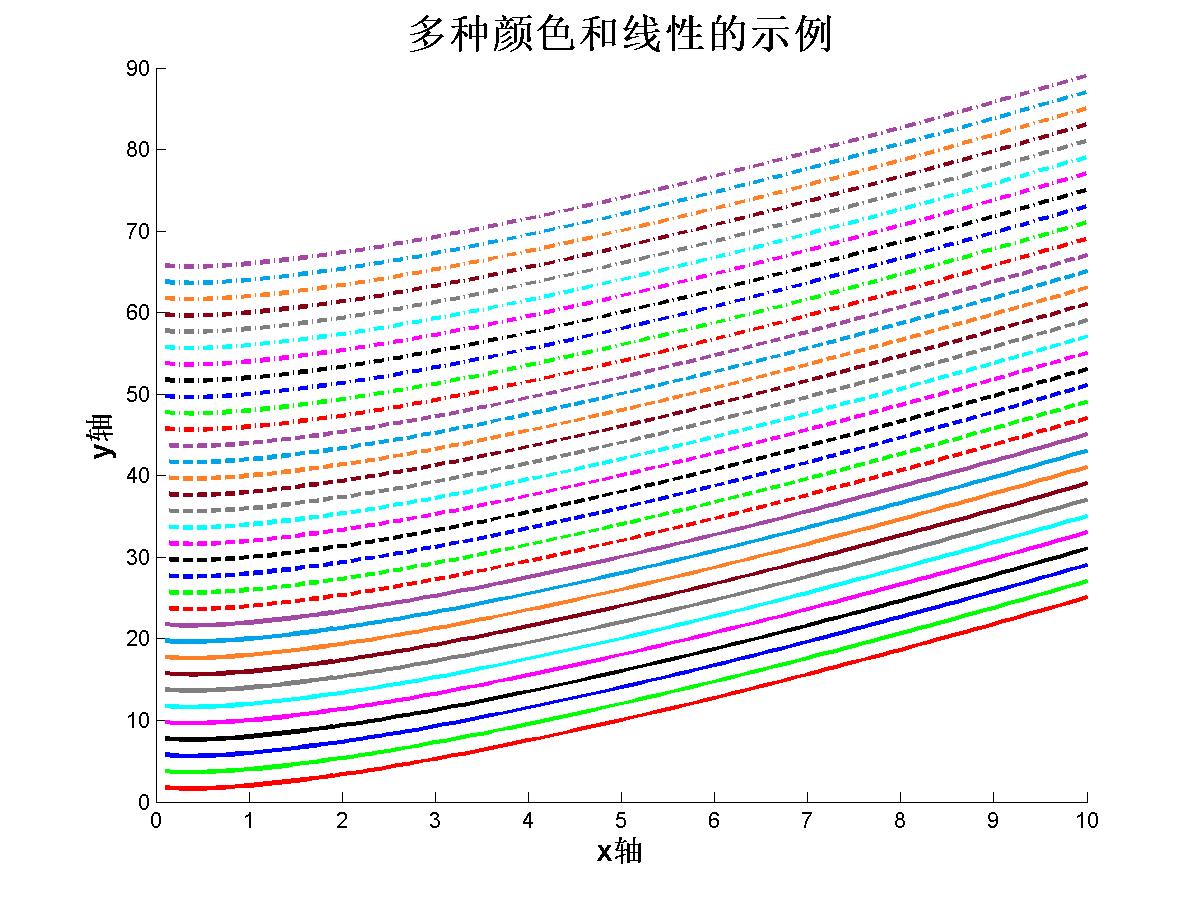
title('多种颜色和线性的示例','FontSize',20,'FontWeight','bold','Color','k');
xlabel('x轴','FontSize',15,'FontWeight','bold','Color','k');
ylabel('y轴','FontSize',15,'FontWeight','bold','Color','k');
saveas(1, 'result', 'jpg');
效果如下图所示:
示例2
PlotStyle={

    struct('Color',[,,]/,'LineStyle','-'),...

    struct('Color',[,,]/,'LineStyle','--'),...

    struct('Color',[,,]/,'LineStyle','-.'),...

    struct('Color',[,,]/,'LineStyle',':'),...%    struct('Color',[,,],'LineStyle','-'),...%yellow

    struct('Color',[,,]/,'LineStyle','-')

  };

x = :.:;

len = length(PlotStyle)

for i = :len

%    y = x.*log(x)+i*;

   y = x.*sin(x)+i*;

   hold on;

   plot(x,y,'Color',PlotStyle{,i}.Color,'LineStyle',PlotStyle{,i}.LineStyle,'lineWidth', );

end

title('多种颜色和线性的示例','FontSize',,'FontWeight','bold','Color','k');

xlabel('x轴','FontSize',,'FontWeight','bold','Color','k');

ylabel('y轴','FontSize',,'FontWeight','bold','Color','k');

saveas(, 'result2', 'jpg');
效果如下图所示:

示例3
clc;
close all;
%%数据生成
ya = [];
yb = [];
yc = [];
xa = [];
xb = [];
xc = [];
for i = :
value0 = i*+rand();
valuea = i*+rand();
xa = [xa value0];
ya = [ya *valuea.^(0.6)];
valueb = i*+rand();
xb = [xb valueb];
yb = [yb *valuea.^(0.7)];
valuec = i*+rand();
xc = [xc valuec];
yc = [yc *valuea.^(0.5)];
end
xa = xa - min(xa);
ya = ya - min(ya);
xb = xb - min(xb);
yb = yb - min(yb);
xc = xc - min(xc);
yc = yc - min(yc);
figure();
hold on;
axis equal %强制坐标轴尺度相同,这个放在前面或者后面效果会不一样
xlim([ ]);%x轴范围
ylim([ ]);%y轴范围 %%绘制曲线
plot(xa,ya,'ms:','LineWidth',,'MarkerSize',,'Color', [ ]);
x = xa(end);y = ya(end);
text(x-0.5,y+0.5,['(x_n,y_n)'],...
'FontSize',, 'Color',[0.0 0.0 0.0], 'FontWeight','bold');
plot(xb(:end-),yb(:end-),'ro:','LineWidth',,'MarkerSize',,'Color', [ ]);
x = xb(end-);y = yb(end-);
text(x-0.5,y+0.5,['(x_m,y_m)'],...
'FontSize',, 'Color',[0.0 0.0 0.0], 'FontWeight','bold');
plot(xc(:end-),yc(:end-),'r<:','LineWidth',,'MarkerSize',,'Color', [ ]);
x = xc(end-);y = yc(end-);
text(x-0.5,y+0.5,['(x_k,y_k)'],...
'FontSize',, 'Color',[0.0 0.0 0.0], 'FontWeight','bold'); %坐标原点
x = xc();y = yc();
text(x+0.5,y+0.5,['(x_0,y_0)'],...
'FontSize',, 'Color',[0.0 0.0 0.0], 'FontWeight','bold');
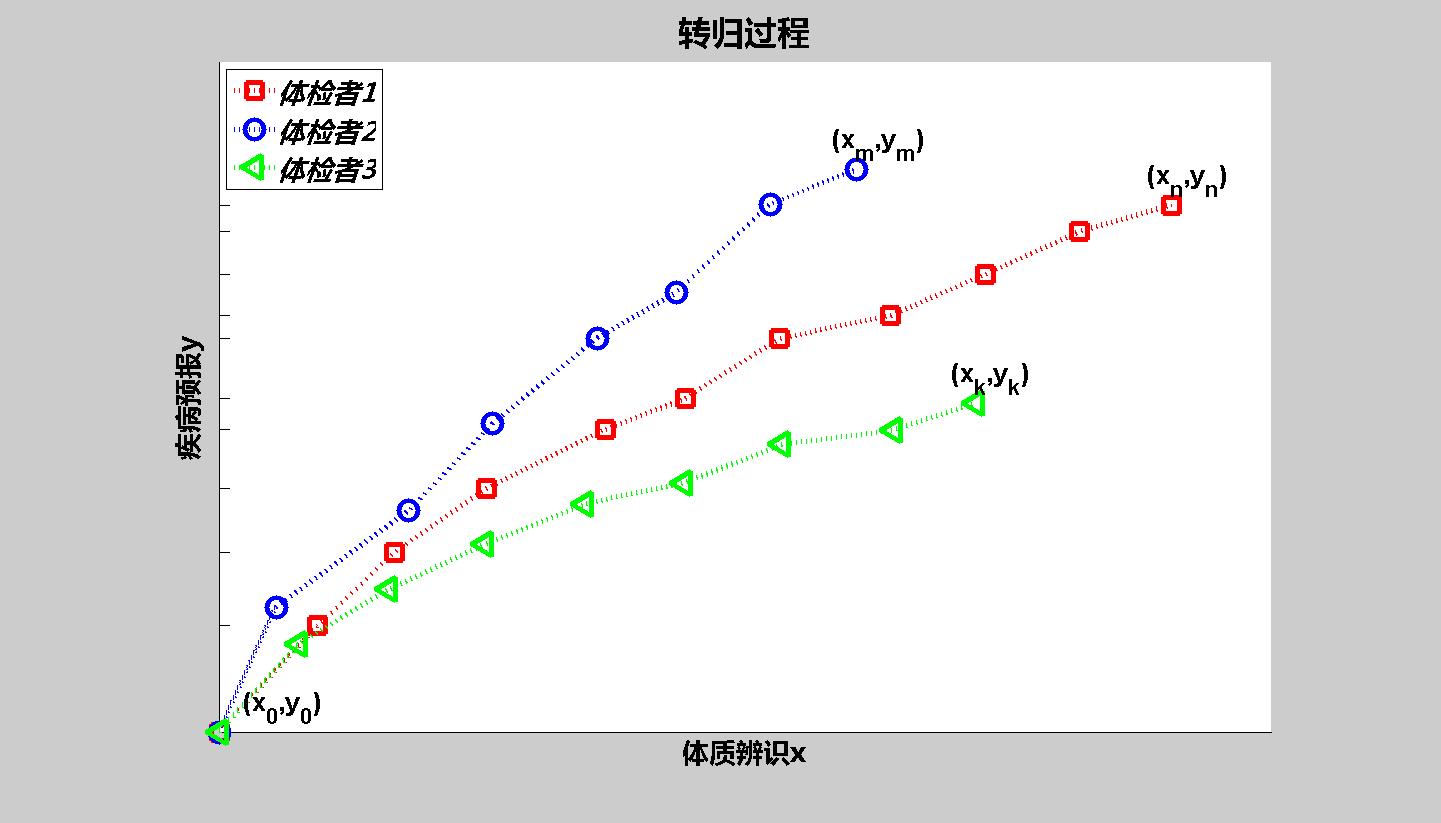
title('转归过程','FontSize',,'FontWeight','bold','FontName','微软雅黑'); %%坐标轴标题设置
xlabel('体质辨识x','Color','k','FontSize',,'FontWeight','bold','FontName','微软雅黑');%横轴标题
ylabel('疾病预报y','Color','k','FontSize',,'FontWeight','bold','FontName','微软雅黑');%纵轴标题 %设置legend
hleg = legend('体检者1','体检者2','体检者3','Location','NorthWest');%本身不能设置字体的大小,需要通过set进行设置
set(hleg,'FontSize', , 'FontAngle','italic','FontWeight','bold',...
'Color',[,,]);%Color为设置坐标的背景颜色 %%坐标轴刻度设置
set(gca, 'ytick',ya,'yticklabel',{' ',' ',' ',' ',' ',' ','','','',''},'xtick',x,...
'xticklabel',{'','','','','','','','','',''}, 'color',[ ],...
'FontSize',,'FontName','微软雅黑'); %xtick就是你要在哪些地方显示刻度,xticklabel就是显示什么内容 scrsz = get(,'ScreenSize');
set(gcf,'Position',scrsz); %%保存图像
set(, 'InvertHardCopy', 'off');%设置的背景色有效,如果为on则图形不保存背景色,maltab 默认为 on
filename = 'test';
saveas(,filename,'jpeg');
效果如下图所示:
Matlab 曲线绘制之线型和颜色 示例的更多相关文章
- [转帖]MATLAB曲线绘制及颜色类型
信号源产生的方法 来源:http://www.2cto.com/kf/201401/270494.html matlab的checkerboard说明,GOOD! 来源:http://www.chi ...
- MATLAB曲线绘制
一. 二维数据曲线图1.1 绘制 单根二维曲线plot 函数的基本调用 格式为:plot(x,y) 其中x和y为长度相同的向量,分别用于存储x坐标 和y坐标数据. 例1-1 在0≤x≤2p区间内,绘制 ...
- MATLAB 曲线形状,粗细,颜色使用大全
通过改变R-G-B 的值改变线条的颜色: $$\tt\Large plot(x,y,'Color',[R~~G~~B]);$$ 通过改变$c\in[1,+\infty)$的值改变线条的粗细 $$\tt ...
- matlab 画图中线型及颜色设置
matlab受到控制界广泛接受的一个重要原因是因为它提供了方便的绘图 功能.本章主要介绍2维图形对象的生成函数及图形控制函数的使用方 法,还将 简单地介绍一些图形的修饰与标注函数及操作和控制MATLA ...
- Matlab 如何绘制复杂曲线的包络线
Matlab 如何绘制复杂曲线的包络线 http://jingyan.baidu.com/article/aa6a2c14d36c710d4c19c4a8.html 如果一条曲线(比如声音波形)波动很 ...
- Matlab图形绘制
图形绘制 离散函数图形: 例:离散数据和离散函数可视化(离散数据作图方式) X1=[,,,,,,,,,,,,,,,,,,,]; Y1=[,,,,,,,,,,,,,,,,,,,]; figure() p ...
- ROC曲线绘制
ROC 曲线绘制 个人的浅显理解:1.ROC曲线必须是针对连续值输入的,通过选定不同的阈值而得到光滑而且连续的ROC曲线,故通常应用于Saliency算法评价中,因为可以选定0~255中任意的值进行阈 ...
- MATLAB中提供的线型属性
MATLAB中提供的线型属性有: 线型 说明 标记符 说明 颜色 说明 - 实线(默认) + 加号符 r 红色 -- 双划线 o 空心圆 g 绿色 : 虚线 * 星号 b 蓝色 :. 点划线 . 实心 ...
- C# 曲线控件 曲线绘制 实时曲线 多曲线控件 开发
Prepare 本文将使用一个NuGet公开的组件来实现曲线的显示,包含了多种显示的模式和配置来满足各种不同的应用场景,方便大家进行快速的开发系统. 在Visual Studio 中的NuGet管理器 ...
随机推荐
- webpack中的静态资源处理
你可能已经注意到,在我们的项目结构里,有两个静态文件的路径,分别是:src/assets 和 static/.那这两个到底有什么区别呢? Webpacked 资源 为了回答这个问题,我们首先需要理解w ...
- 10 - 函数嵌套-作用域-闭包-LEGB-函数销毁
目录 1 函数嵌套 2 作用域 2.1 global关键字 3 闭包 3.1 nonlocal关键字 4 默认值的作用域 5 变量名解析原则LEGB 6 函数的销毁 1 函数嵌套 一个 ...
- 让R与Python共舞
转载:http://ices01.sinaapp.com/?p=129 R(又称R语言)是一款开源的跨平台的数值统计和数值图形化展现 工具.通俗点说,R是用来做统计和画图的.R拥有自己的脚本 ...
- GUC-4 CopyOnWriteArrayList/CopyOnWriteArraySet
/* * CopyOnWriteArrayList/CopyOnWriteArraySet : “写入并复制” * 注意:添加操作多时,效率低,因为每次添加时都会进行复制,开销非常的大.并发迭代操作多 ...
- office 文档转pdf
本地先安装 金山wps,并确保可用 工程目录 1.使用前,先执行install.bat 安装jacob 到maven本地仓库 2.复制 jacob-1.18-M2-x64.dlljacob-1.18- ...
- [BZOJ4942][Noi2017]整数 线段树+压位
用线段树来模拟加减法过程,维护连续一段中是否全为0/1. 因为数字很大,我们60位压一位来处理. #include<iostream> #include<cstring> #i ...
- jsonp原生js跨域拿新浪数据插件封装【可扩展】
//修改了一个bug,增加了手动释放垃圾 <!DOCTYPE html> <html lang="en"> <head> <meta ch ...
- oracle chr(38) 和 ascii('&') 函数
oracle chr(38) 和 ascii('&') 函数 select chr(38) from dual; select ascii('&') from dual;
- java.lang.ClassCastException: android.widget.ImageButton异常处理
在调程序时总是出现异常关闭的现象,log显示: 03-26 07:58:09.528: E/AndroidRuntime(398): Caused by: java.lang.ClassCastExc ...
- 【转】VueJS中学习使用Vuex详解
转自:https://segmentfault.com/a/1190000015782272 在SPA单页面组件的开发中 Vue的vuex和React的Redux 都统称为同一状态管理,个人的理解 ...