
Decision Boundaries for Deep Learning and other Machine Learning classifiers
Decision Boundaries for Deep Learning and other Machine Learning classifiers
H2O, one of the leading deep learning framework in python, is now available in R. We will show how to get started with H2O, its working, plotting of decision boundaries and finally lessons learned during this series.
By Takashi J. OZAKI, Ph. D.
For a while (at least several months since many people began to implement it with Python and/or Theano, PyLearn2 or something like that), nearly I’ve given up practicing Deep Learning with R and I’ve felt I was left alone much further away from advanced technology…
But now we have a great masterpiece: {h2o}, an implementation of H2O framework in R. I believe {h2o} is the easiest way of applying Deep Learning technique to our own datasets because we don’t have to even write any code scripts but only to specify some of its parameters. That is, using {h2o} we are free from complicated codes; we can only focus on its underlying essences and theories.
With using {h2o} on R, in principle we can implement “Deep Belief Net”, that is the original version of Deep Learning*1. I know it’s already not the state-of-the-art style of Deep Learning, but it must be helpful for understanding how Deep Learning works on actual datasets. Please remember a previous post of this blog that argues about how decision boundaries tell us how each classifier works in terms of overfitting or generalization, if you already read this blog. :)
It’s much simple how to tell which overfits or well gets generalized with the given dataset generated by 4 sets of fixed 2D normal distribution. My points are: 1) if decision boundaries look well smoothed, they’re well generalized, 2) if they look too complicated, they’re overfitting, because underlying true distributions can be clearly divided into 4 quadrants with 2 perpendicular axes.
OK, let’s run the same trial with Deep Learning of {h2o} on R in order to see how DL works on the given dataset.
Datasets
Please get 3 datasets from my repository on GitHub:
simple XOR pattern, complex XOR pattern, and a grid dataset.
Github Repo for the current post. Of course, feel free to clone it; but any pull request will be rejected because this repository is not for software development. :P)
Getting started with {h2o} on R
First of all, H2O itself requires Java Virtual Machine environment. Prior to installing {h2o}, you have to install the latest version of Java SE SDK*2.
Next, {h2o} is not distributed via CRAN but available on GitHub. In order to install it, you have to add some arguments to run install.packages function.
> install.packages("h2o",

repos=(c("http://s3.amazonaws.com/h2o-release/h2o/master/1542/R",

getOption("repos"))))

> library("h2o", lib.loc="C:/Program Files/R/R-3.0.2/library")

----------------------------------------------------------------------

Your next step is to start H2O and get a connection object (named

'localH2O', for example):

    > localH2O = h2o.init()

For H2O package documentation, ask for help:

    > ??h2o

After starting H2O, you can use the Web UI at http://localhost:54321

For more information visit http://docs.0xdata.com

----------------------------------------------------------------------

At any rate, now you can run {h2o} in R.
How {h2o} works on R
Once {h2o} package loaded, first you have to boot an H2O instance on Java VM. In the case below “nthreads” argument was set to -1, that means all CPU cores must be used for the H2O instance. If you want spare any cores, specify the number of cores you want to use for H2O, e.g. 7 or 6.
> localH2O <- h2o.init(ip = "localhost", port = 54321, startH2O = TRUE,

 nthreads=-1)

H2O is not running yet, starting it now...

Note:  In case of errors look at the following log files:

    C:\Users\XXX\AppData\Local\Temp\RtmpghjvGo/h2o_XXX_win_started_from_r.out

    C:\Users\XXX\AppData\Local\Temp\RtmpghjvGo/h2o_XXX_win_started_from_r.err

java version "1.7.0_67"

Java(TM) SE Runtime Environment (build 1.7.0_67-b01)

Java HotSpot(TM) 64-Bit Server VM (build 24.65-b04, mixed mode)

Successfully connected to http://localhost:54321

R is connected to H2O cluster:

    H2O cluster uptime:         1 seconds 506 milliseconds

    H2O cluster version:        2.7.0.1542

    H2O cluster name:           H2O_started_from_R

    H2O cluster total nodes:    1

    H2O cluster total memory:   7.10 GB

    H2O cluster total cores:    8

    H2O cluster allowed cores:  8

    H2O cluster healthy:        TRUE
Now you can run all functions of {h2o} package. Then load the simple XOR pattern and the grid dataset.
> cfData <- h2o.importFile(localH2O, path = "xor_simple.txt")

> pgData<-h2o.importFile(localH2O,path="pgrid.txt")
We’re ready to draw various decision boundaries using {h2o} package, in particular with Deep Learning. Let’s go to the next step.
Prior to trying Deep Learning, see the previous result
To compare a result of Deep Learning with ones of the other classifiers, please see the previous result. In the ones below, I ran decision tree, SVM with some sets of parameters, neural network (with only a hidden layer), and random forest.
Linearly inseparable and simple XOR pattern
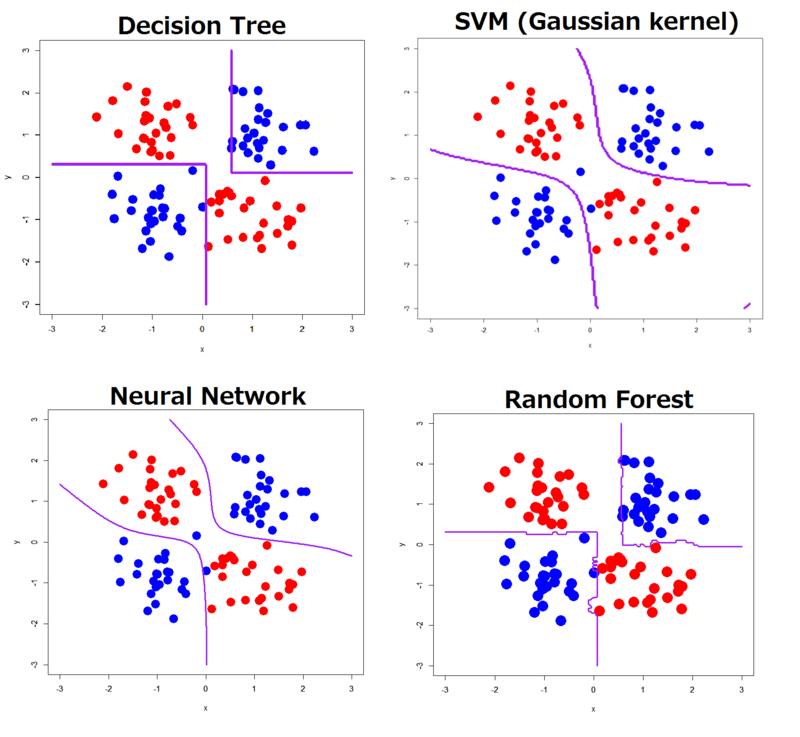
As clearly seen, all of the classifiers showed decision boundaries well reflecting its true distribution.
Linearly inseparable and complex XOR pattern
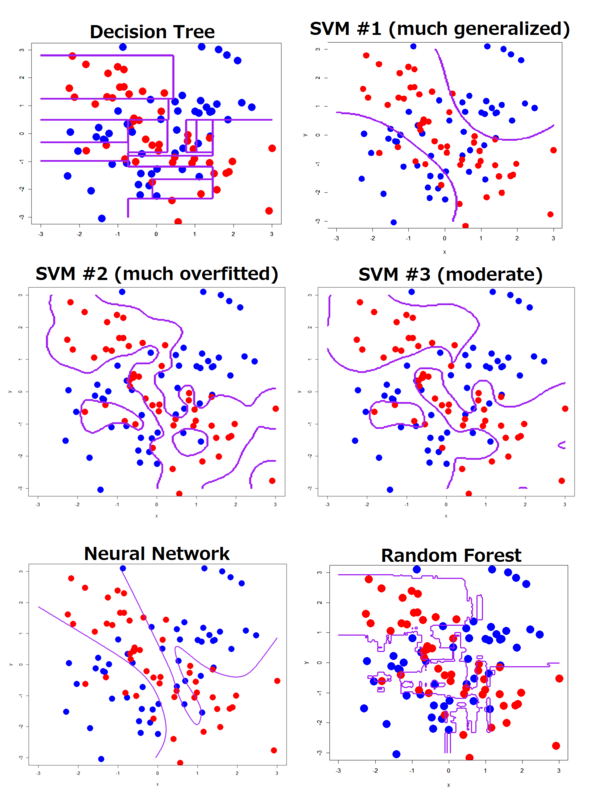
In contrast to the simple XOR pattern, the result showed a wide variety of decision boundaries. Decision tree, neural network and random forest estimated much more complicated boundaries than the true boundaries, although SVM with well generalized by specific parameters gave natural and well smoothed boundaries (but classification accuracy was not good).
OK, let’s run h2o.deeplearning function to estimate decision boundaries using Deep Learning.
Our primary interest here is what kind of set of tuning parameters shows what kind of decision boundaries. In h2o.deeplearning function, we can tune parameters (arguments) below:
- activation: Tanh, Rectifier and Maxout. We can also add “WithDropout” to implement the dropout procedure.
- hidden: details of hidden layers, by vector. c(3,2) means 1st hidden layer with 3 units and 2nd one with 2 units. rep(3,3) means 3 consecutive hidden layers with 3 units.
- epochs: the number of iteration. Of course larger epochs, more trained output you can get.
- autoencoder: logical value that determines whether autoencoder is used or not. Here we ignore it because the sample size is too small.
- hidden_dropout_ratio: dropout ratio of hidden layers by vector. Even if you want to implement the dropout procedure, we recommend to specify only 0.5 according to Baldi (NIPS, 2013).
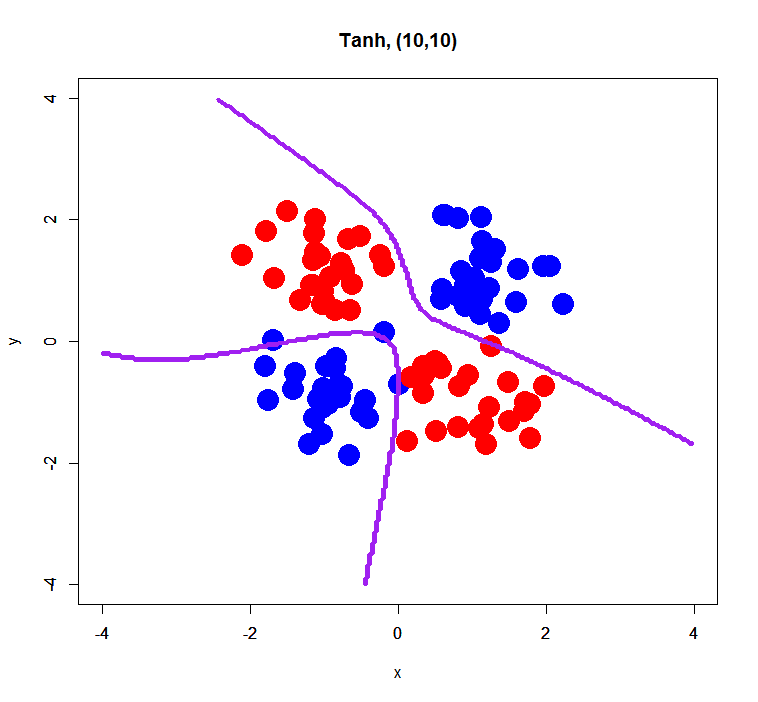
For simplification, in this post I only tune “activation” and “hidden”. In particular about “hidden”, the number of hidden layers are fixed to 2 or 3 and the number of units are fixed to 5 or 10. Anyway we can run it as below.
> res.dl<-h2o.deeplearning(x=1:2,y=3,data=xorsData,classification=T,

activation="Tanh",hidden=c(10,10),epochs=10)

> prd.dl<-h2o.predict(res.dl,newdata=pgData)

> prd.dl.df<-as.data.frame(prd.dl)

> xors <- read.table("xor_simple.txt", header=T)

> plot(xors[,-3], pch=19, col=c(rep('blue',50), rep('red',50)),

cex=3, xlim=c(-4,4), ylim=c(-4,4), main="Tanh, (10,10)")

> par(new=T)

> contour(px, py, array(prd.dl.df[,1], dim=c(length(px), length(py))),

xlim=c(-4,4), ylim=c(-4,4), col="purple", lwd=3,drawlabels=F)
A script above is just an example; please rewrite or adjust it to your environment.
simple XOR pattern with 2 hidden layers
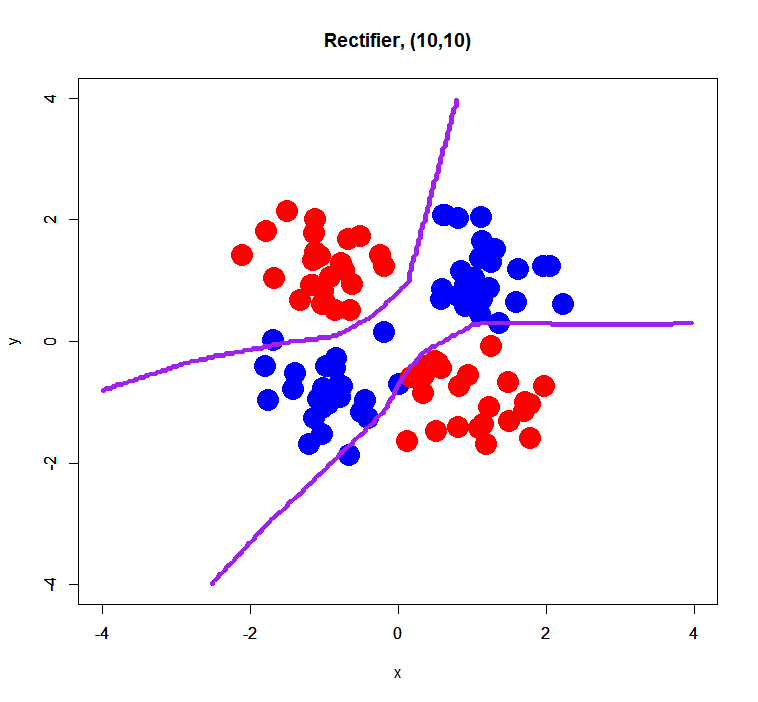
Rectifier
Maxout
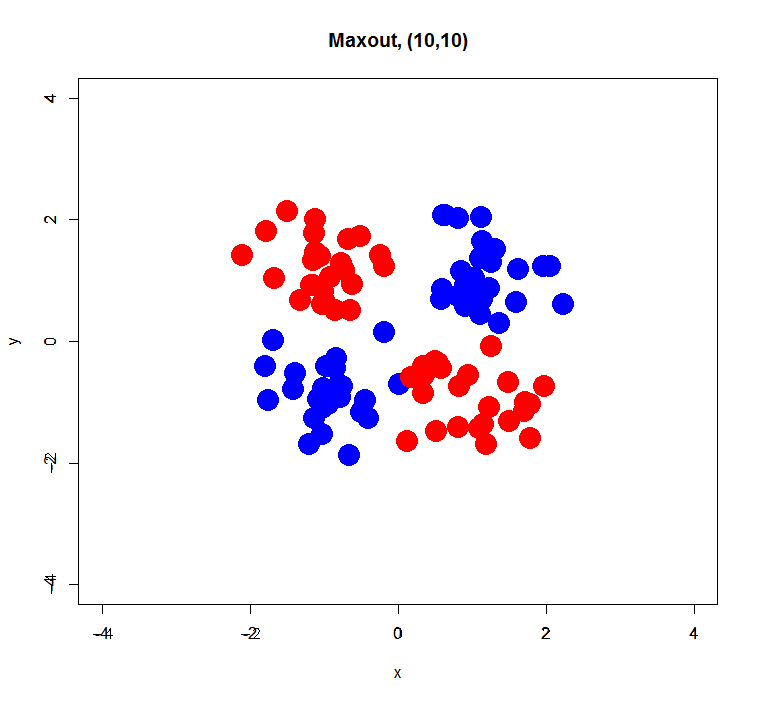
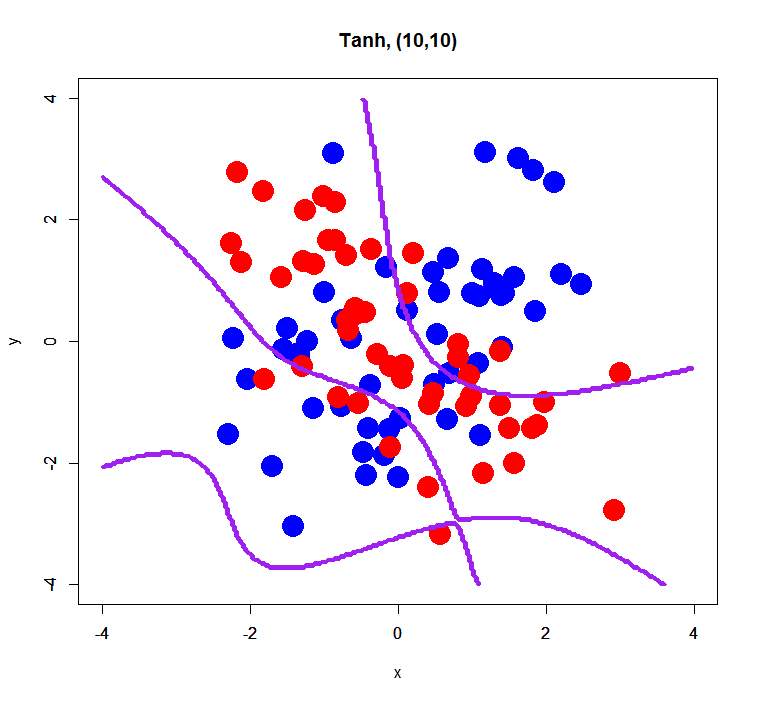
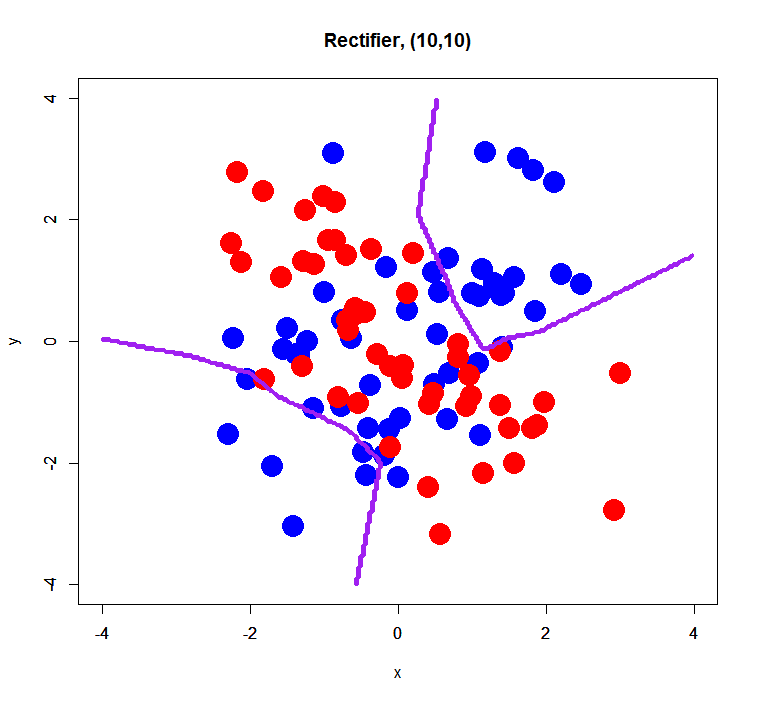
Maxout failed to estimate a classification model correctly… perhaps it was caused by too small sample size (only 100) or too small dimension (just 2D). On the other hand, Tanh and Rectifier showed fairly good decision boundaries.
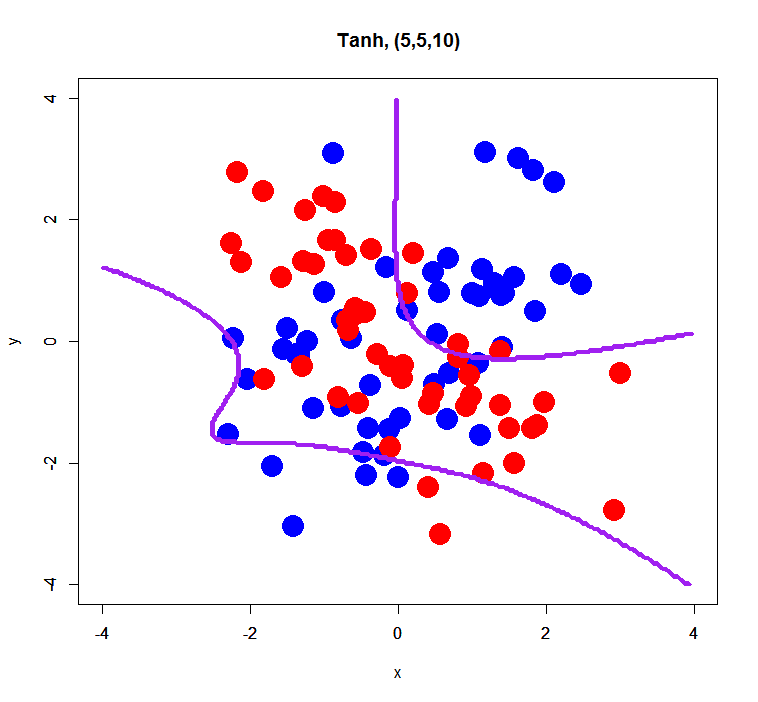
complex XOR pattern with 2 hidden layers
simple XOR pattern with 3 hidden layers
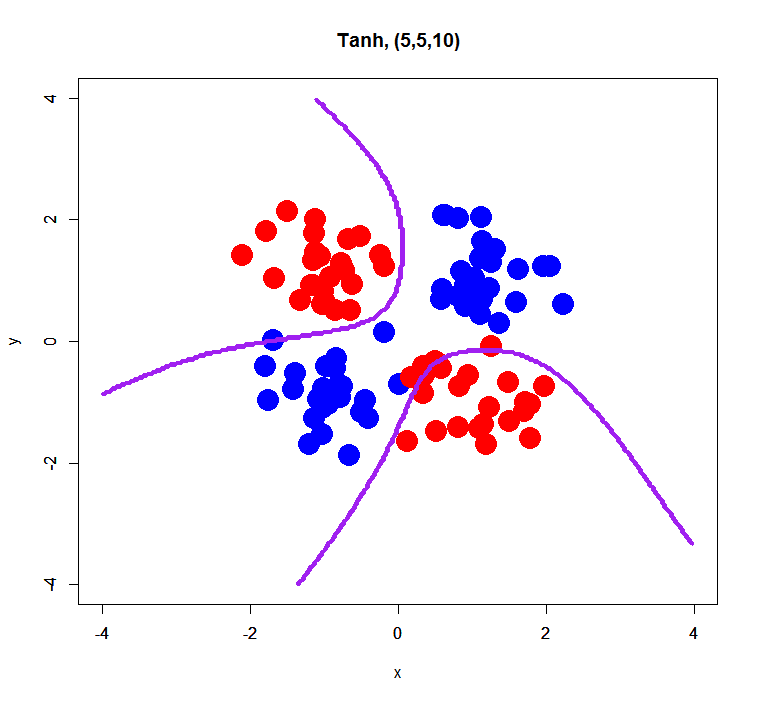
This is just a trial for evaluating an effect of the number of hidden layers. Prior to this trial, I think its number may affect a bit results of classification… so, how was it?
 Rectifier
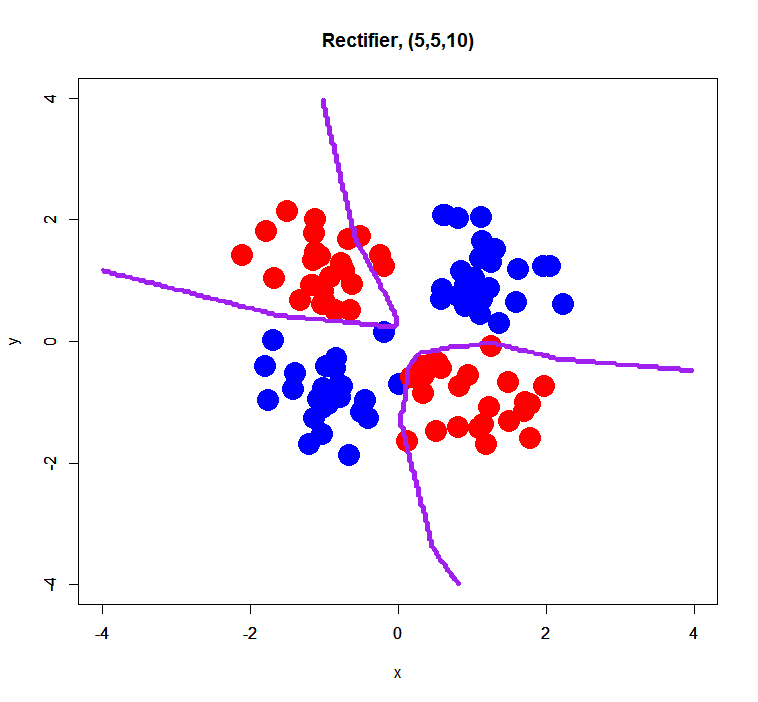 Both of decision boundaries look getting more overfit than ones with 2 hidden layers, but seem to well classify samples.
 Recitifier
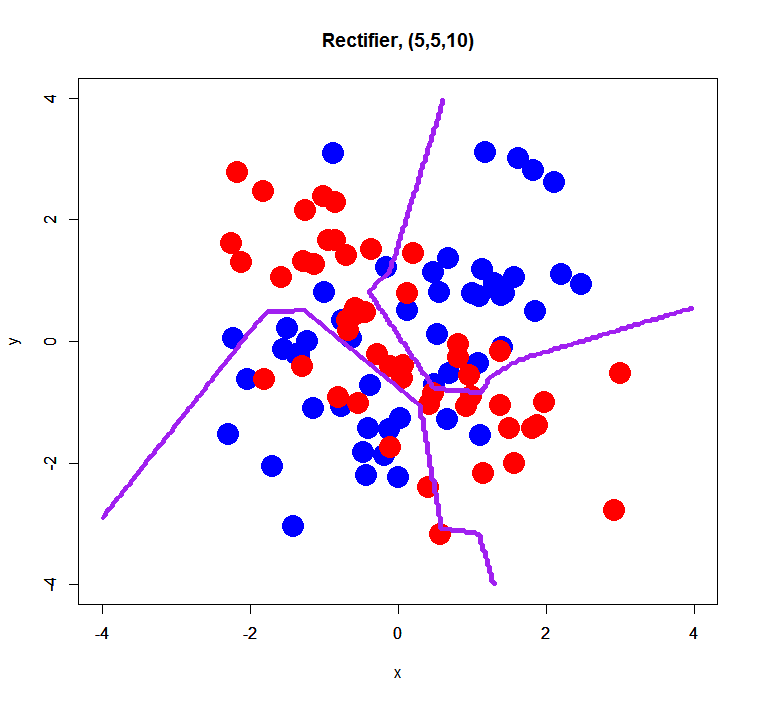 I feel like joking. :)
 Conclusion
The most important lesson that I learned from a series of these trials is that performance of Deep Learning would strongly depend on parameter tuning, including choosing which activation function, the number of hidden layers and/or the number of units of each layer.
I think this feature has been also known as an important feature of traditional neural network (with only a hidden layer). From the result here, I guess its characteristics are taken over by Deep Learning, although hidden layers in Deep Learning in early layers behave just as “preprocesser” or “feature generator” but not conventional classifiers.
My conclusion here is simple; be much careful about parameter tuning for Deep Learning. It can easily boost your result, but at the same time it can spoil your classifier.
- *1:Of course here I think the latest topic of Deep Learning is “ConvNet” or convolutional neural network with convolution and max pooling
- *2:I believe almost all of readers of this blog already installed it…
Bio: Takashi J. OZAKI, Ph. D. is a Data scientist, Quant analyst & researcher.
Original, reposted by permission.
Related:
 Previous post
Most popular last 30 days
Most viewed last 30 days
- Top 20 Python Machine Learning Open Source Projects - Jun 1, 2015.
- R vs Python for Data Science: The Winner is ... - May 26, 2015.
- R leads RapidMiner, Python catches up, Big Data tools grow, Spark ignites - May 25, 2015.
- Top 10 Data Mining Algorithms, Explained - May 21, 2015.
- Poll: What Predictive Analytics, Data Mining, Data Science software/tools you used in the past 12 months? - May 7, 2015.
- 7 Steps for Learning Data Mining and Data Science - Oct 10, 2013.
- Top 10 Data Analysis Tools for Business - Jun 13, 2014.
- 9 Must-Have Skills You Need to Become a Data Scientist - Nov 22, 2014.
- Seven Techniques for Data Dimensionality Reduction - May 14, 2015.
- 21 Essential Data Visualization Tools - May 28, 2015.
Most shared last 30 days
- Top 20 Python Machine Learning Open Source Projects - Jun 1, 2015.
- R vs Python for Data Science: The Winner is ... - May 26, 2015.
- R leads RapidMiner, Python catches up, Big Data tools grow, Spark ignites - May 25, 2015.
- Which Big Data, Data Mining, and Data Science Tools go together? - Jun 11, 2015.
- Top 10 Data Mining Algorithms, Explained - May 21, 2015.
- Seven Techniques for Data Dimensionality Reduction - May 14, 2015.
- 150 Most Influential People in Big Data & Hadoop - May 27, 2015.
- Exclusive Interview: Matei Zaharia, creator of Apache Spark, on Spark, Hadoop, Flink, and Big Data in 2020 - May 22, 2015.
- Will the Real Data Scientists Please Stand Up? - May 18, 2015.
- R vs Python, why each is better - May 19, 2015.
Decision Boundaries for Deep Learning and other Machine Learning classifiers的更多相关文章
- 《MATLAB Deep Learning:With Machine Learning,Neural Networks and Artificial Intelligence》选记
一.Training of a Single-Layer Neural Network 1 Delta Rule Consider a single-layer neural network, as ...
- Coursera Deep Learning 3 Structuring Machine Learning Projects, ML Strategy
Why ML stategy 怎么提高预测准确度?有了stategy就知道从哪些地方入手,而不至于找错方向做无用功. Satisficing and Optimizing metric 上图中,run ...
- 机器学习分支:active learning、incremental learning、online machine learning
1. active learning Active learning 是一种特殊形式的半监督机器学习方法,该方法允许交互式地询问用户(或者其他形式的信息源 information source)以获取 ...
- 【机器学习 Azure Machine Learning】Azure Machine Learning 访问SQL Server 无法写入问题 (使用微软Python AML Core SDK)
问题情形 使用Python SDK在连接到数据库后,连接数据库获取数据成功,但是在Pandas中用 to_sql 反写会数据库时候报错.错误信息为:ProgrammingError: ('42000' ...
- 机器学习(Machine Learning)&深度学习(Deep Learning)资料(Chapter 2)
##机器学习(Machine Learning)&深度学习(Deep Learning)资料(Chapter 2)---#####注:机器学习资料[篇目一](https://github.co ...
- 学习笔记之Machine Learning Crash Course | Google Developers
Machine Learning Crash Course | Google Developers https://developers.google.com/machine-learning/c ...
- 【机器学习Machine Learning】资料大全
昨天总结了深度学习的资料,今天把机器学习的资料也总结一下(友情提示:有些网站需要"科学上网"^_^) 推荐几本好书: 1.Pattern Recognition and Machi ...
- [Machine Learning] 国外程序员整理的机器学习资源大全
本文汇编了一些机器学习领域的框架.库以及软件(按编程语言排序). 1. C++ 1.1 计算机视觉 CCV —基于C语言/提供缓存/核心的机器视觉库,新颖的机器视觉库 OpenCV—它提供C++, C ...
- Machine Learning for Developers
Machine Learning for Developers Most developers these days have heard of machine learning, but when ...
随机推荐
- 关于JFace中的向导式对话框(WizardDialog类)
向导式对话框是一种非常友好的界面,它能够引导用户一步步的输入信息.Eclipse的"新建项目",就是这样的向导式对话框. 在Eclipse中向导式对话框的开发是很简单的,它由Wiz ...
- SSRS集成至Web
分几步进行,第一步要实现:IReportServerCredentials 接口第二步:拖入ReportViewer控件第三步:进行报表传参控制.具体如下图描述....代码部分参考下附件 using ...
- html转图片
using System.IO; using System.Drawing; using System.Threading; using System.Windows.Forms; public cl ...
- 比较ASP生成静态HTML文件的几种方法
将动态页面转换生成静态Html文件有许多好处,比如生成html网页有利于被搜索引擎收录(特别是对接受动态参数的页面).前台访问时,脱离了数据访问,减轻对数据库访问的压力,加快网页打开速度. 当然,凡事 ...
- java反射案例讲解
本篇文章依旧采用小例子来说明,因为我始终觉的,案例驱动是最好的,要不然只看理论的话,看了也不懂,不过建议大家在看完文章之后,在回过头去看看理论,会有更好的理解. 下面开始正文. [案例1]通过一个对象 ...
- WCF编程系列(一)初识WCF
WCF编程系列(一)初识WCF Windows Communication Foundation(WCF)是微软为构建面向服务的应用程序所提供的统一编程模型.WCF的基本概念: 地址:定义服务的 ...
- freemark页面中获取list循环中的counter
如何在freemark页面中获取到当前list循环的counter 直接上代码 <#list lists as x> <#assign j=x?counter> ${j} // ...
- n个骰子的点数
把n个骰子扔在地上,所有骰子朝上的一面的点数之和为s.输入n,打印出s的所有可能的值和出现的概率. 解法一:基于递归求骰子点数. /////////////////基于递归求骰子点数///////// ...
- ubuntu下boost的配置方法
boost版本为: boost_1_52_0ubuntu版本为:ubuntu-12.04.1-desktop-i386 这里有两种安装方法: =============第一种: 也是最简单的:进入li ...
- Thrift原理与使用实例
一 Thrift框架介绍 1 前言 Thrift是一个跨语言的服务部署框架,最初由Faceboo开发并进入Apache开源项目. Thrift特征如下: 1)Thrift有自己的跨机器通信框架,并提供 ...