
第167天:canvas绘制柱状图
canvas绘制柱状图
1、HTML
 <!DOCTYPE html>

 <html lang="en">

 <head>

     <meta charset="UTF-8">

     <meta name="viewport" content="width=device-width, initial-scale=1.0, user-scalable=no">

     <title>06柱状图面向对象版本</title>

     <style>

         body {

             padding: 0;

             margin: 0;

             background-color: #f0f0f0;

             overflow: hidden;

         }

     </style>

     <script src="bower_components/konva/konva.min.js"></script>

     <script src="js/HistogramChart.js"></script>

 </head>

 <body>

     <div id="container">

     </div>

     <script>

         //创建舞台

         var stage = new Konva.Stage({

             container: 'container',

             width: window.innerWidth,//全屏

             height: window.innerHeight

         });

         //创建层

         var layer = new Konva.Layer();

         stage.add(layer);

         //中心点坐标

         var cenX = stage.width() / 2;

         var cenY = stage.height() / 2;

         //柱状图的数据

         var data = [

             { name: '前端', value: '.8', color: 'green'},

             { name: 'PHP', value: '.3', color: 'blue'},

             { name: 'Java', value: '.7', color: 'red'},

             { name: 'UI', value: '.9', color: 'orange'},

             { name: 'IOS', value: '.4', color: 'purple'},

             { name: 'Android', value: '.9', color: 'pink'}

         ];

         var h  = new HistogramChart({

             x: 1/8 * stage.width(),

             y: 3/4 * stage.height(),

             w: 3/4 * stage.width(),

             h: 1/2 * stage.height(),

             data: data

         });

         h.addToGroupOrLayer( layer );

         layer.draw();

         stage.on('contentClick', function(){

             h.playAnimate();

         });

     </script>

 </body>

 </html>
2、HistogramChart.js
 // Histogram:柱状图的意思 英 ['hɪstəgræm]  美 ['hɪstəɡræm]

 function HistogramChart( option ) {

     // zzt

     this._init( option );

     // JQJB:警情级别

 }

 HistogramChart.prototype = {

     _init: function( option ) {

         this.x = option.x || 0;

         this.y = option.y || 0; //柱状图的原点坐标

         this.w = option.w || 0; //柱状图的总宽度

         this.h = option.h || 0; //柱状图高度

         this.data = option.data || [];

         var x0 = 0;

         var y0 = 0;

         // 柱状图中所有的元素的组

         this.group = new Konva.Group({

             x: this.x,

             y: this.y

         });

         //放矩形的组

         this.rectGroup = new Konva.Group({

             x: 0,

             y: 0

         });

         this.group.add( this.rectGroup );

         //添加一个放百分比文字的组

         this.textPercentGroup = new Konva.Group({

             x: 0,

             y: 0

         });

         this.group.add( this.textPercentGroup );

         //初始化底线

         var bsLine = new Konva.Line({

             //x:从 1/8 x,  3/4

             //y: 3/4 高度处

             points: [x0,y0, x0+this.w, y0], //要求 底线按照画布的左上角顶点进行定位。

             strokeWidth: 1,

             stroke: 'lightgreen',

         });

         this.group.add( bsLine );

         var rectWidth = this.w / this.data.length; //每个矩形占用的总宽度

         var height = this.h;

         var self = this;// 当前柱状图的对象

         //初始化 矩形

         //初始化 文字%

         //初始化 底部文字

         this.data.forEach(function(item, index) {// item:数组中元素,index是索引值

             //生成一个矩形

             var rect = new Konva.Rect({

                 x: x0 + (1/4 + index ) * rectWidth,//

                 y: y0 - item.value * height,

                 width: 1/2 * rectWidth,

                 height: item.value * height,

                 fill: item.color,

                 opacity: .8,         //设置透明度

                 cornerRadius: 10,     //设置圆角

                 shadowBlur: 10,          //设置阴影的模糊级别

                 shadowColor: 'black',//设置阴影的颜色

                 // shadowOffsetX: 4, //设置阴影的X偏移量

                 // shadowOffsetY: 4     //设置应用的Y偏移量

             });

             self.rectGroup.add( rect );

             //把百分比的文字放到 柱状图的顶部

             var text = new Konva.Text({

                 x: x0 + (index ) * rectWidth,//

                 y: y0 - item.value * height - 14,

                 fontSize: 14,

                 text: item.value * 100 + '%',

                 fill: item.color,

                 width: rectWidth,// 配合让文字居中

                 align: 'center',  //

                 name: 'textPercent'  //设置文字的name后,可以通过类选择器进行选取。

             });

             self.textPercentGroup.add( text );

             //把百分比的文字放到 柱状图的顶部

             var textBottom = new Konva.Text({

                 x: x0 + (1/4 + index ) * rectWidth,//

                 y: y0,

                 fontSize: 14,

                 text: item.name,

                 fill: item.color,

                 // width: rectWidth,// 配合让文字居中

                 // align: 'center',  //

                 rotation: 30

             });

             self.group.add( textBottom );

         });

     },

     addToGroupOrLayer: function( arg ) {

         arg.add( this.group );

     },

     playAnimate: function() {

         var self = this;

         // 让柱状图 y→ y0  height:0

         this.rectGroup.getChildren().each(function(item, index){

             item.y(0);

             item.height(0);

             //经过一个动画还原

             item.to({

                 duration: 1,

                 y: - self.data[index].value * self.h,

                 height: self.data[index].value * self.h

             });

         });

         //让文字有个动画

         this.textPercentGroup.getChildren().each(function( item, index ){

             item.y(-14);

             item.to({

                 duration: 1,

                 y: - self.data[index].value * self.h -14

             });

         });

     }

 }
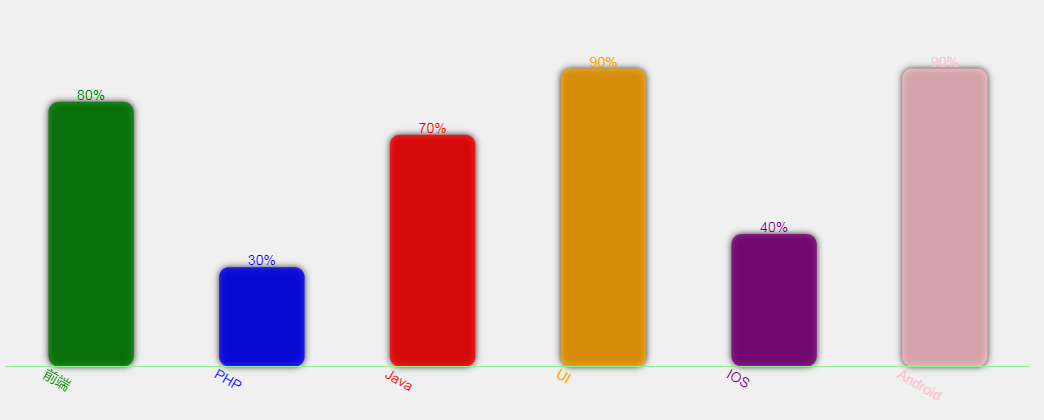
运行效果:
第167天:canvas绘制柱状图的更多相关文章
- 【带着canvas去流浪】(1)绘制柱状图
目录 一. 任务说明 二. 重点提示 三. 示例代码 四. 思考题 示例代码托管在:http://www.github.com/dashnowords/blogs 博客园地址:<大史住在大前端& ...
- 带着canvas去流浪系列之一:绘制柱状图
[摘要] 学习使用canvasAPI来实现数据可视化. 示例代码托管在:http://www.github.com/dashnowords/blogs 一. 任务说明 使用原生canvasAPI绘制柱 ...
- HTML5学习总结——canvas绘制象棋(canvas绘图)
一.HTML5学习总结——canvas绘制象棋 1.第一次:canvas绘制象棋(笨方法)示例代码: <!DOCTYPE html> <html> <head> & ...
- 用canvas绘制折线图
<!DOCTYPE html> <html lang="en"> <head> <meta charset="UTF-8&quo ...
- 封装 用canvas绘制直线的函数--面向对象
<!DOCTYPE html> <html lang="en"> <head> <meta charset="UTF-8&quo ...
- 学习笔记:HTML5 Canvas绘制简单图形
HTML5 Canvas绘制简单图形 1.添加Canvas标签,添加id供js操作. <canvas id="mycanvas" height="700" ...
- canvas绘制经典折线图(一)
最终效果图如下: 实现步骤如下:注-引用了jQuery HTML代码 <!doctype html> <html lang="en"> <head&g ...
- Canvas绘制图形
1.Canvas绘制一个蓝色的矩形 <!DOCTYPE html> <html> <head lang="en"> <meta chars ...
- [canvas]利用canvas绘制自适应的折线图
前段时间学习了用canvas绘制折现图,且当画布变换大小,折现图会随之变化,现附上代码 <!DOCTYPE html> <html lang="en"> & ...
随机推荐
- 20155322 2017-2018-1《信息安全系统设计》第二周 课堂测试 Linux下C语言实现MYOD
20155322 2017-2018-1<信息安全系统设计>第二周 课堂测试 Linux下C语言实现MYOD [博客目录] 静态库测试 实现方法 相关资料 操作 动态库测试 实现方法 相关 ...
- ELKStack入门篇(五)之实用架构解析
(1)用户通过nginx或haproxy访问ELK日志统计平台,IP地址为keepalived的vip地址. (2)nginx将请求转发到kibana (3)kibana到elasticsearch获 ...
- AngularJS中Directive指令系列
近段时间在研究Angular中的directive用法,打算写个系列.以官方文档为主.并参考诸多教程.加上自己的思考. 基本概念及用法 scope属性的使用. &, <, =, @ 符 ...
- 9.14 DP合集水表
9.14 DP合集水表 关键子工程 在大型工程的施工前,我们把整个工程划分为若干个子工程,并把这些子工程编号为 1. 2. --. N:这样划分之后,子工程之间就会有一些依赖关系,即一些子工程必须在某 ...
- C# List<string> 的Contains方法 是区分大小写的
List<string> 的Contains 是区分大小写的 代码: List<string> test = new List<string>(); test.A ...
- python全栈开发- 前⽅⾼能-迭代器
python_day_12 今日主要内容 1, 函数名的应用,第一类对象 函数名可以像变量一样进行使用 1.赋值 2.作为list元素 3.作为参数 4.作为返回值 2, 闭包 内部函数访问外部函数的 ...
- PHP:Iterator(迭代器)接口和生成器
迭代器 可在内部迭代自己的外部迭代器或类的接口.详情:http://php.net/manual/zh/class.iterator.php 接口摘要 Iterator extends Travers ...
- python序列和其它类型的比较
序列对象可以与相同类型的其他对象比较.它们使用 字典顺序 进行比较:首先比较两个python序列的第一个元素,如果不同,那么这就决定了比较操作的结果.如果它们相同,就再比较每个序列的第二个元素,以此类 ...
- Atom 插件 Sync Settings 备份与恢复
当使用 Atom IDEA.随着使用的越来越多,安装的插件也越来越多,一旦电脑重装后需要复原开发环境,这将是一件比较头疼的事.「Sync Settings」插件可以帮助我们解决这个问题. 操作流程 安 ...
- Literature Books
Lean In (Sheryl Sandberg) Option B (Sheryl Sandberg) Ready Player One