
ELKStack入门篇(五)之实用架构解析
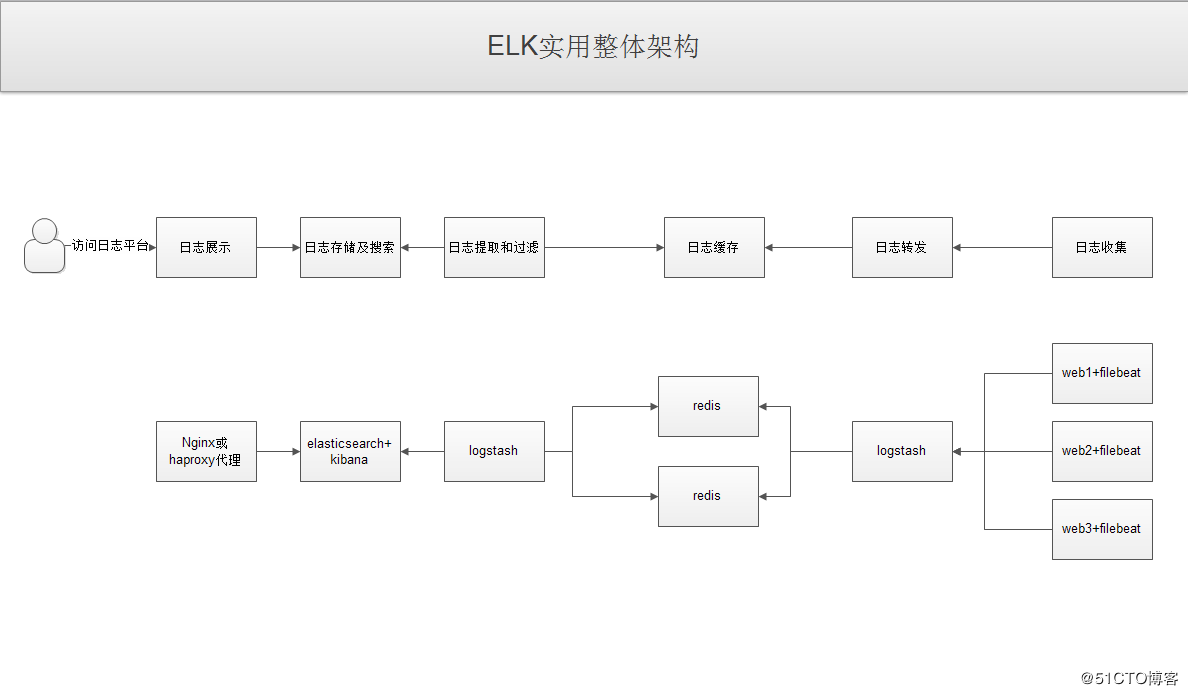
(1)用户通过nginx或haproxy访问ELK日志统计平台,IP地址为keepalived的vip地址。
(2)nginx将请求转发到kibana
(3)kibana到elasticsearch获取数据,elasticsearch是两台做的集群,数据会随机保存在任意一台elasticsearch服务器。
(4)logstash①从redis中取出数据并发送到elasticsearch中。
(5)redis服务器做数据的临时保存,避免web服务器日志量过大的时候造成的数据收集与保存不一致而导致日志丢失,其中redis可以做集群,然后再由logstash服务器在非高峰时期从redis持续的取出数据。
(6)logstash②过滤从filebeat取出的日志信息,并放入redis中进行保存。
(7)filebeat进行收集web的日志
注:其中为什么要在redis前面增加一台logstash呢?是因为在大量的日志数据写入时,容易导致数据的丢失和混乱,为了解决这一问题,增加一台logstash可以通过类型进行过滤,降低数据传输的臃肿。
1、ELK架构实用演示
(1)修改filebeat输出到logstash
[root@linux-node2 ~]# vim /etc/filebeat/filebeat.yml

output.logstash:

  hosts: ["192.168.56.11:5044"]

  enabled: true

  worker:

  compression_level:

[root@linux-node2 ~]# systemctl restart filebeat
(2)配置linux-node1上的logstash并测试标准输出
[root@linux-node1 conf.d]# cat beats.conf

input {

    beats {

        port => ""

    }

}

output {

    stdout {

        codec => rubydebug

    }

}

#写入日志测试

[root@linux-node2 ~]# echo "" >> /var/log/messages

#查看是否有标准输出

[root@linux-node1 conf.d]# /usr/share/logstash/bin/logstash -f /etc/logstash/conf.d/beat.conf

OpenJDK -Bit Server VM warning: If the number of processors is expected to increase from one, then you should configure the number of parallel GC threads appropriately using -XX:ParallelGCThreads=N

WARNING: Could not find logstash.yml which is typically located in $LS_HOME/config or /etc/logstash. You can specify the path using --path.settings. Continuing using the defaults

Could not find log4j2 configuration at path /usr/share/logstash/config/log4j2.properties. Using default config which logs errors to the console

[INFO ] -- ::04.358 [[main]<beats] Server - Starting server on port:

{

    "@timestamp" => --02T06::.731Z,

        "offset" => ,

      "@version" => "",

          "beat" => {

            "name" => "linux-node2",

        "hostname" => "linux-node2",

         "version" => "6.0.1"

    },

          "host" => "linux-node2",

    "prospector" => {

        "type" => "log"

    },

        "source" => "/var/log/messages",

       "message" => "",

          "tags" => [

        [] "beats_input_codec_plain_applied"

    ]

}
(3)配置linux-node1的logstash输出到redis
[root@linux-node1 conf.d]# vim beats.conf

input {

    beats {

        port => ""

    }

}

output {

               redis {

                       data_type => "list"

                       host => "192.168.56.12"

                       db => ""

                       port => ""

                       password => ""

                       key => "filebeat-systemlog-5612"

        }

}

[root@linux-node1 conf.d]# systemctl restart logstash

#写入日志

[root@linux-node2 conf.d]# echo "" >> /var/log/messages

[root@linux-node2 conf.d]# echo "" >> /var/log/messages

[root@linux-node2 conf.d]# echo "" >> /var/log/messages

#查看redis的记录

[root@linux-node2 ~]# redis-cli -h 192.168.56.12 -a

192.168.56.12:> select

OK

192.168.56.12:[]> keys *

) "filebeat-systemlog-5612"

192.168.56.12:[]> keys *

) "filebeat-systemlog-5612"
(4)配置linux-node2上的logstash从redis中取出数据
[root@linux-node2 conf.d]# vim redis-es.conf

input {

    redis {

        data_type => "list"

        host => "192.168.56.12"

        db => ""

        port => ""

        key => "filebeat-systemlog-5612"

        password => ""

    }

}

output {

    elasticsearch {

        hosts => ["192.168.56.11:9200"]

        index => "redis22-systemlog-%{+YYYY.MM.dd}"

    }

}

[root@linux-node2 conf.d]# systemctl restart logstash
(5)head插件查看并添加Kibana索引
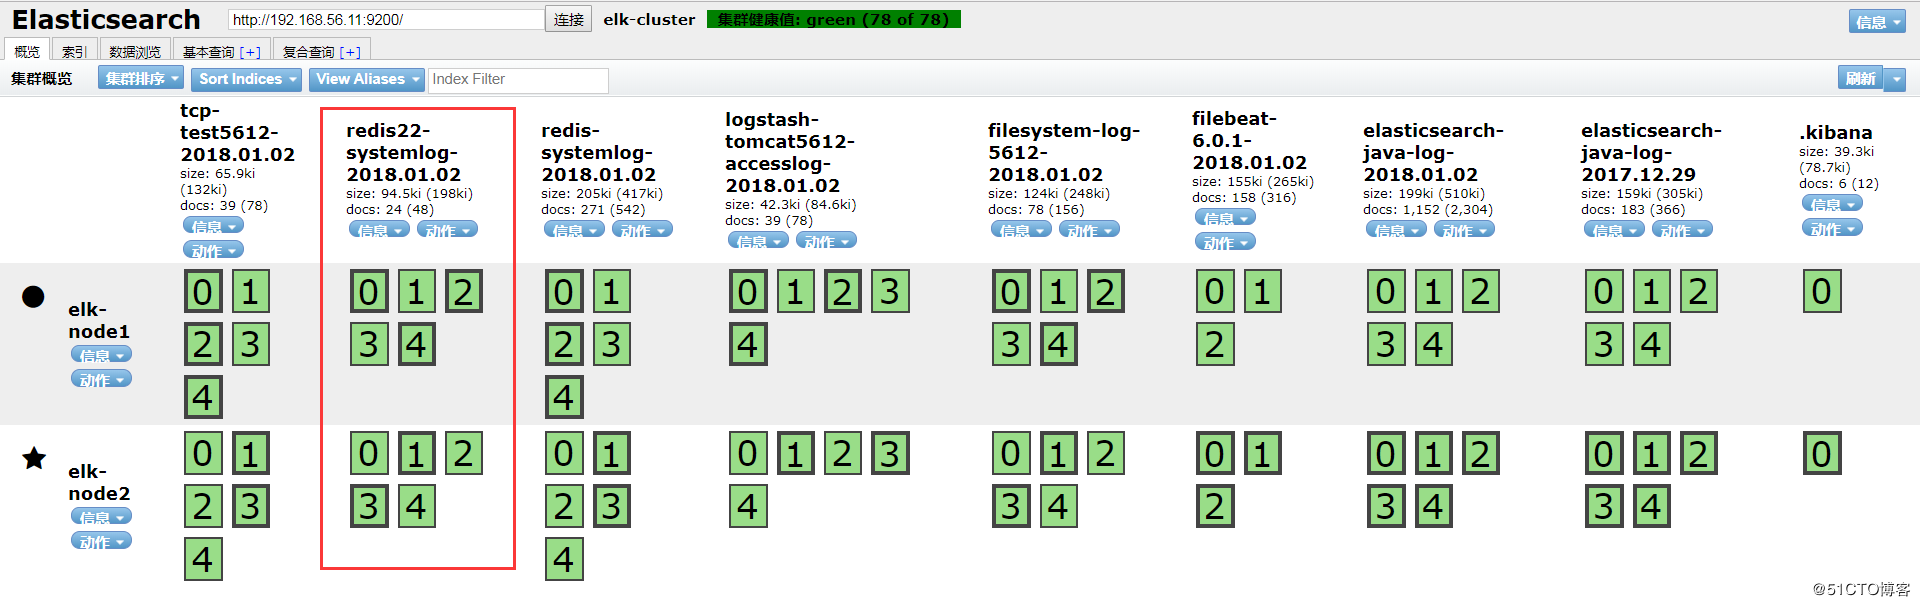
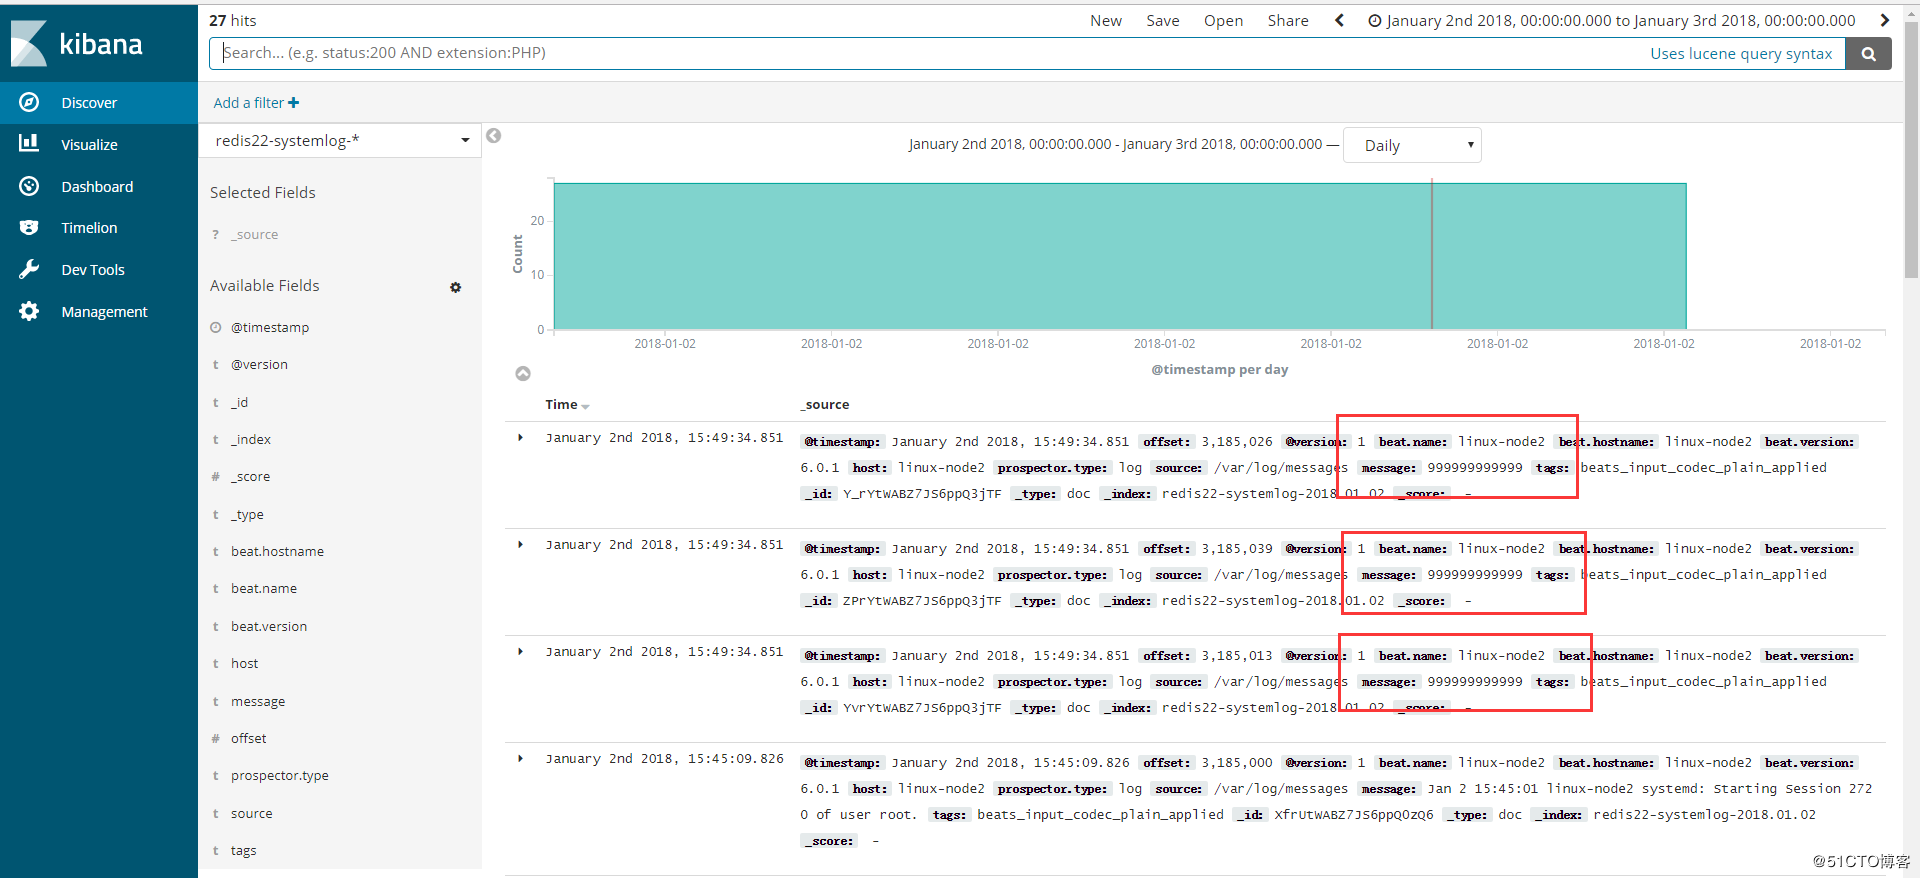
#写入日志测试,并在Kibana查看

[root@linux-node2 conf.d]# echo "" >> /var/log/messages

[root@linux-node2 conf.d]# echo "" >> /var/log/messages

[root@linux-node2 conf.d]# echo "" >> /var/log/messages

[root@linux-node2 conf.d]# date

2018年 01月 02日 星期二 :: CST
2、filebeat收集多类型日志
#使用filebeat .0写入document_type作为类型判断,无法输出到redis,暂时未找到原因,这里将filebeat换成了5.4版本。

[root@linux-node2 conf.d]# grep -v "#" /etc/filebeat/filebeat.yml |grep -v "^$"

filebeat.prospectors:

- input_type: log

  paths:

    - /var/log/*.log

    - /var/log/messages

  exclude_lines: ["^DBG","^$"]

  document_type: filebeat2-systemlog-5612

- input_type : log      #增加一个类型和日志路径

  paths:

    - /usr/local/tomcat/logs/tomcat_access_log.*.log

  document_type: tomcat-accesslog-5612

output.logstash:

  hosts: ["192.168.56.11:5044"]

  worker: 2

  compression_level: 3

[root@linux-node2 conf.d]# systemctl restart filebeat

#修改linux-node1上的logstash配置

[root@linux-node1 conf.d]# cat beats.conf

input {

    beats {

        port => "5044"

    }

}

output {

    if [type] == "filebeat2-systemlog-5612" {

           redis {

                       data_type => "list"

                       host => "192.168.56.12"

                       db => "4"

                       port => "6379"

                       password => "123456"

                       key => "filebeat-systemlog-5612"

        }}

    if [type] == "tomcat-accesslog-5612" {

        redis {

            data_type => "list"

            host => "192.168.56.12"

            db => "6"

            port => "6379"

            password => "123456"

            key => "tomcat-accesslog-5612"

        }

    }

}

#访问tomcat并查看日志

[root@linux-node2 conf.d]# tailf /usr/local/tomcat/logs/tomcat_access_log.2018-01-03.log

{"clientip":"192.168.56.1","ClientUser":"-","authenticated":"-","AccessTime":"[03/Jan/2018:09:35:12 +0800]","method":"GET /webdir/index.html HTTP/1.1","status":"200","SendBytes":"31","Query?string":"","partner":"-","AgentVersion":"Mozilla/5.0 (Windows NT 6.1; Win64; x64) AppleWebKit/537.36 (KHTML, like Gecko) Chrome/62.0.3202.94 Safari/537.36"}

{"clientip":"192.168.56.1","ClientUser":"-","authenticated":"-","AccessTime":"[03/Jan/2018:09:35:12 +0800]","method":"GET /favicon.ico HTTP/1.1","status":"200","SendBytes":"21630","Query?string":"","partner":"http://192.168.56.12:8080/webdir/index.html","AgentVersion":"Mozilla/5.0 (Windows NT 6.1; Win64; x64) AppleWebKit/537.36 (KHTML, like Gecko) Chrome/62.0.3202.94 Safari/537.36"}

{"clientip":"192.168.56.1","ClientUser":"-","authenticated":"-","AccessTime":"[03/Jan/2018:09:35:12 +0800]","method":"GET /webdir/index.html HTTP/1.1","status":"200","SendBytes":"31","Query?string":"","partner":"-","AgentVersion":"Mozilla/5.0 (Windows NT 6.1; Win64; x64) AppleWebKit/537.36 (KHTML, like Gecko) Chrome/62.0.3202.94 Safari/537.36"}

{"clientip":"192.168.56.1","ClientUser":"-","authenticated":"-","AccessTime":"[03/Jan/2018:09:35:12 +0800]","method":"GET /favicon.ico HTTP/1.1","status":"200","SendBytes":"21630","Query?string":"","partner":"http://192.168.56.12:8080/webdir/index.html","AgentVersion":"Mozilla/5.0 (Windows NT 6.1; Win64; x64) AppleWebKit/537.36 (KHTML, like Gecko) Chrome/62.0.3202.94 Safari/537.36"}

{"clientip":"192.168.56.1","ClientUser":"-","authenticated":"-","AccessTime":"[03/Jan/2018:09:35:12 +0800]","method":"GET /webdir/index.html HTTP/1.1","status":"200","SendBytes":"31","Query?string":"","partner":"-","AgentVersion":"Mozilla/5.0 (Windows NT 6.1; Win64; x64) AppleWebKit/537.36 (KHTML, like Gecko) Chrome/62.0.3202.94 Safari/537.36"}

{"clientip":"192.168.56.1","ClientUser":"-","authenticated":"-","AccessTime":"[03/Jan/2018:09:35:12 +0800]","method":"GET /favicon.ico HTTP/1.1","status":"200","SendBytes":"21630","Query?string":"","partner":"http://192.168.56.12:8080/webdir/index.html","AgentVersion":"Mozilla/5.0 (Windows NT 6.1; Win64; x64) AppleWebKit/537.36 (KHTML, like Gecko) Chrome/62.0.3202.94 Safari/537.36"}

{"clientip":"192.168.56.1","ClientUser":"-","authenticated":"-","AccessTime":"[03/Jan/2018:09:35:13 +0800]","method":"GET /webdir/index.html HTTP/1.1","status":"200","SendBytes":"31","Query?string":"","partner":"-","AgentVersion":"Mozilla/5.0 (Windows NT 6.1; Win64; x64) AppleWebKit/537.36 (KHTML, like Gecko) Chrome/62.0.3202.94 Safari/537.36"}

#查看redis是否有数据

[root@linux-node2 ~]# redis-cli -h 192.168.56.12 -a 123456

192.168.56.12:6379[4]> select 6

OK

192.168.56.12:6379[6]> keys *

1) "tomcat-accesslog-5612"

192.168.56.12:6379[6]> keys *

1) "tomcat-accesslog-5612"

192.168.56.12:6379[6]> llen tomcat-accesslog-5612

(integer) 54
3、通过nginx代理kibana并实现登录验证
(1)配置nginx
[root@linux-node1 ~]# yum install -y nginx

[root@linux-node1 ~]# vim /etc/nginx/nginx.conf

#增加

include /etc/nginx/conf.d/*.conf;

[root@linux-node1 conf.d]# vim /etc/nginx/conf.d/kibana.conf

upstream kibana_server {

        server 127.0.0.1:5601 weight=1 max_fails=3 fail_timeout=60;

}

server {

        listen 80;

        server_name www.kibana5611.com;

        location / {

                proxy_pass http://kibana_server;

                proxy_http_version 1.1;

        }

}

[root@linux-node1 conf.d]# nginx -t

nginx: the configuration file /etc/nginx/nginx.conf syntax is ok

nginx: configuration file /etc/nginx/nginx.conf test is successful

[root@linux-node1 conf.d]# systemctl reload nginx
(2)配置kibana.yml
[root@linux-node1 ~]# vim /etc/kibana/kibana.yml

#修改server.host

server.host: "127.0.0.1"

[root@linux-node1 conf.d]# systemctl restart kibana
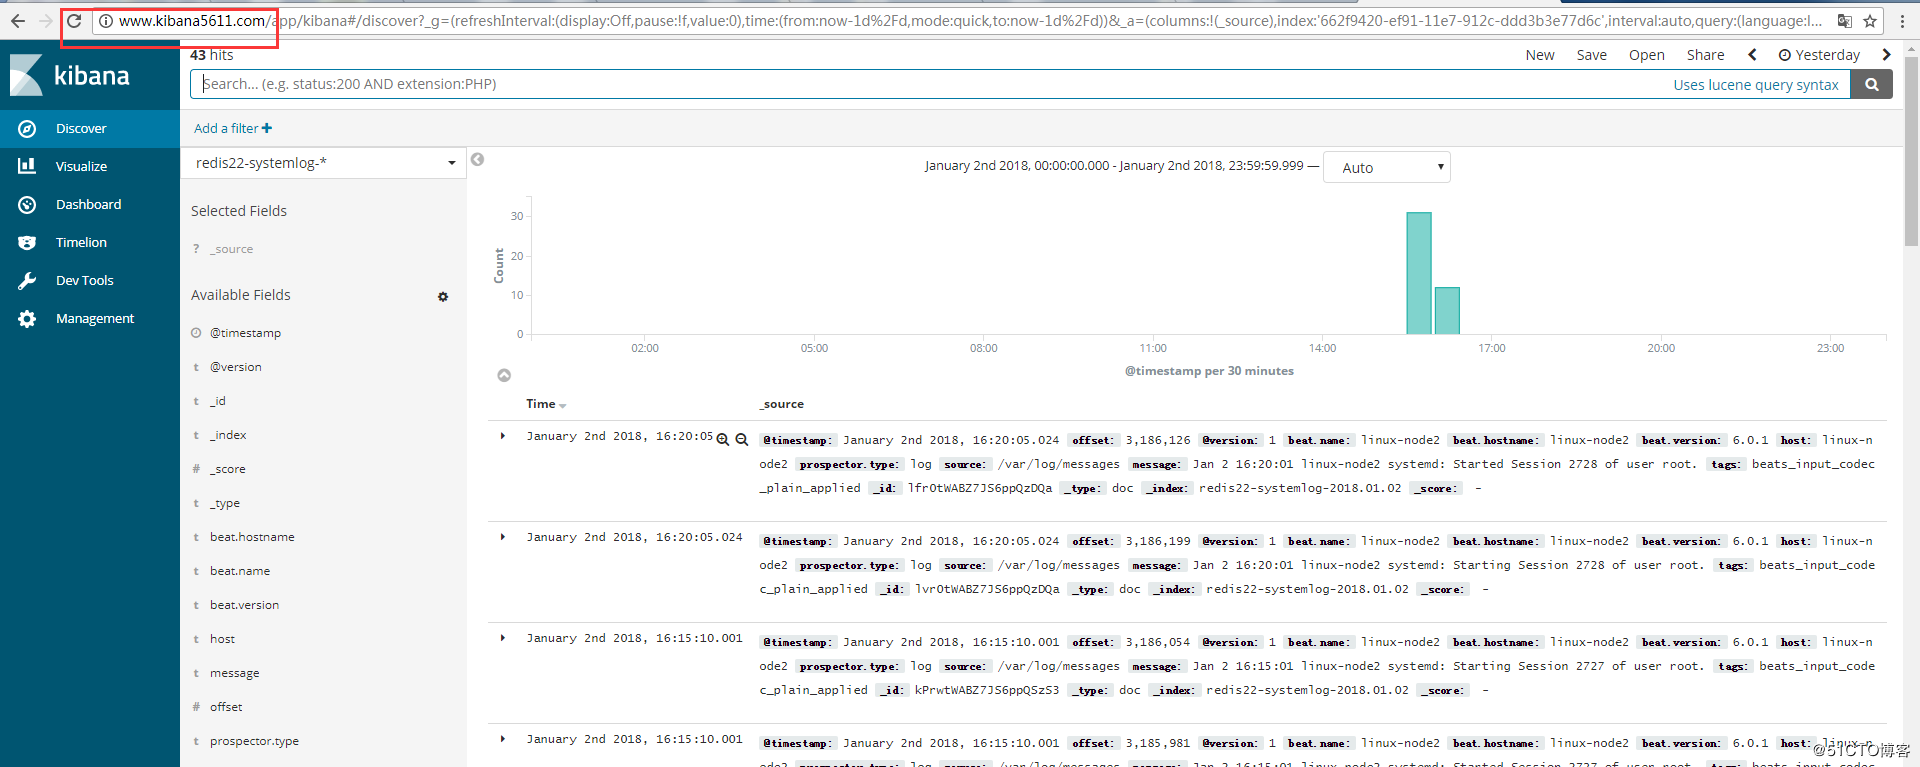
(3)浏览器访问
windows做hosts解析:192.168.56.11 www.kibana5611.com
浏览器访问:www.kibana5611.com
(4)配置密码验证登录
[root@linux-node1 ~]# yum install -y httpd-tools

[root@linux-node1 ~]# htpasswd -bc /etc/nginx/conf.d/htpasswd.users zhangshan

[root@linux-node1 ~]# ll /etc/nginx/conf.d/htpasswd.users

-rw-r--r--  root root  1月    : /etc/nginx/conf.d/htpasswd.users

[root@linux-node1 ~]# chown nginx.nginx /etc/nginx/conf.d/htpasswd.users

[root@linux-node1 ~]# vim /etc/nginx/nginx.conf

upstream kibana_server {

        server 127.0.0.1: weight= max_fails= fail_timeout=;

}

server {

        listen ;

        server_name www.kibana5611.com;

        auth_basic "Restricted Access";

        auth_basic_user_file /etc/nginx/conf.d/htpasswd.users;

        location / {

                proxy_pass http://kibana_server;

                proxy_http_version 1.1;

        }

}

[root@linux-node1 ~]# nginx -t

nginx: the configuration file /etc/nginx/nginx.conf syntax is ok

nginx: configuration file /etc/nginx/nginx.conf test is successful

[root@linux-node1 ~]# systemctl reload nginx

浏览器访问www.kibana5611.com会出现输入用户密码验证登录
ELKStack入门篇(五)之实用架构解析的更多相关文章
- 【SSRS】入门篇(五) -- 设置报表格式
原文:[SSRS]入门篇(五) -- 设置报表格式 在上一节 [SSRS]入门篇(四) -- 向报表添加数据 我们设置好了报表,并可以预览到数据,如下图: 当报表完成后,有个重要的工作就是美化报表格式 ...
- ELKStack入门篇(一)之ELK部署和使用
一.ELKStack简介 1.ELK介绍 中文指南:https://www.gitbook.com/book/chenryn/elk-stack-guide-cn/details ELK Stack包 ...
- ELKStack入门篇(二)之Nginx、Tomcat、Java日志收集以及TCP收集日志使用
1.收集Nginx的json格式日志 1.1.Nginx安装 [root@linux-node1 ~]# yum install nginx -y [root@linux-node1 ~]# vim ...
- 小迪安全 Web安全 基础入门 - 第五天 - 资产架构&端口&应用&CDN&WAF&站库分离&负载均衡
一.资产架构 1.Web单个源码指向安全,域名指向一个网站,网站对应一个程序.对应一个目录. 2.Web多个目录源码安全,搭建完一个网站后,在网站目录下搭建新的站点. 3.Web多个端口源码安全,与多 ...
- c++入门篇五
默认参数: //默认参数//函数的默认参数,参数后面有'='//函数参数注意事项,如有一个位置有了默认参数//那么从该位置的后面就必须要有参数 , ) { //b有默认参数,b的后面也应该要有默认参数 ...
- redis的入门篇---五种数据类型及基本操作
查看所有的key keys * 清空所有的key flushall 检查key是否存在 exists key 设置已存在的key的时长 expire key //设置key为10s 查看key还剩多少 ...
- ELKStack入门篇(四)之Filebeat
Filebeat是轻量级单用途的日志收集工具,用于在没有安装java的服务器上专门收集日志,可以将日志转发到logstash.elasticsearch或redis等场景中进行下一步处理. 官方文档: ...
- ELKStack入门篇(三)之logstash收集日志写入redis
1.部署Redis 1.1.下载redis [root@linux-node2 ~]# wget http://download.redis.io/releases/redis-4.0.6.tar.g ...
- spring boot入门篇
Spring Boot[快速入门] Spring Boot 概述 Build Anything with Spring Boot:Spring Boot is the starting point ...
随机推荐
- ZooKeeper学习之路 (四)ZooKeeper开发环境eclipse配置
一.eclipse中配置zookeeper开发环境 1)将zookeeper eclipse plugin中的6个jar包放到eclipse安装目录下的plugins文件中,重启eclipse (2) ...
- vector详讲(二)迭代器
先看一下代码: #include <iostream> #include <vector> int main() { std::vector<double> dou ...
- idea 注册码(2019)
MTW881U3Z5-eyJsaWNlbnNlSWQiOiJNVFc4ODFVM1o1IiwibGljZW5zZWVOYW1lIjoiTnNzIEltIiwiYXNzaWduZWVOYW1lIjoiI ...
- ASP.Net GridView 基础 绑定字段
通过以前的学习,我们实现了效果如下: 现在我想修改显示/隐藏部分列,有两种做法: 一.在配置数据源的时候不是有查询哪些字段的吗,去除不需要的字段,重新绑定. 二.就是直接编辑列 下面是分析每种字段类型 ...
- 获取URL链接正则
public static final String HTTP_PATTERN = "http://[a-zA-Z0-9\\.\\/\\-_]+";
- 1.高并发教程-基础篇-之nginx负载均衡的搭建
温馨提示:请不要盲目的进行横向扩展,优先考虑对单台服务器的性能优化,只有单台服务器的性能达到最优化之后,集群才会被最大的发挥作用. 一.架构图: 服务器准备:3台,ubuntu16.04系统maste ...
- Unity 游戏框架搭建 2018 (一) 架构、框架与 QFramework 简介
约定 还记得上版本的第二十四篇的约定嘛?现在出来履行啦~ 为什么要重制? 之前写的专栏都是按照心情写的,在最初的时候笔者什么都不懂,而且文章的发布是按照很随性的一个顺序.结果就是说,大家都看完了,都还 ...
- ES6读书笔记(二)
前言 前段时间整理了ES6的读书笔记:<ES6读书笔记(一)>,现在为第二篇,本篇内容包括: 一.数组扩展 二.对象扩展 三.函数扩展 四.Set和Map数据结构 五.Reflect 本文 ...
- canvas制作的烟花效果
最近感觉canvas挺有意思的,在业余时间没事研究了一下,参考过网上一些思路,话不多说,开始啦. github地址:https://github.com/aWhiteBear/fireworks 演示 ...
- Python 用hashlib。md5加密算法
廖雪峰的官方网站学习MD5加密,网址:“http://www.liaoxuefeng.com/wiki/001374738125095c955c1e6d8bb493182103fac9270762a0 ...