d3.js 教程 模仿echarts折线图
今天我们来仿echarts折线图,这个图在echarts是折线图堆叠,但是我用d3改造成了普通的折线图,只为了大家学习(其实在简单的写一个布局就可以)。废话不多说商行代码。
1 制作 Line 类
class Line {

    constructor() {

        this._width = 1100;

        this._height = 800;

        this._padding = 10;

        this._offset = 35;

        this._margins = {right: 50,bottom: 50,left: 70,top: 100};

        this._scaleX = d3.scaleBand().range([0, this.quadrantWidth()]).paddingInner(1).align(0);

        this._scaleY = d3.scaleLinear().range([this.quadrantHeight(), 0]);

        this._color = d3.scaleOrdinal(d3.schemeCategory10);

        this._dataX = [];

        this._series = [];

        this._svg = null;

        this._body = null;

        this._tooltip = null;

        this._transLine = null;

        this._activeR = 5;

        this._ticks = 5;

    }

    render() {

        if(!this._tooltip) {

            this._tooltip = d3.select('body')

            .append('div')

            .style('left', '40px')

            .style('top', '30px')

            .attr('class', 'tooltip')

            .html('');

        }

        if(!this._svg) {

            this._svg = d3.select('body')

                .append('svg')

                .attr('width', this._width)

                .attr('height', this._height)

                .style('background', '#f3f3f3')

            this.renderAxes();

            this.renderClipPath();

        }

        this.renderBody();

    }

    renderAxes() {

        let axes = this._svg.append('g')

            .attr('class', 'axes');

        this.renderXAxis(axes);

        this.renderYAxis(axes);

    }

    renderXAxis(axes) {

        let xAxis = d3.axisBottom().scale(this._scaleX).ticks(this._dataX.length);

        axes.append('g')

            .attr('class', 'x axis')

            .attr('transform', `translate(${this.xStart()}, ${this.yStart()})`)

            .call(xAxis)

        d3.selectAll('g.x .tick text')

            .data(this._dataX)

            .enter()

    }

    renderYAxis(axes) {

        let yAxis = d3.axisLeft().scale(this._scaleY).ticks(this._ticks);

        axes.append('g')

            .attr('class', 'y axis')

            .attr('transform', `translate(${this.xStart()}, ${this.yEnd()})`)

            .call(yAxis)

        d3.selectAll('.y .tick')

            .append('line')

            .attr('class', 'grid-line')

            .attr('x1', 0)

            .attr('y1', 0)

            .attr('x2', this.quadrantWidth())

            .attr('y2', 0)

    }

    renderClipPath() {

        this._svg.append('defs')

            .append('clipPath')

            .attr('id', 'body-clip')

            .append('rect')

            .attr('x', 0 - this._activeR - 1)

            .attr('y', 0)

            .attr('width', this.quadrantWidth() + (this._activeR + 1) * 2)

            .attr('height', this.quadrantHeight())

    }

    renderBody() {

        if(!this._body) {

            this._body = this._svg.append('g')

                .attr('class', 'body')

                .attr('transform', `translate(${this._margins.left},${this._margins.top})`)

                .attr('clip-path', 'url(#body-clip)')

            this.renderTransLine()

        }

        this.renderLines();

        this.renderDots();

        this.listenMousemove();

    }

    renderTransLine() {

        this._transLine = this._body.append('line')

            .attr('class', 'trans-line')

            .attr('x1', 0)

            .attr('y1', 0)

            .attr('x2', 0)

            .attr('y2', this._scaleY(0))

            .attr('stroke-opacity', 0)

    }

    renderLines() {

        let line = d3.line()

            .x((d,i) => this._scaleX(this._dataX[i]))

            .y(d => this._scaleY(d))

        let lineElements = this._body

            .selectAll('path.line')

            .data(this._series);

        let lineEnter =  lineElements

            .enter()

            .append('path')

            .attr('class', 'line')

            .attr('d', d => line(d.data.map(v => 0)))

            .attr('stroke', (d,i) => this._color(i))

        let lineUpdate = lineEnter

            .merge(lineElements)

            .transition()

            .duration(100)

            .ease(d3.easeCubicOut)

            .attr('d', d => line(d.data))

        let lineExit = lineElements

            .exit()

            .transition()

            .attr('d', d => line(d.data))

            .remove();

    }

    renderDots() {

        this._series.forEach((d,i) => {

            let dotElements = this._body

            .selectAll('circle._' + i)

            .data(d.data);

            let dotEnter =  dotElements

            .enter()

            .append('circle')

            .attr('class', (v, index) => 'dot _' + i + ' index_' + index)

            .attr('cx', (d,i) => this._scaleX(this._dataX[i]))

            .attr('cy', d => this._scaleY(d))

            .attr('r', 1e-6)

            .attr('stroke', (d,i) => this._color(i))

            let dotUpdate = dotEnter

            .merge(dotElements)

            .transition()

            .duration(100)

            .ease(d3.easeCubicOut)

            .attr('cx', (d,i) => this._scaleX(this._dataX[i]))

            .attr('cy', d => this._scaleY(d))

            .attr('r', 2)

            let dotExit = dotElements

            .exit()

            .transition()

            .attr('r', 0)

            .remove();

        })

        this._dataX.forEach((d,i) => {

            d3.selectAll('circle._' + i)

                .attr('stroke', this._color(i))

        })

    }

    listenMousemove() {

        this._svg.on('mousemove', () => {

            let px = d3.event.offsetX;

            let py = d3.event.offsetY;

            if(px < this.xEnd() && px > this.xStart() && py < this.yStart() && py > this.yEnd()) {

                this.renderTransLineAndTooltip(px, py, px - this.xStart());

            } else {

                this.hideTransLineAndTooltip();

            }

        })

    }

    renderTransLineAndTooltip(x, y, bodyX) {

        //鼠标悬浮的index

        let cutIndex = Math.floor((bodyX + this.everyWidth() / 2) / this.everyWidth());

        //提示线位置

        this._transLine.transition().duration(50).ease(d3.easeLinear).attr('x1', cutIndex * this.everyWidth()).attr('x2', cutIndex * this.everyWidth()).attr('stroke-opacity', 1);

        // dot圆圈动画

        d3.selectAll('circle.dot').transition().duration(100).ease(d3.easeCubicOut).attr('r', 2)

        d3.selectAll('circle.index_' + cutIndex).transition().duration(100).ease(d3.easeBounceOut).attr('r', this._activeR)

        //提示框位置和内容

        if(x > this.quadrantWidth() - this._tooltip.style('width').slice(0,-2) - this._padding * 2) {

            x = x - this._tooltip.style('width').slice(0,-2) - this._padding * 2 - this._offset * 2;

        }

        if(y > this.quadrantHeight() - this._tooltip.style('height').slice(0,-2) - this._padding * 2) {

            y = y - this._tooltip.style('height').slice(0,-2) - this._padding * 2 - this._offset * 2;

        }

        let str = `<div style="text-align: center">${this._dataX[cutIndex]}</div>`;

        this._series.forEach((d, i) => {

            str = str + `<div style="width: 15px;height: 15px;vertical-align: middle;margin-right: 5px;border-radius: 50%;display: inline-block;background: ${this._color(i)};"></div>${d.name}<span style="display: inline-block;margin-left: 20px">${d['data'][cutIndex]}</span><br/>`

        })

        this._tooltip.html(str).transition().duration(100).ease(d3.easeLinear).style('display', 'inline-block').style('opacity', .6).style('left', `${x + this._offset + this._padding}px`).style('top', `${y + this._offset + this._padding}px`);

    }

    hideTransLineAndTooltip() {

        this._transLine.transition().duration(50).ease(d3.easeLinear).attr('stroke-opacity', 0);

        d3.selectAll('circle.dot').transition().duration(100).ease(d3.easeCubicOut).attr('r', 2);

        this._tooltip.transition().duration(100).style('opacity', 0).on('end', function () {d3.select(this).style('display', 'none')});

    }

    everyWidth() {

        return this.quadrantWidth() / (this._dataX.length - 1);

    }

    quadrantWidth() {

        return this._width - this._margins.left - this._margins.right;

    }

    quadrantHeight() {

        return this._height - this._margins.top - this._margins.bottom;

    }

    xStart() {

        return this._margins.left;

    }

    xEnd() {

        return this._width - this._margins.right;

    }

    yStart() {

        return this._height - this._margins.bottom;

    }

    yEnd() {

        return this._margins.top;

    }

    scaleX(a) {

        this._scaleX = this._scaleX.domain(a);

    }

    scaleY(a) {

        this._scaleY = this._scaleY.domain(a)

    }

    selectMaxYNumber(arr) {

        let temp = [];

        arr.forEach(item => temp.push(...item.data));

        let max = d3.max(temp);

        let base = Math.pow(10, Math.floor(max / 4).toString().length - 1);

        //获取Y轴最大值

        return Math.floor(max / 4 / base) * 5 * base;

    }

    dataX(data) {

        if(!arguments.length) return this._dataX;

        this._dataX = data;

        this.scaleX(this._dataX);

        return this;

    }

    series(series) {

        if(!arguments.length) return this._series;

        this._series = series;

        let maxY = this.selectMaxYNumber(this._series);

        this.scaleY([0, maxY])

        return this;

    }

}
2 css 文件
.domain {

  stroke-width:;

  fill: none;

  stroke: #888;

  shape-rendering: crispEdges;

}

.tick text {

  font-size: 14px;

}

.grid-line {

  fill: none;

  stroke: #888;

  opacity: .4;

  shape-rendering: crispEdges;

}

.trans-line {

  fill: none;

  stroke: #666;

  opacity: .4;

}

.line {

  fill: none;

  stroke-width:;

}

.dot {

  fill: #fff;

}

.tooltip{

  font-size: 15px;

  width: auto;

  padding: 10px;

  height: auto;

  position: absolute;

  background-color: #000000;

  opacity: .6;

  border-radius:5px;

  color: #ffffff;

  display: none;

}
3 HTML 文件
<!DOCTYPE html>
<html lang="en">
<head>
<meta charset="UTF-8">
<title>$Title$</title>
<link rel="stylesheet" type="text/css" href="css/base.css"/>
<script type="text/javascript" src="js/d3.v4.js"></script>
<script type="text/javascript" src="js/line.js"></script>
</head>
<body>
<script>
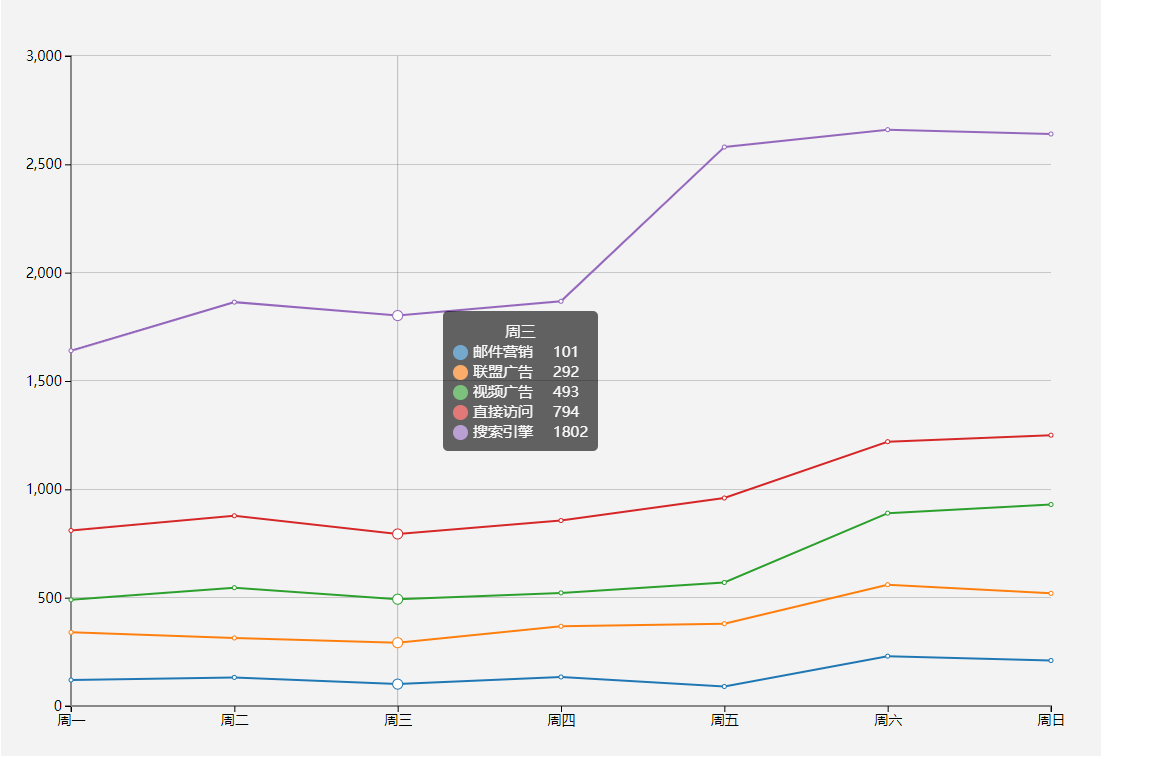
var dataX = ['周一', '周二', '周三', '周四', '周五', '周六', '周日'];
var series = [{name: '邮件营销', data:[120, 132, 101, 134, 90, 230, 210]},
{name: '联盟广告', data:[340, 314, 292, 368, 380, 560, 520]},
{name: '视频广告', data:[490, 546, 493, 522, 570, 890, 930]},
{name: '直接访问', data:[810, 878, 794, 856, 960, 1220, 1250]},
{name: '搜索引擎', data:[1640, 1864, 1802, 1868, 2580, 2660, 2640]}]
var line = new Line();
line
.dataX(dataX)
.series(series)
.render()
setInterval(() => {
series = series.map((d,i) => {
return {
name: d.name,
data: new Array(7).fill(1).map((dd, ii) => {
return Math.floor(Math.random() * 200) + i * 200
})
}
})
console.log(series);
line
.dataX(dataX)
.series(series)
.render()
}, 4000)
</script>
</body>
</html>
想预览和下载demo的朋友可以移步原文
原文地址 http://www.bettersmile.cn
d3.js 教程 模仿echarts折线图的更多相关文章
- d3.js 教程 模仿echarts柱状图
由于最近工作不是很忙,隧由把之前的charts项目用d3.js重写的一下,其实d3.js文档很多,但是入门不是很难,可是想真的能做一个完成的,交互良好的图还是要下一番功夫的.今天在echarts找到了 ...
- d3.js 教程 模仿echarts legend功能
上一节记录没有加上echarts的legend功能,这一小节补一下. 1. 数据 我们可以从echarts中看出,折线数据并不是我们传进入的原始数据(多数情况下我们也不会修改原始数据),而是原始数组的 ...
- 【D3.js】Focus + Context 折线图
利用D3.js库实现Focus+Context的折线图.读取data.tsv文件数据 index.html <!DOCTYPE html> <meta charset="u ...
- vue使用axios读取本地json文件来显示echarts折线图
编辑器:HBuilderx axios文档:http://www.axios-js.com/zh-cn/docs/ echarts实例:https://echarts.apache.org/examp ...
- 实现Echarts折线图的虚实转换
需求:医院的体温单,在统计体温时,对于正常情况下统计的体温数据,需要显示实线:对于进行物理降温后统计的体温数据,需要显示虚线. 现有的体温单是运用 Echarts 折线图,统一用实线显示.因此在这基础 ...
- echarts折线图动态改变数据时的一个bug
echarts折线图中当增加dataZoom,修改start大于0的时候,会出现折线混乱,变成竖直的线,绘制有问题. 解决方法,在dataZoom中增加filterMode: 'empty' http ...
- ECharts折线图堆叠设置为不堆叠的方法
下图是ECharts折线图堆叠的官方源码,设置折线图不堆叠只需要将每一个stack的值设置为不一样的名称或者将stack属性删除即可. option = { title: { text: '折线图堆叠 ...
- echarts折线图,数据切换时(最近七天)绘图不合理现象
echarts折线图,当进行数据切换时存在绘制不合理的问题,数据没错,但绘制不对. 两个0之间的连线应该是平滑直线,如图: 正确的显示: 解决: 在myCharts.setOption(option) ...
- echarts折线图--数据交互
<!DOCTYPE html> <html> <head lang="en"> <meta charset="UTF-8&quo ...
随机推荐
- 多进程使用同一log4j配置导致的日志丢失与覆盖问题
最近接手了一个流传很多手的魔性古早代码,追日志时发现有明显缺失.对log4j不熟,不过可以猜测日志出问题肯定和多进程使用同一个log4j配置有关.经多次排查,终于捋清了其中逻辑.本文对排查过程进行复盘 ...
- https揭秘
首先简要说明一下所谓的https证书是什么东西:打个比方,你第一次去银行办理业务的时候都需要手持本人身份中去办理业务,这个身份证从哪里来呢,没错,是从国家相关机关得来的,在中国内是通用的,类比到htt ...
- 【JavaEE】之MyBatis查询缓存
为了减轻数据压力,提高数据库的性能,我们往往会需要使用缓存.MyBatis为我们提供了一级缓存和二级缓存. (1)一级缓存是SqlSession级别的缓存,在操作数据库的时候需要创建一个SqlSess ...
- 堆的python实现及其应用
堆的概念 优先队列(priority queue)是一种特殊的队列,取出元素的顺序是按照元素的优先权(关键字)大小,而不是进入队列的顺序,堆就是一种优先队列的实现.堆一般是由数组实现的,逻辑上堆可以被 ...
- ++a与a++、--a与a--
++a 与 a++ public class Demo { public static void main(String[] args) { int a = 1; System.out.println ...
- MySQL主从扩展知识
6月29/7月2日任务 说明:这两天无新课,主要是扩充知识面注意:这两天的任务,需要回专贴.需要你们通过看这些东西总结成自己的心得. 不能照搬,必须要自己理解,能看多少就看多少,看不完也没有关系,但一 ...
- js中的宏任务与微任务
如果你已经知道了js中存在宏任务和微任务,那么你一定已经了解过promise了.因为在js中promise是微任务的一个入口. 先来看一道题: setTimeout(function(){ conso ...
- 如何运用DDD - 领域服务
目录 如何运用DDD - 领域服务 概述 什么是领域服务 从实际场景下手 更贴近现实 领域服务VS应用服务 扩展上面的需求 最常见的认证授权是领域服务吗 使用领域服务 不要过多的使用领域服务 不要将过 ...
- mac install: /usr/bin/unrar: Operation not permitted
按照教程mac下解压缩rar文件工具-rarosx(免费),在mac上安装rar,在执行命令 sudo install -c -o $USER unrar /bin 出现错误:install: /bi ...
- luogu P3572 [POI2014]PTA-Little Bird |单调队列
从1开始,跳到比当前矮的不消耗体力,否则消耗一点体力,每次询问有一个步伐限制,求每次最少耗费多少体力 #include<cstdio> #include<cstring> #i ...