Prometheus自定义指标
1. 自定义指标
为了注册自定义指标,请将MeterRegistry注入到组件中,例如:
public class Dictionary {

    private final List<String> words = new CopyOnWriteArrayList<>();

    Dictionary(MeterRegistry registry) {

        registry.gaugeCollectionSize("dictionary.size", Tags.empty(), this.words);

    }

    // ...

}
如果你的指标依赖于其它bean,那么推荐使用MeterBinder注册这些指标,例如:
@Bean

MeterBinder queueSize(Queue queue) {

    return (registry) -> Gauge.builder("queueSize", queue::size).register(registry);

}
使用MeterBinder可以确保设置正确的依赖关系,并且在检索指标的值时bean是可用的。默认情况下,来自所有MeterBinder bean的指标将自动绑定到Spring管理的MeterRegistry。如果您发现在组件或应用程序之间重复检测一个指标,那么MeterBinder实现也会很有用。
文档参见

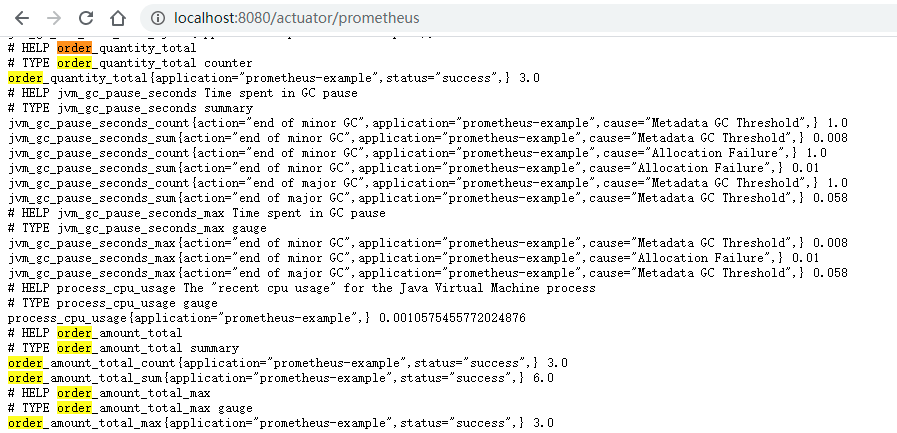
接下来,还是用之前的prometheus-example那个例子,我们来自定义业务指标
重新回顾一下
依赖
<dependency>

    <groupId>org.springframework.boot</groupId>

    <artifactId>spring-boot-starter-actuator</artifactId>

</dependency>

<dependency>

    <groupId>io.micrometer</groupId>

    <artifactId>micrometer-registry-prometheus</artifactId>

    <scope>runtime</scope>

</dependency>
application.yml
spring:

  application:

    name: prometheus-example

management:

  endpoints:

    web:

      exposure:

        include: "*"

  metrics:

    tags:

      application: ${spring.application.name}
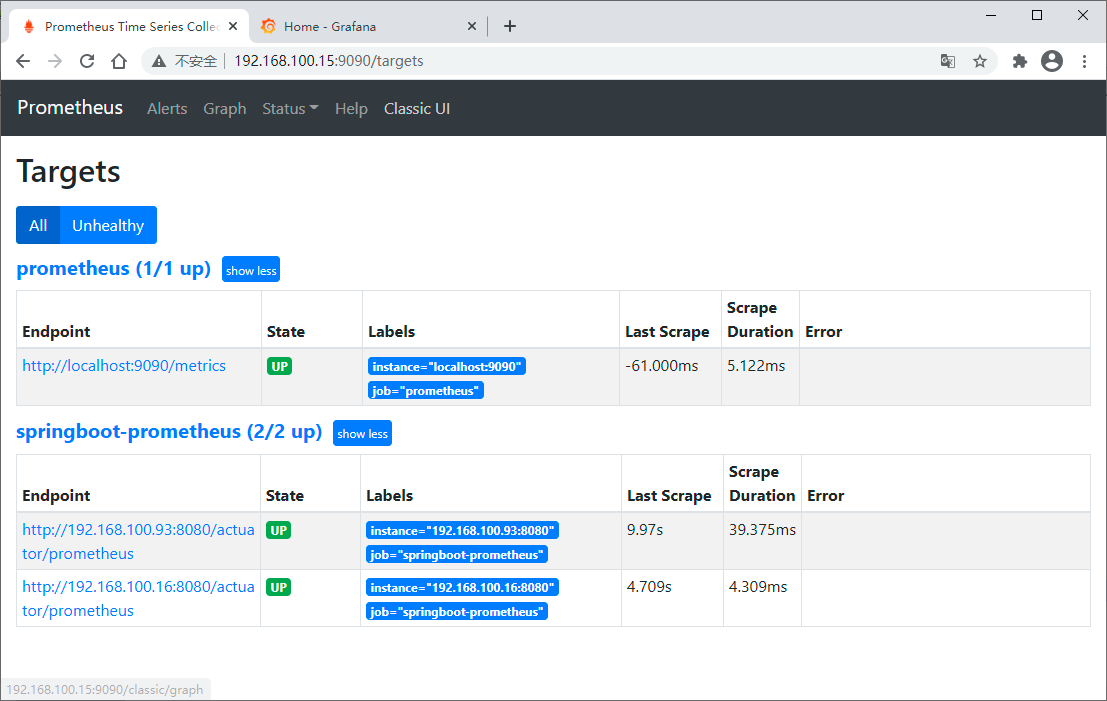
prometheus.yml
scrape_configs:

  - job_name: 'springboot-prometheus'

    metrics_path: '/actuator/prometheus'

    static_configs:

      - targets: ['192.168.100.93:8080','192.168.100.16:8080']
启动项目
# 启动Prometheus

./prometheus --config.file=prometheus.yml

# 启动Grafana

bin/grafana-server web
下面改造一下,新增一个AOP来模拟记录订单相关指标
package com.cjs.example.aop;

import com.cjs.example.domain.OrderVO;

import io.micrometer.core.instrument.Counter;

import io.micrometer.core.instrument.DistributionSummary;

import io.micrometer.core.instrument.MeterRegistry;

import org.aspectj.lang.ProceedingJoinPoint;

import org.aspectj.lang.annotation.Around;

import org.aspectj.lang.annotation.Aspect;

import org.aspectj.lang.annotation.Pointcut;

import org.springframework.stereotype.Component;

import javax.annotation.PostConstruct;

/**

 * @author ChengJianSheng

 * @since 2021/3/8

 */

@Aspect

@Component

public class OrderAspect {

    private Counter orderCounter;

    private DistributionSummary orderSummary;

    public OrderAspect(MeterRegistry registry) {

        orderCounter = registry.counter("order_quantity_total", "status", "success");

        orderSummary = registry.summary("order_amount_total", "status", "success");

    }

//    @PostConstruct

//    public void init() {

//

//    }

    @Pointcut("execution(public * com.cjs.example.controller.OrderController.createOrder(..))")

    public void pointcut() {

    }

    @Around("pointcut()")

    public Object doAround(ProceedingJoinPoint pjp) throws Throwable {

        Object result = pjp.proceed();

        OrderVO orderVO = (OrderVO) result;

        orderCounter.increment();

        orderSummary.record(orderVO.getAmount().doubleValue());

        return result;

    }

}

项目结构如图
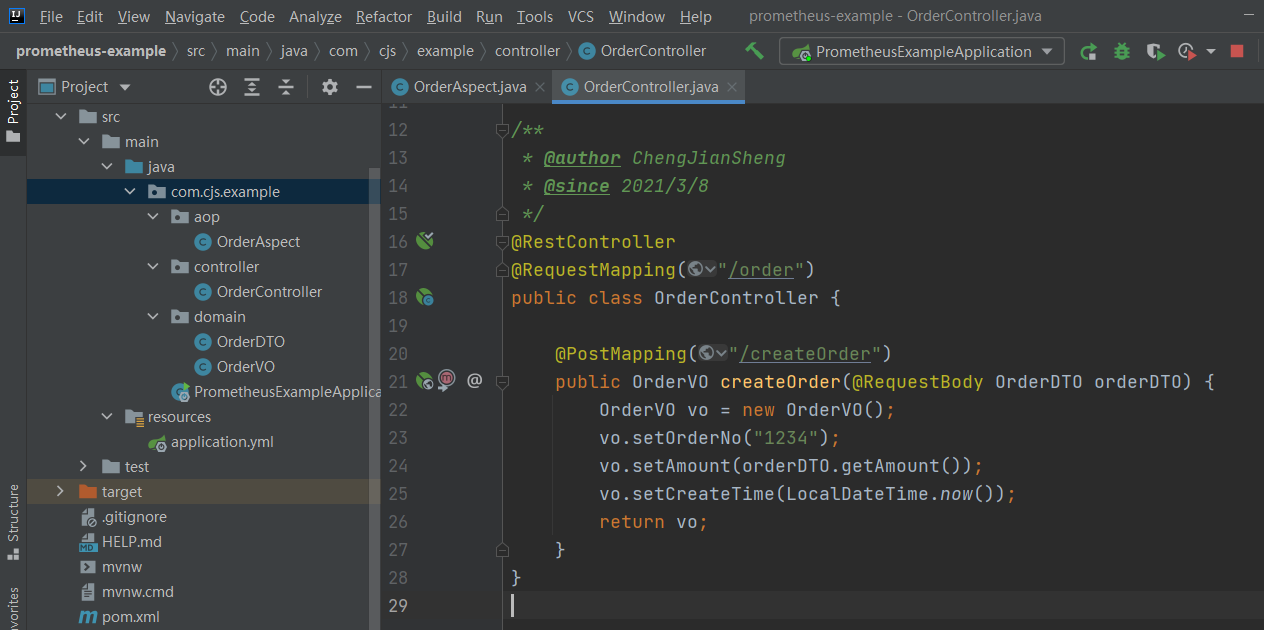
用postman造几条数据
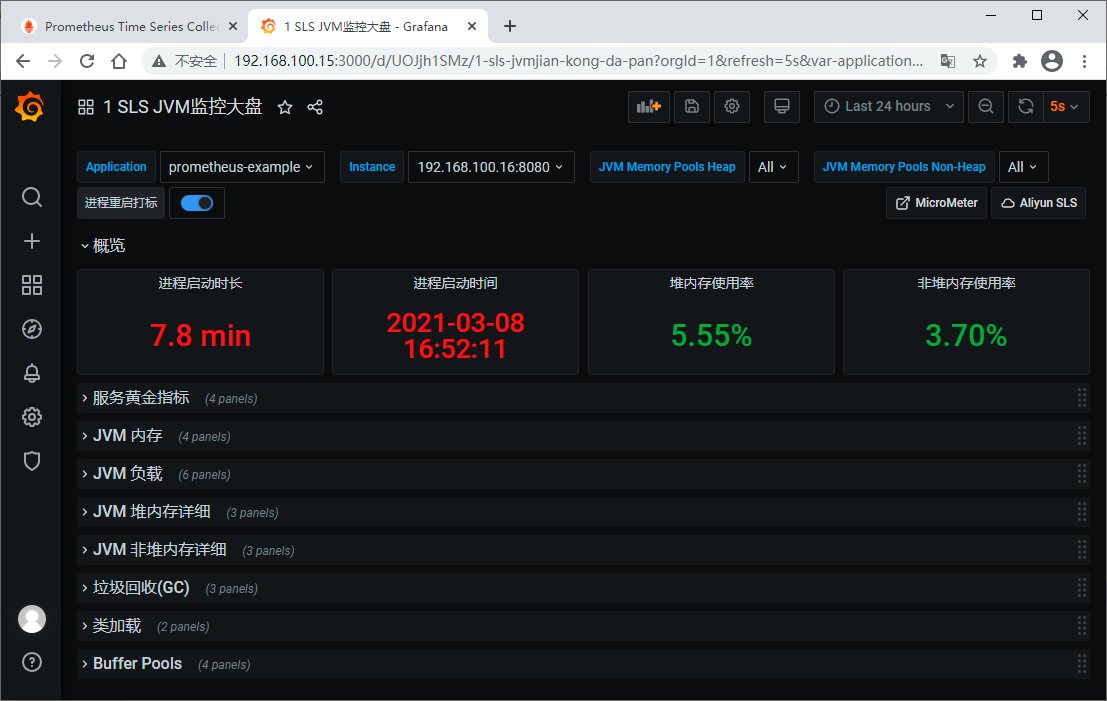
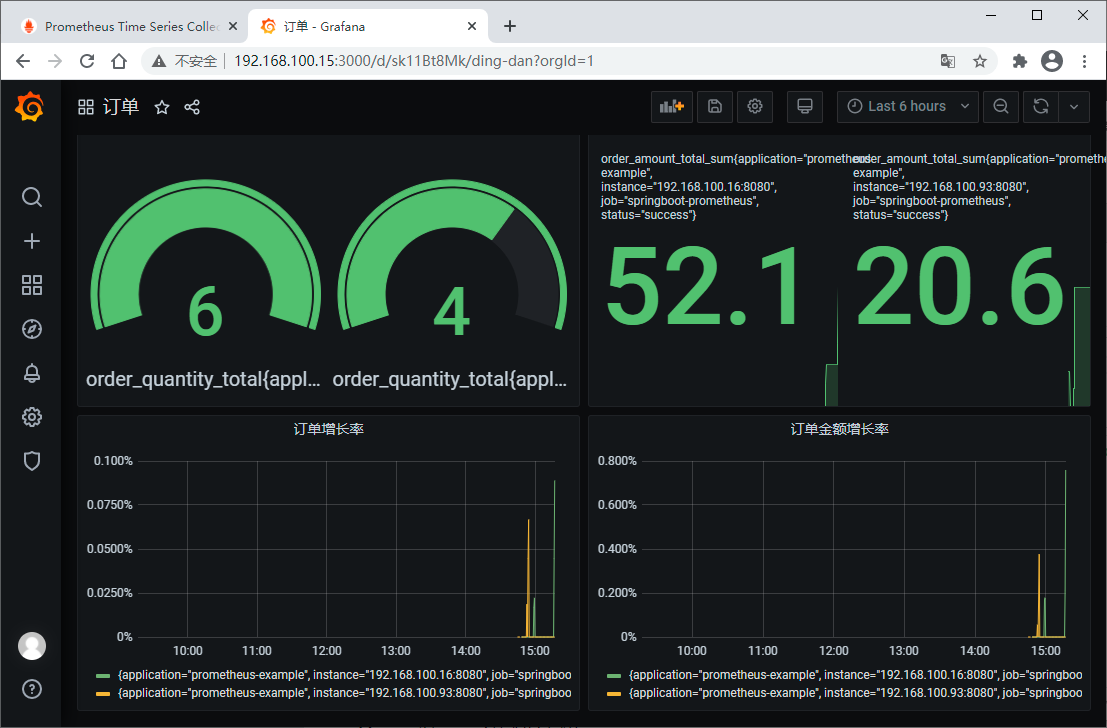
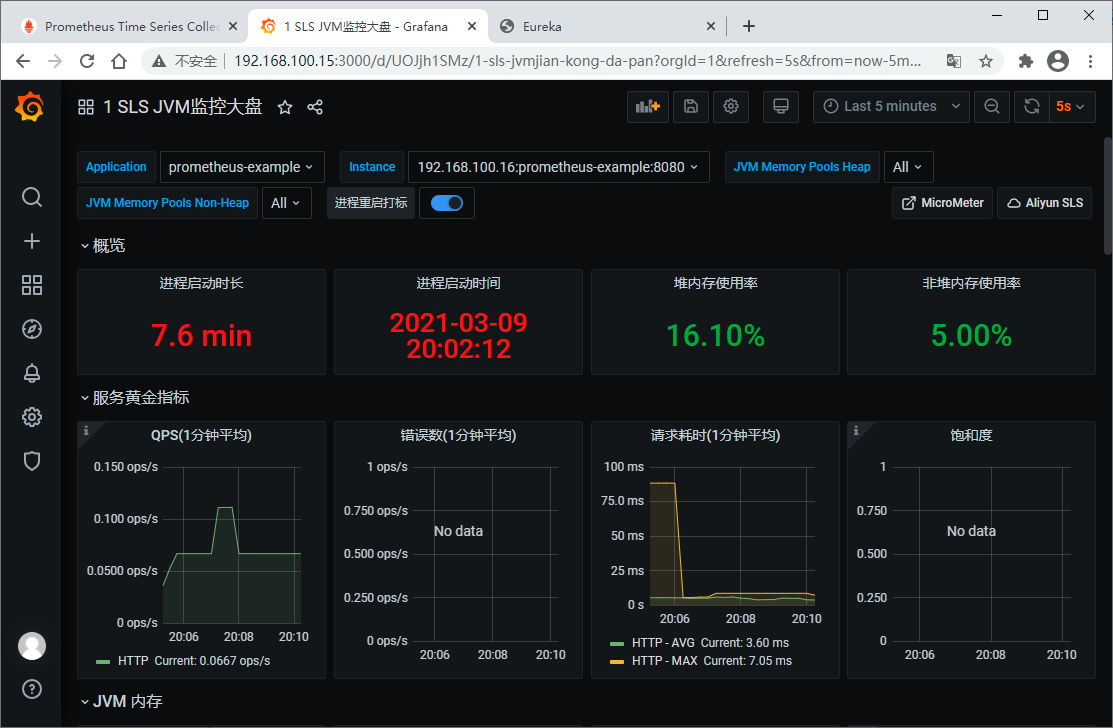
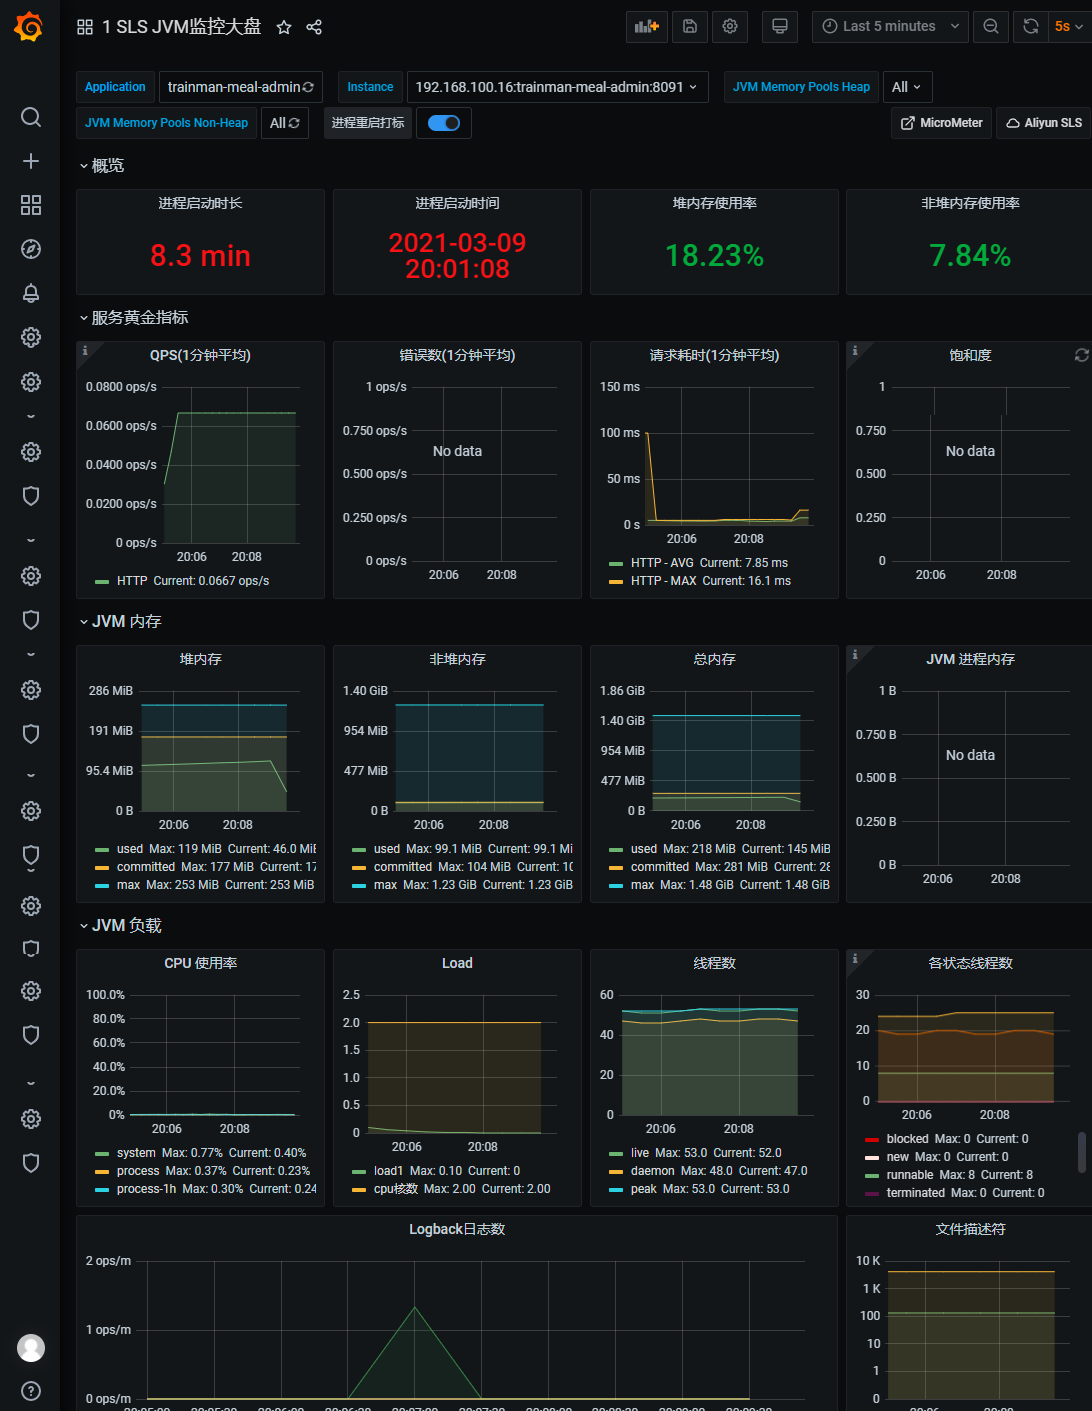
为了好看,我们在Grafana上创建一个dashboard,其中包含4个面板,对应四个指标
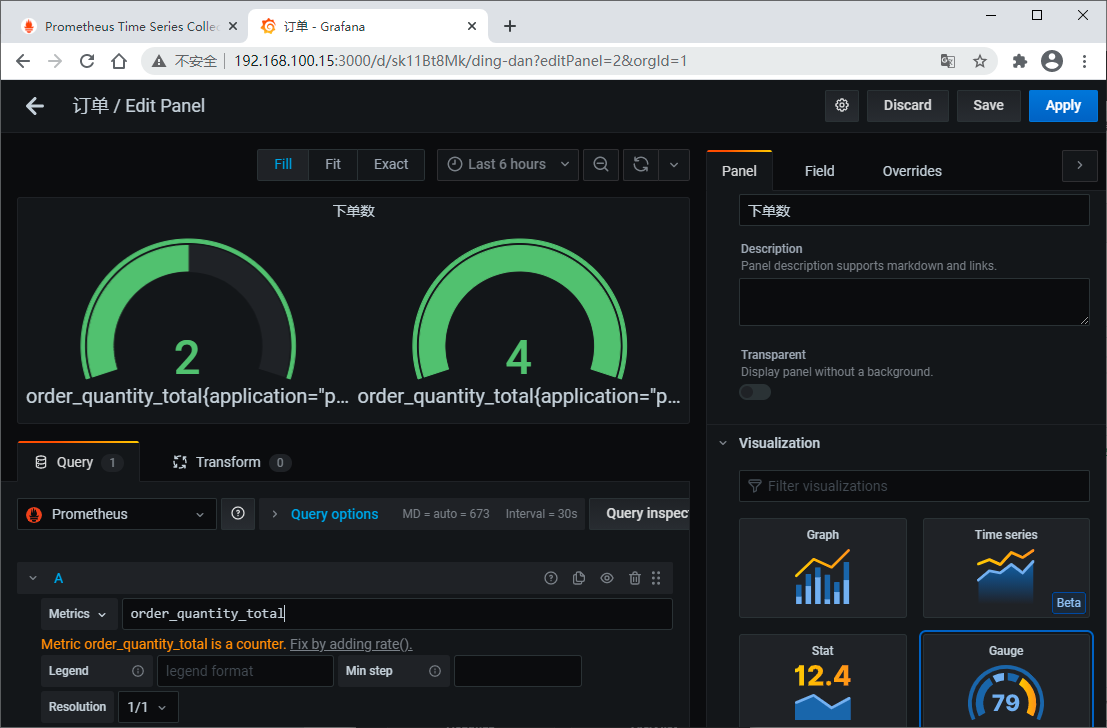
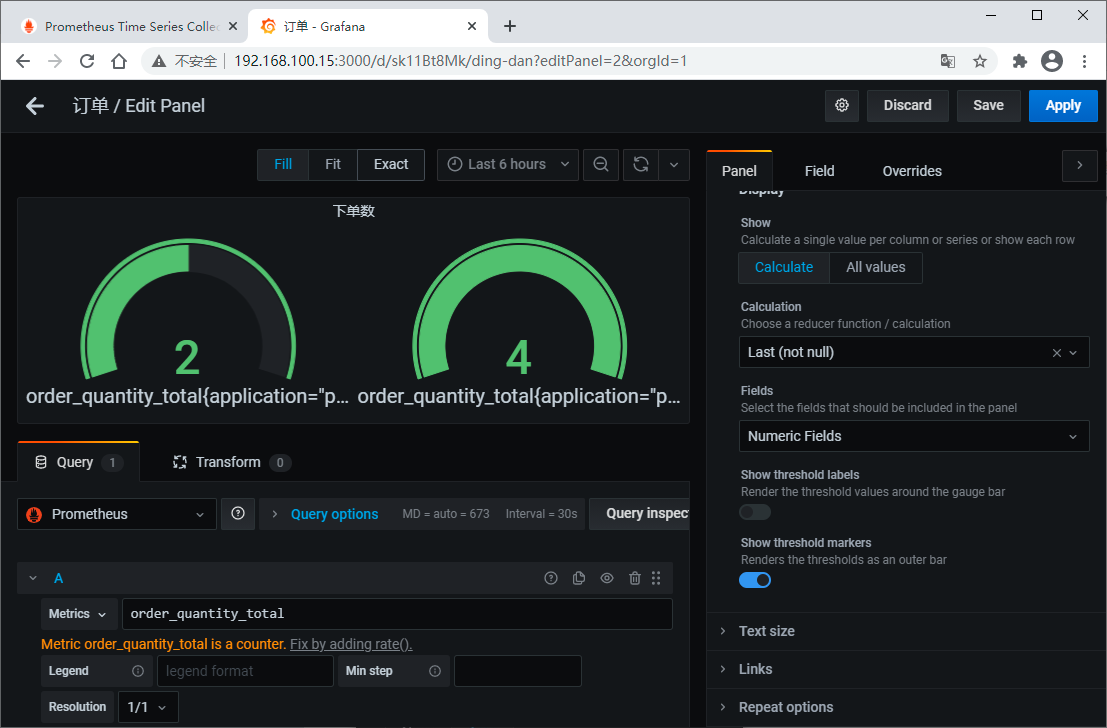
输入指标、设置名称、选择视图、设置属性
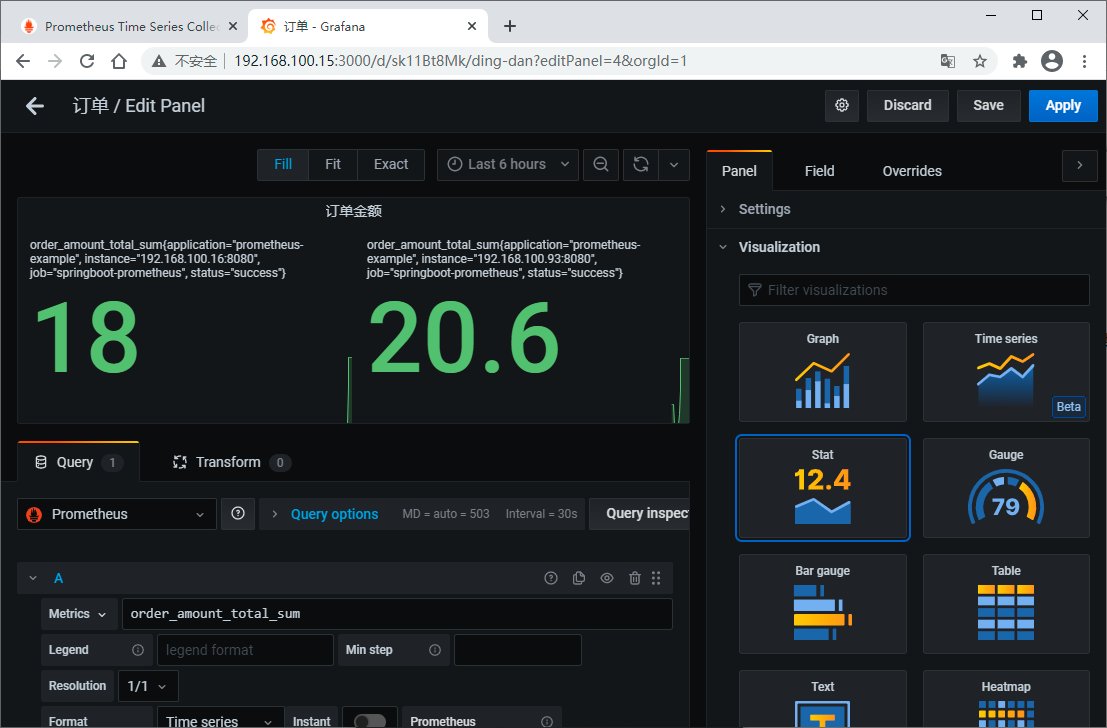
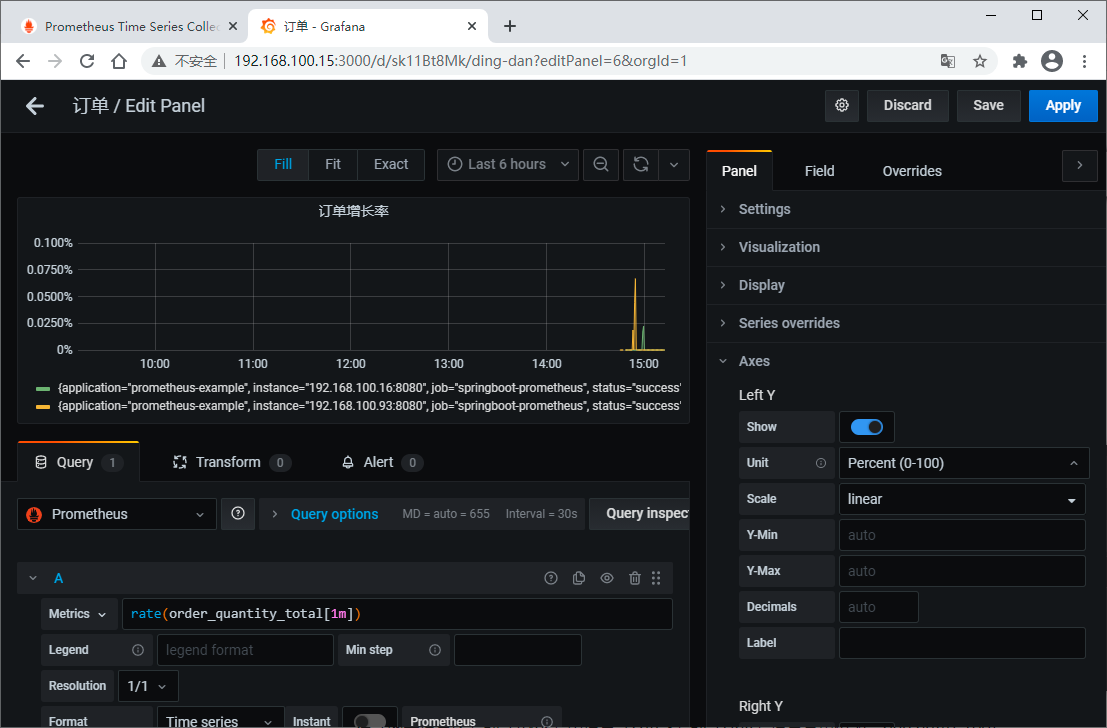
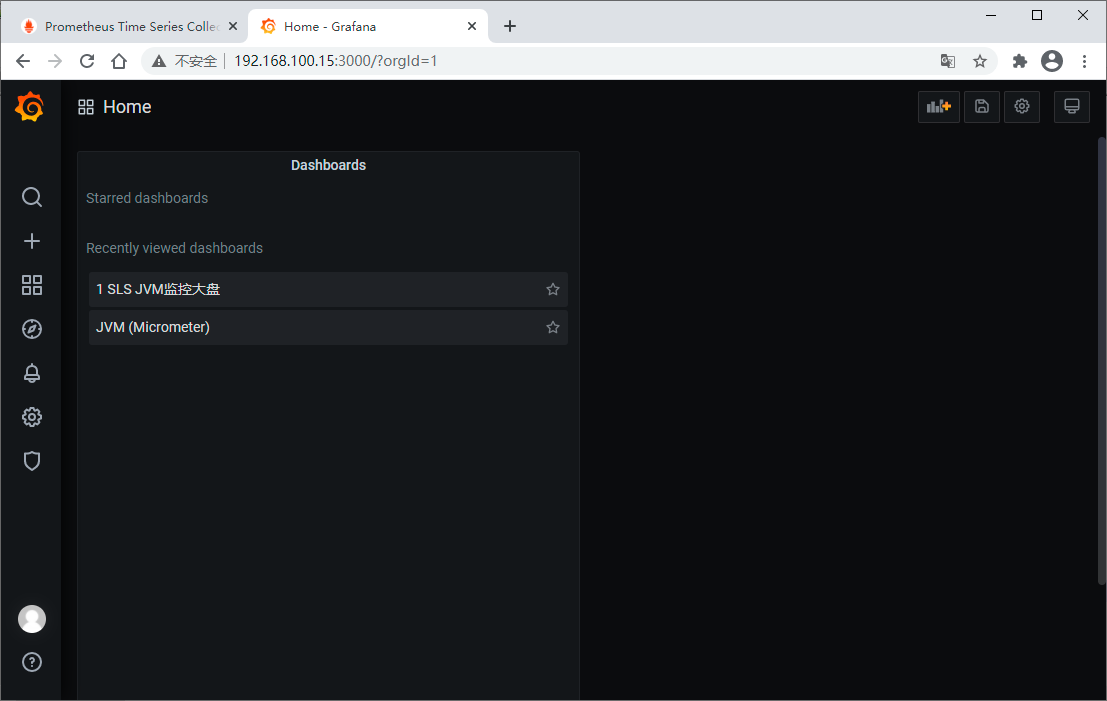
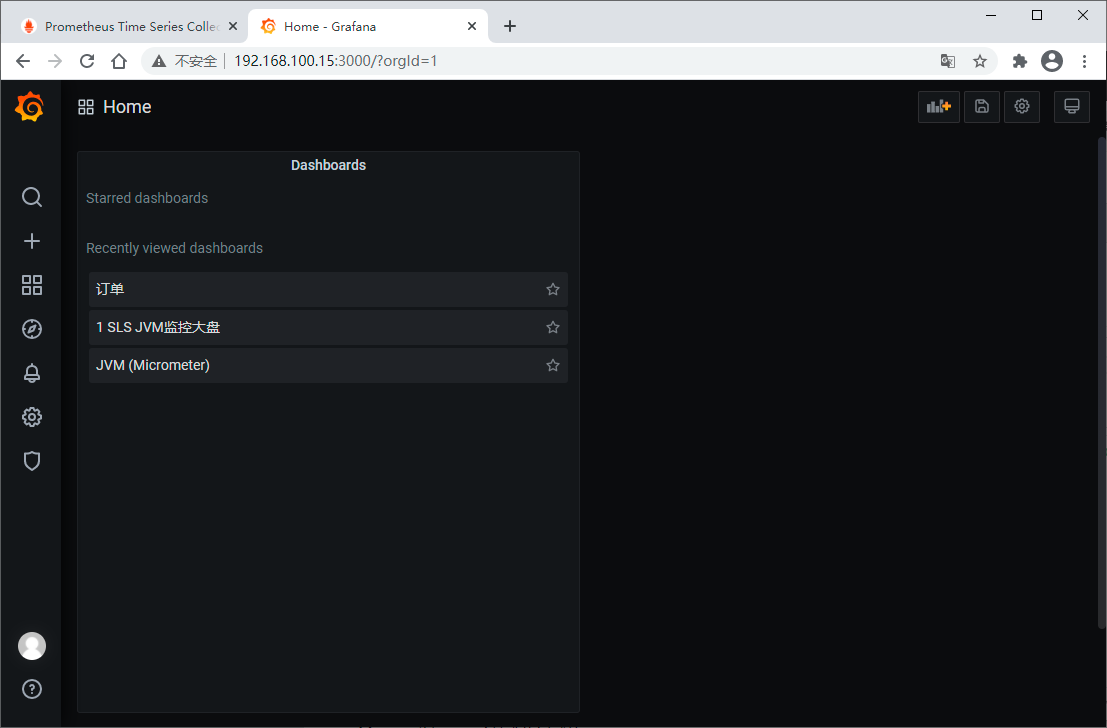
最后,记得保存。现在,我们有三个仪表盘了
2. 自动发现抓取目标
在实际项目中,我们不可能一个一个手动的配置要抓取的目标,每次都去修改prometheus.yml文件,然后再重启服务,想都不要想,不可能这么做。
为此,我们需要动态发现目标。Prometheus支持很多的服务发现配置,比如:zookeeper、eureka、kubernetes等等
详见 https://prometheus.io/docs/prometheus/latest/configuration/configuration/#scrape_config
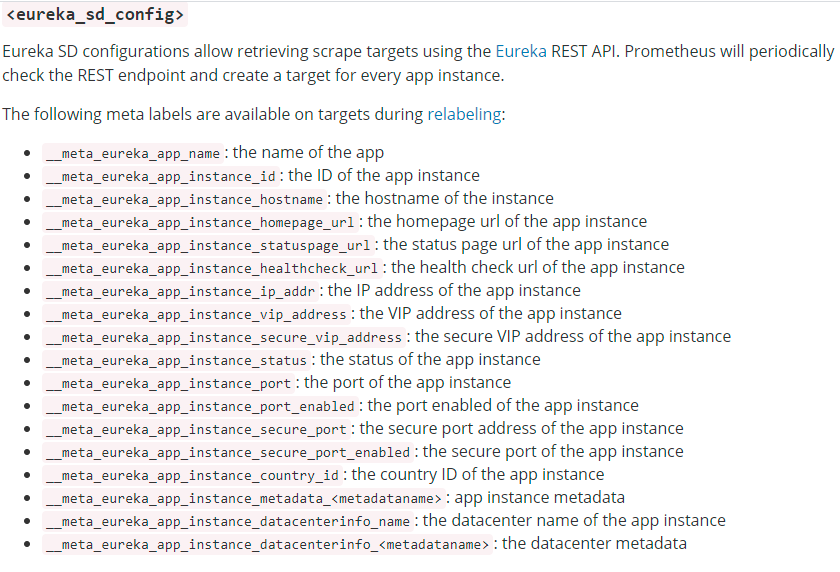
这里以Eureka为例,看看Prometheus如何从eureka中动态发现服务
https://prometheus.io/docs/prometheus/latest/configuration/configuration/#eureka_sd_config
https://prometheus.io/docs/prometheus/latest/configuration/configuration/#relabel_config
首先,我们创建一个项目当Eureka Server,并启动它
pom.xml
<?xml version="1.0" encoding="UTF-8"?>

<project xmlns="http://maven.apache.org/POM/4.0.0" xmlns:xsi="http://www.w3.org/2001/XMLSchema-instance"

         xsi:schemaLocation="http://maven.apache.org/POM/4.0.0 https://maven.apache.org/xsd/maven-4.0.0.xsd">

    <modelVersion>4.0.0</modelVersion>

    <parent>

        <groupId>org.springframework.boot</groupId>

        <artifactId>spring-boot-starter-parent</artifactId>

        <version>2.4.3</version>

        <relativePath/> <!-- lookup parent from repository -->

    </parent>

    <groupId>com.example</groupId>

    <artifactId>eureka-server</artifactId>

    <version>0.0.1-SNAPSHOT</version>

    <name>eureka-server</name>

    <properties>

        <java.version>1.8</java.version>

        <spring-cloud.version>2020.0.1</spring-cloud.version>

    </properties>

    <dependencies>

        <dependency>

            <groupId>org.springframework.cloud</groupId>

            <artifactId>spring-cloud-starter-netflix-eureka-server</artifactId>

        </dependency>

    </dependencies>

    <dependencyManagement>

        <dependencies>

            <dependency>

                <groupId>org.springframework.cloud</groupId>

                <artifactId>spring-cloud-dependencies</artifactId>

                <version>${spring-cloud.version}</version>

                <type>pom</type>

                <scope>import</scope>

            </dependency>

        </dependencies>

    </dependencyManagement>

    <build>

        <plugins>

            <plugin>

                <groupId>org.springframework.boot</groupId>

                <artifactId>spring-boot-maven-plugin</artifactId>

            </plugin>

        </plugins>

    </build>

</project>
application.yml
server:

  port: 8761

eureka:

  instance:

    hostname: localhost

  client:

    registerWithEureka: false

fetchRegistry: false

serviceUrl:

      defaultZone: http://${eureka.instance.hostname}:${server.port}/eureka/
启动类上加@EnableEurekaServer
eureka server 启动以后,接下来,我们改造一下刚才的项目prometheus-example
首先引入eureka client,这样的话完成的pom.xml就变成这样了
<?xml version="1.0" encoding="UTF-8"?>

<project xmlns="http://maven.apache.org/POM/4.0.0" xmlns:xsi="http://www.w3.org/2001/XMLSchema-instance"

         xsi:schemaLocation="http://maven.apache.org/POM/4.0.0 https://maven.apache.org/xsd/maven-4.0.0.xsd">

    <modelVersion>4.0.0</modelVersion>

    <parent>

        <groupId>org.springframework.boot</groupId>

        <artifactId>spring-boot-starter-parent</artifactId>

        <version>2.4.3</version>

        <relativePath/> <!-- lookup parent from repository -->

    </parent>

    <groupId>com.cjs.example</groupId>

    <artifactId>prometheus-example</artifactId>

    <version>0.0.1-SNAPSHOT</version>

    <name>prometheus-example</name>

    <description>Demo project for Spring Boot</description>

    <properties>

        <java.version>1.8</java.version>

        <spring-cloud.version>2020.0.1</spring-cloud.version>

    </properties>

    <dependencies>

        <dependency>

            <groupId>org.springframework.boot</groupId>

            <artifactId>spring-boot-starter-actuator</artifactId>

        </dependency>

        <dependency>

            <groupId>org.springframework.boot</groupId>

            <artifactId>spring-boot-starter-web</artifactId>

        </dependency>

        <dependency>

            <groupId>org.springframework.cloud</groupId>

            <artifactId>spring-cloud-starter-netflix-eureka-client</artifactId>

        </dependency>

        <dependency>

            <groupId>io.micrometer</groupId>

            <artifactId>micrometer-registry-prometheus</artifactId>

            <scope>runtime</scope>

        </dependency>

        <dependency>

            <groupId>org.projectlombok</groupId>

            <artifactId>lombok</artifactId>

            <optional>true</optional>

        </dependency>

        <dependency>

            <groupId>org.aspectj</groupId>

            <artifactId>aspectjweaver</artifactId>

            <version>1.9.6</version>

        </dependency>

    </dependencies>

    <dependencyManagement>

        <dependencies>

            <dependency>

                <groupId>org.springframework.cloud</groupId>

                <artifactId>spring-cloud-dependencies</artifactId>

                <version>${spring-cloud.version}</version>

                <type>pom</type>

                <scope>import</scope>

            </dependency>

        </dependencies>

    </dependencyManagement>

    <build>

        <plugins>

            <plugin>

                <groupId>org.springframework.boot</groupId>

                <artifactId>spring-boot-maven-plugin</artifactId>

            </plugin>

        </plugins>

    </build>

</project>
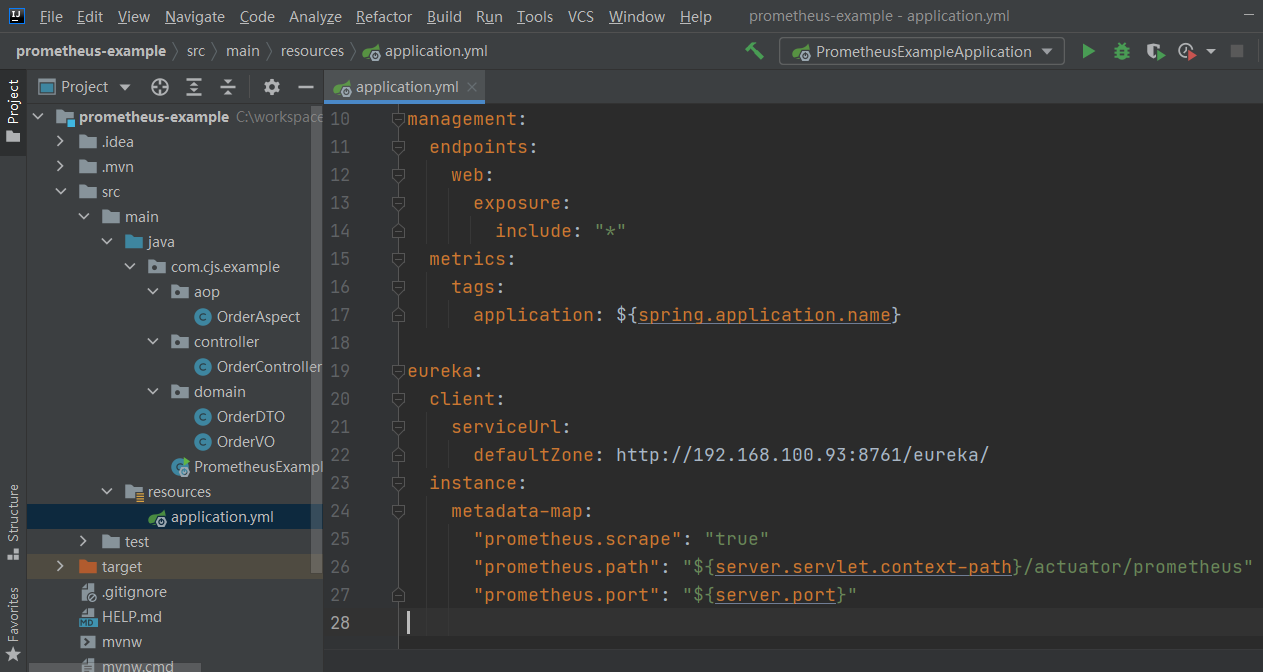
修改application.yml
这里有个地方要注意,原来我们没有加上下文路径(server.servlet.context-path),但是一般项目是会设置的,所以这次我们也加上。
完整的配置如下:
server:

  port: 8080

  servlet:

    context-path: /hello

spring:

  application:

    name: prometheus-example

management:

  endpoints:

    web:

      exposure:

        include: "*"

  metrics:

    tags:

      application: ${spring.application.name}

eureka:

  client:

    serviceUrl:

      defaultZone: http://192.168.100.93:8761/eureka/

  instance:

    metadata-map:

      "prometheus.scrape": "true"

      "prometheus.path": "${server.servlet.context-path}/actuator/prometheus"

      "prometheus.port": "${server.port}"
注意:
1、加了server.servlet.context-path以后,抓取的路径就不再是 http://192.168.100.93:8080/actuator/prometheus了,而是变成了 http://192.168.100.93:8080/hello/actuator/prometheus了。之前我们prometheus.yml文件里静态配置抓取目标的metrics_path是/actuator/prometheus,但是现在不能这样写了,因为加了应用上下文路径,而且每个服务都不一样。
2、为了能够根据各服务动态自定义指标路径(metrics_path),最最重要的是下面这三行
eureka:

  instance:

    metadata-map:

      "prometheus.scrape": "true"

      "prometheus.path": "${server.servlet.context-path}/actuator/prometheus"

      "prometheus.port": "${server.port}"
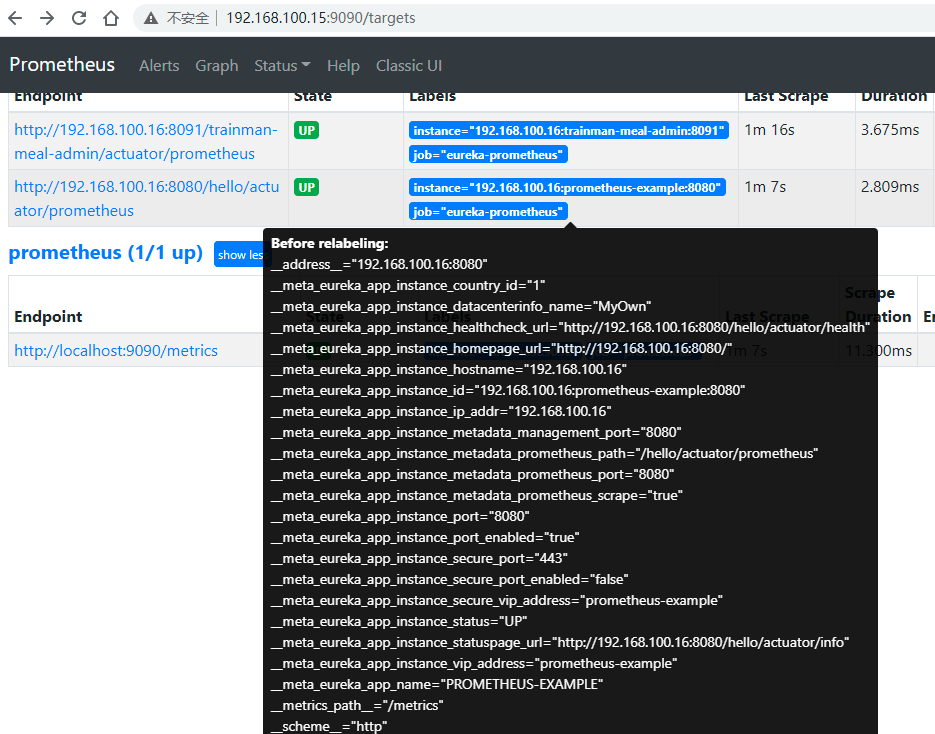
prometheus是通过eureka发现服务的,因此只有将服务的指标路径(抓取地址)写到eureka里,prometheus才能拿到
换言之,只有服务在注册的时候,将自己暴露的端点(endpoint)以元数据的方式写到eureka中prometheus才能正确的从目标抓取数据
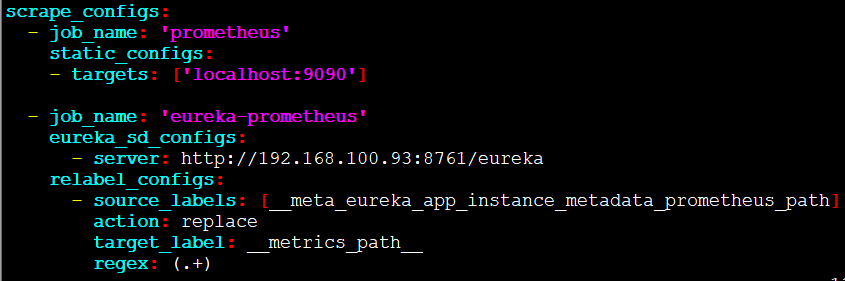
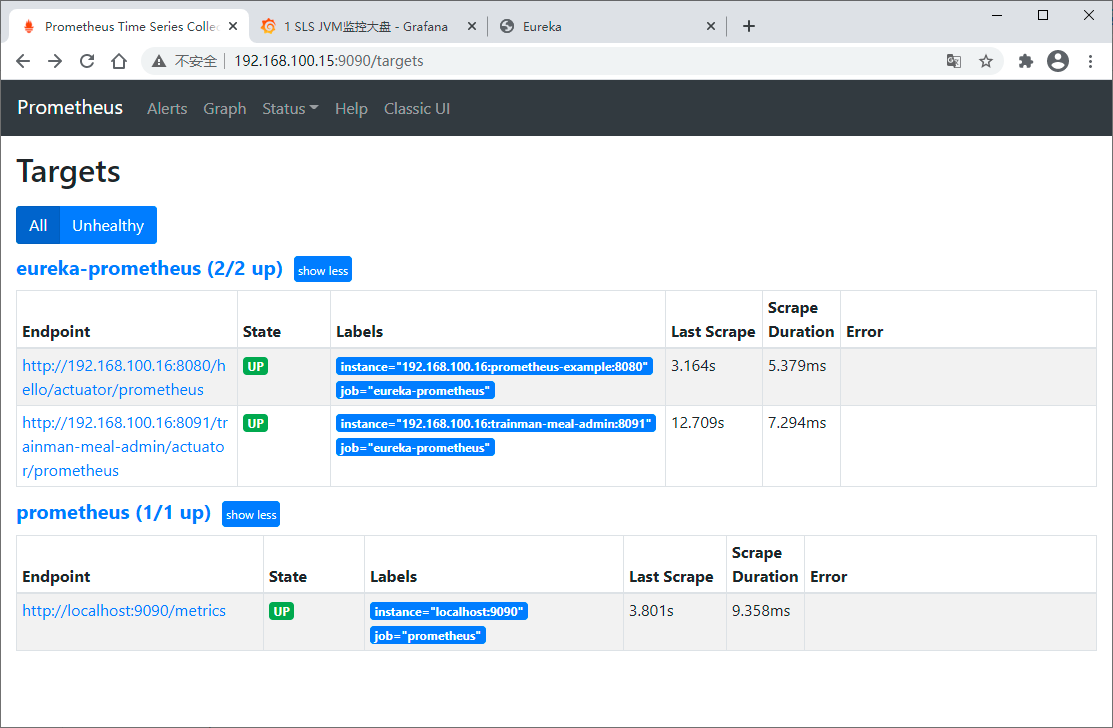
修改prometheus.yml,改为通过eureka获取抓取目标
scrape_configs:

  - job_name: 'eureka-prometheus'

    eureka_sd_configs:

      - server: http://192.168.100.93:8761/eureka

    relabel_configs:

      - source_labels: [__meta_eureka_app_instance_metadata_prometheus_path]

        action: replace

        target_label: __metrics_path__

        regex: (.+)
https://github.com/prometheus/prometheus/blob/main/documentation/examples/prometheus-eureka.yml
https://github.com/prometheus/prometheus/tree/main/documentation/examples
这里不得不提的是relabel_configs
Relabeling(重新标记)是一种强大的工具,可以在抓取目标之前动态重写目标的标签集。每个抓取配置可以配置多个重新标记步骤。 它们按照在配置文件中出现的顺序应用于每个目标的标签集。
Relabeling是在抓取(scraping)前修改target和它的labels

3. 补充:Prometheus存储
Prometheus自带一个本地磁盘时间序列数据库,但也可以选择与远程存储系统集成。
本地存储
Prometheus的本地时间序列数据库在本地存储上以定制的、高效的格式存储数据。
注意,本地存储的一个限制是它没有集群或副本。因此,在驱动器或节点中断时,它不是任意可伸缩或持久的,应该像任何其他单节点数据库一样进行管理。建议使用RAID来提高存储可用性,建议使用快照作为备份。使用适当的架构,可以在本地存储中保留多年的数据。也可以采用外部存储。
TSDB (时间序列数据库,简称时序数据库)
Prometheus具有几个用于配置本地存储的参数。 最重要的是:
- --storage.tsdb.path: Prometheus写入数据库的位置,默认是data/
- --storage.tsdb.retention.time: 什么时候删除旧数据,默认是15天
- --storage.tsdb.retention.size: 要保留的最大存储块字节数。最旧的数据将首先被删除。默认为0或禁用。这个标志是实验性的,在未来的版本中可能会改变。支持的单位:B、KB、MB、GB、TB、PB、EB。例如:“512 mb”
Prometheus平均每个样本仅存储1~2个字节.因此,要规划Prometheus服务器的容量,可以使用以下公式粗略计算:
needed_disk_space = retention_time_seconds * ingested_samples_per_second * bytes_per_sample
Prometheus通过以下三种方式与远程存储系统集成:
- Prometheus可以将其提取的样本以标准格式写入远程URL
- Prometheus可以以标准格式从其他Prometheus服务器接收样本
- Prometheus可以以标准格式从远程URL读取样本数据
Prometheus自定义指标的更多相关文章
- prometheus自定义监控指标——实战
上一节介绍了pushgateway的作用.优劣以及部署使用,本机通过几个实例来重温一下自定义监控指标是如何使用的. 一.监控容器启动时间(shell) 使用prometheus已经两个月了,但从未找到 ...
- k8s之自定义指标API部署prometheus
1.自定义指标-prometheus node_exporter是agent;PromQL相当于sql语句来查询数据; k8s-prometheus-adapter:prometheus是不能直接解析 ...
- 简单4步,利用Prometheus Operator实现自定义指标监控
本文来自Rancher Labs 在过去的文章中,我们花了相当大的篇幅来聊关于监控的话题.这是因为当你正在管理Kubernetes集群时,一切都会以极快的速度发生变化.因此有一个工具来监控集群的健康状 ...
- Kubernetes 监控:Prometheus Adpater =》自定义指标扩缩容
使用 Kubernetes 进行容器编排的主要优点之一是,它可以非常轻松地对我们的应用程序进行水平扩展.Pod 水平自动缩放(HPA)可以根据 CPU 和内存使用量来扩展应用,前面讲解的 HPA 章节 ...
- kubernetes学习笔记之十二:资源指标API及自定义指标API
第一章.前言 以前是用heapster来收集资源指标才能看,现在heapster要废弃了从1.8以后引入了资源api指标监视 资源指标:metrics-server(核心指标) 自定义指标:prome ...
- k8s-资源指标API及自定义指标API-二十三
一. 原先版本是用heapster来收集资源指标才能看,但是现在heapster要废弃了. 从k8s v1.8开始后,引入了新的功能,即把资源指标引入api: 在使用heapster时,获取资源指标是 ...
- Kubernetes 学习23 kubernetes资源指标API及自定义指标API
一.概述 1.上集中我们说到,官方文档提示说从k8s 1.11版本开始,将监控体系指标数据获取机制移向新一代的监控模型.也就意味着对于我们的k8s来讲现在应该有这样两种资源指标被使用.一种是资源指标, ...
- k8s系列---资源指标API及自定义指标API
不得不说千万不要随意更改版本,我用的1.13的版本,然后学到这一步时,还因yaml文件不同,卡住了很久,然后各种google才找到解决办法 https://www.linuxea.com/2112. ...
- AWS EC2 复制实例后,自定义指标无法显示数据
从一个实例创建了一个AMI,然后通过这个AMI创建新的EC2实例,结果发票自定义指标不会显示: 系统一直在邮件中提示: print() on closed filehandle MDATA at Cl ...
随机推荐
- CF1478-A. Nezzar and Colorful Balls
CF1478-A. Nezzar and Colorful Balls 题意: 有\(n\)个球,每个球上面都有一个数字\(a_i\),这些数字是组成的序列是非递减的.现在你要给每个球涂色,你必须保证 ...
- 一句话木马的简单例子 网站webshell & 远程连接
一 概述 本地 kail linux 目标 windows nt 服务器 二 过程 首先编写一句话木马 index.php 一句话木马的原理就是把C=xxx 字符串当成php语句执行 注意这里用 ...
- Linux 驱动框架---net驱动框架
这一篇主要是学习网络设备驱动框架性的东西具体的实例分析可以参考Linux 驱动框架---dm9000分析 .Linux 对于网络设备的驱动的定义分了四层分别是网络接口层对上是IP,ARP等网络协议,因 ...
- css position sticky All In One
css position sticky All In One css sticky & 吸顶效果 demo https://codepen.io/xgqfrms/pen/PoqyVYz ref ...
- code screenshot beautify plugin & 代码截图美化插件
code screenshot beautify plugin & 代码截图美化插件 代码截图美化 codesnap 微信分享代码截图 https://github.com/kufii/Cod ...
- cookie all in one
cookie all in one credentials: "include" https://developers.google.com/web/updates/2015/03 ...
- qt 移动窗口MoveWindow
RECT r; GetWindowRect(this->gameHwnd, &r); // 获取窗口的宽度和高度 int nWidth = r.right - r.left; int n ...
- vux使用
Vue中使用vux的配置,分为两种情况: 一.根据vux文档直接安装,无需手动配置 npm install vue-cli -g // 如果还没安装 vue init airyland/vux2 my ...
- 听说USDN最近很火,它究竟是什么?
最近USDN在各大社区沸沸扬扬,甚至很多人都说USDN将会打破稳定币市场的格局,那么USDN究竟是怎样的一种稳定币呢?小编今天就帮助大家了解一下,新一代算法型稳定币USDN. USDN是基于公链NGK ...
- 2018-1-6-IDEA快速代码生成
2018-1-6-IDEA快速代码生成 Java 自动生成 Intellij IDEA 利用IDEA编辑器的Live Templates可以实现自定义方法.属性.注释等,下面是我自己的常用模板. 属性 ...