
python的matplotlib的热门可视化动图
1.图
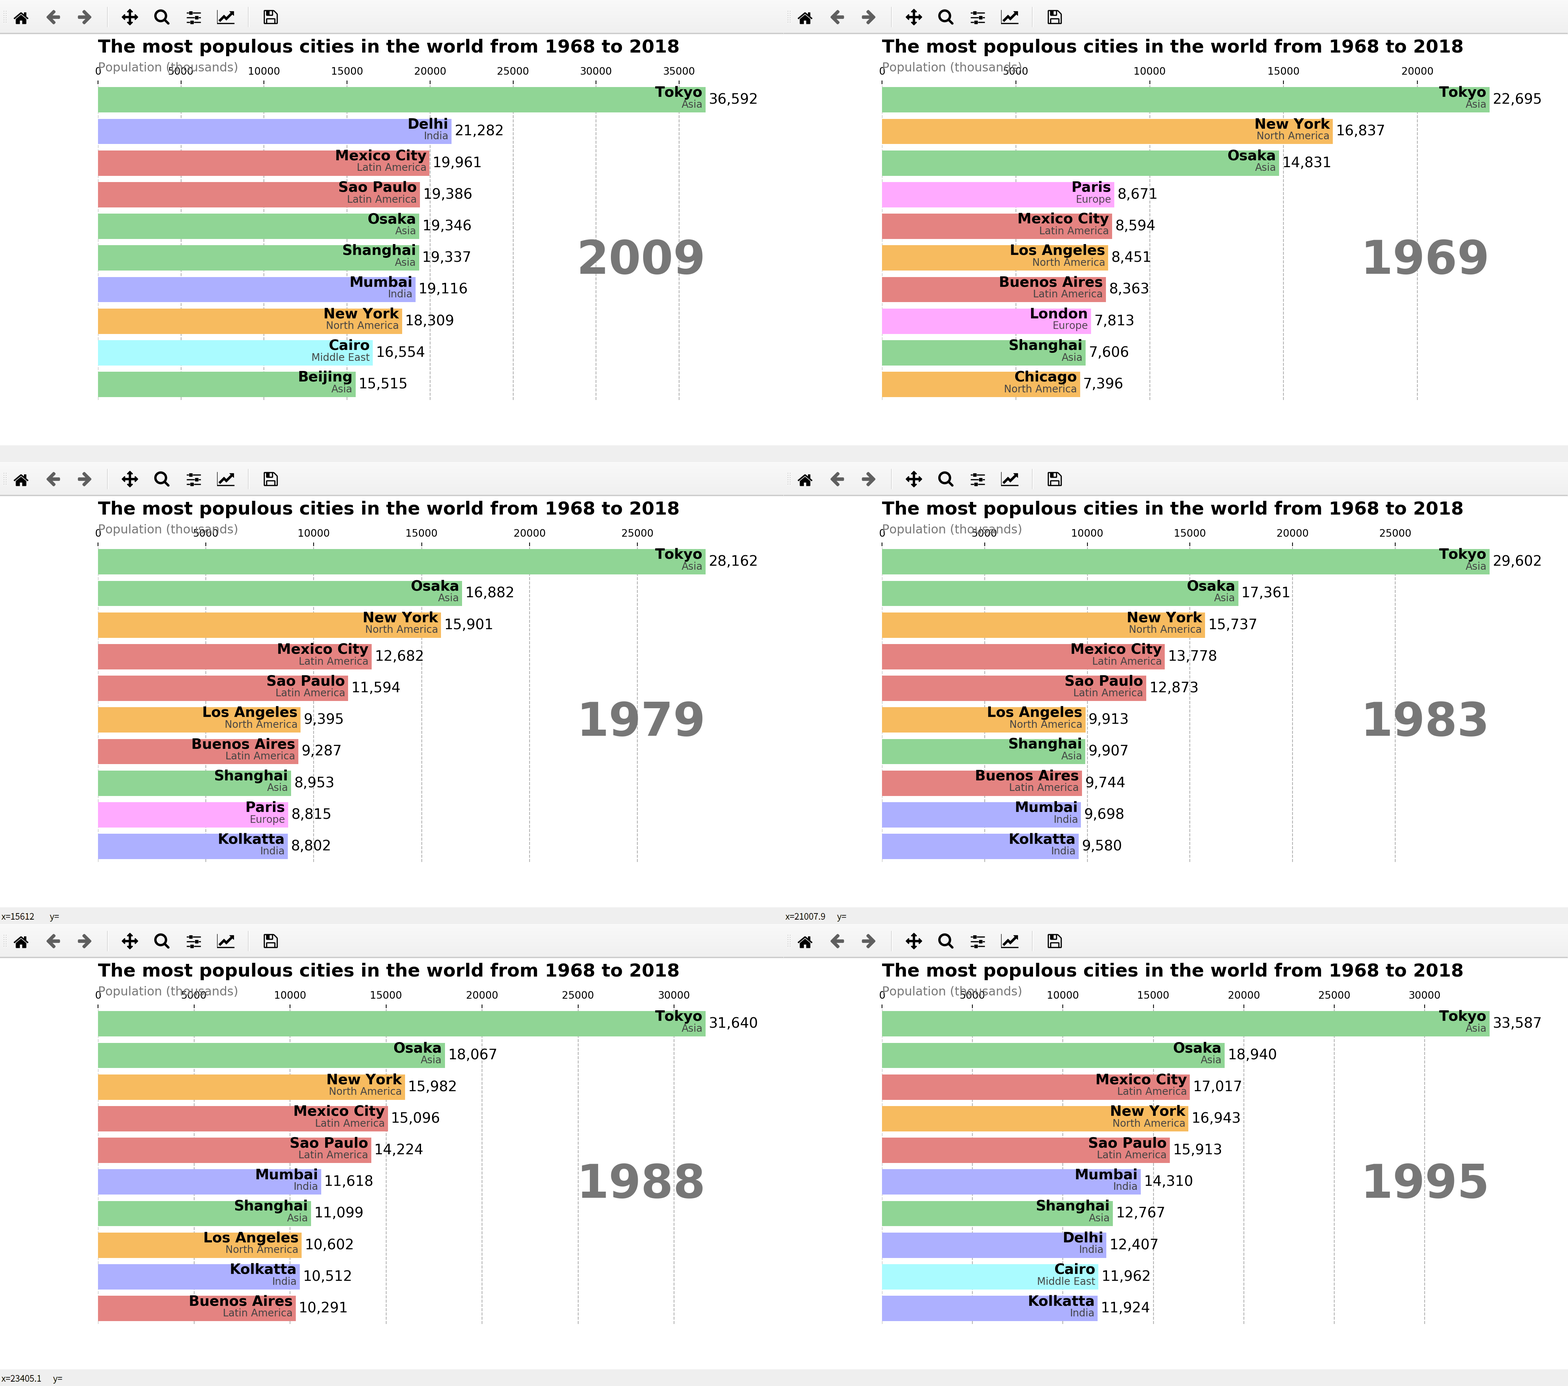
2.代码
import pandas as pd

import matplotlib as mpl

import matplotlib.pyplot as plt

import matplotlib.ticker as ticker

import matplotlib.animation as animation

#导出数据,当然这个数据也可以是直接在网上下载,是的有点慢

#网址:https://gist.githubusercontent.com/johnburnmurdoch/4199dbe55095c3e13de8d5b2e5e5307a/raw/fa018b25c24b7b5f47fd0568937ff6c04e384786/city_populations

df = pd.read_csv('city_populations.csv',

                 usecols=['name', 'group', 'year', 'value']) #将数据下载下来放在指定默认的目录和文件夹下,city_populations.csv

#定义

current_year = 2018

dff=()

fig, ax = plt.subplots(figsize=(15, 8))

colors = dict(zip(

    ['India', 'Europe', 'Asia', 'Latin America',

     'Middle East', 'North America', 'Africa'],

    ['#adb0ff', '#ffb3ff', '#90d595', '#e48381',

     '#aafbff', '#f7bb5f', '#eafb50']

))

group_lk = df.set_index('name')['group'].to_dict()

def draw_barchart(year):

    dff = df[df['year'].eq(year)].sort_values(by='value', ascending=True).tail(10)

    ax.clear() #每次清空、刷新

    ax.barh(dff['name'], dff['value'], color=[colors[group_lk[x]] for x in dff['name']])

    dx = dff['value'].max() / 200

    for i, (value, name) in enumerate(zip(dff['value'], dff['name'])):

        ax.text(value-dx, i,     name,           size=14, weight=600, ha='right', va='bottom')

        ax.text(value-dx, i-.25, group_lk[name], size=10, color='#444444', ha='right', va='baseline')

        ax.text(value+dx, i,     f'{value:,.0f}',  size=14, ha='left',  va='center')

    #显示文字,x=0,y=1.10,坐标,ha=水平对准=水平线平放

    #ax.text()格式=(x,y,string,fontsize=15,verticalalignment="top",horizontalalignment="right")

    #string=字符串='文字内容'

    ax.text(0, 1.10, 'The most populous cities in the world from 1968 to 2018',

            transform=ax.transAxes, size=18, weight=600, ha='left') #文字标题,第1层

    ax.text(0, 1.04, 'Population (thousands)', transform=ax.transAxes, size=12, color='#777777') #显示文字,第2层

    ax.text(1, 0.4, year, transform=ax.transAxes, color='#777777', size=46, ha='right', weight=800) #右边固定显示动图年份

    #va=verticalalignment="top",垂直对准

    #ha=horizontalalignment="right",alignment=对准,水平对准

    ax.xaxis.set_ticks_position('top')  #x轴在上面

    ax.set_yticks([]) #默认是显示y轴的名称,左边垂直的城市名字,设为[]就是不显示

    ax.margins(0, 0.01) #不设置就是默认值,缩放比例(0,0.05)

    ax.grid(which='major', axis='x', linestyle='--') #垂直线,布局和格式

    ax.set_axisbelow(True)  #默认是true的

    plt.box(False) #默认是True,False之后不显示黑色线框

animator = animation.FuncAnimation(fig, draw_barchart, frames=range(1968, 2019)) #以animator形式展现动画

plt.show() #以plt的形式展现图片
python的matplotlib的热门可视化动图的更多相关文章
- 手把手教你做一个python+matplotlib的炫酷的数据可视化动图
1.效果图 2.注意: 上述资料是虚拟的,为了学习制作动图,构建的. 仅供学习, 不是真实数据,请别误传. 当自己需要对真实数据进行可视化时,可进行适当修改. 3.代码: #第1步:导出模块,固定 i ...
- 基于matplotlib的数据可视化 - 热图imshow
热图: Display an image on the axes. 可以用来比较两个矩阵的相似程度 mp.imshow(z, cmap=颜色映射,origin=垂直轴向) imshow( X, cma ...
- python中matplotlib绘图封装类之折线图、条状图、圆饼图
DrawHelper.py封装类源码: import matplotlib import matplotlib.pyplot as plt import numpy as np class DrawH ...
- python下matplotlib的subplot的多图显示位置的问题
1.说明 1.1 多图: 221,222 212 ------------附最后讲解,这下更清楚了吧,取个名字:颠倒一下--- 1.2 多图 211 223,224 ------------附最后讲解 ...
- Python中matplotlib.pyplot.imshow画灰度图的多种方法
转载:https://www.jianshu.com/p/8f96318a153f matplotlib库的教程和使用方法此处就不累赘了,网上有十分多优秀的教程资源.此处直接上代码: def demo ...
- gganimate|创建可视化动图,让你的图表会说话
本文首发于“生信补给站”公众号,https://mp.weixin.qq.com/s/kKQ2670FBiDqVCMuLBL9NQ 更多关于R语言,ggplot2绘图,生信分析的内容,敬请关注小号. ...
- 利用Python生成GIF动图
一.PIL库 1.PIL库的概括: PIL(Python Image Library)是python的第三方图像处理库,但是由于其强大的功能与众多的使用人数,几乎已经被认为是python官方图像处理库 ...
- python学习之matplotlib绘制动图(FuncAnimation()参数)
1.函数FuncAnimation(fig,func,frames,init_func,interval,blit)是绘制动图的主要函数,其参数如下: a.fig 绘制动图的画布名称 b.func自定 ...
- Python数据分析matplotlib可视化之绘图
Matplotlib是一个基于python的2D画图库,能够用python脚本方便的画出折线图,直方图,功率谱图,散点图等常用图表,而且语法简单. Python中通过matplotlib模块的pypl ...
随机推荐
- openresty + lua
lua语法总结: 1. 导入模块(用require来加载,模块是一个类型为table的全局变量) 导入写好的包,举例如下: 2. lua 数据类型(有8种:nil.boolean.number.str ...
- 8.1.1 IO
IO对象无拷贝或赋值.进行IO操作的函数通常以引用的方式传递和返回流,且该引用不能是const的 确定一个流对象是否处于良好状态的最简单的方法是将它作为一个条件来使用 while (cin >& ...
- 在手机浏览器中判断App是否已安装
从网上搜到之前手机中判断App是否安装可以通过onblur事件+定时器来实现. 但现在要做这个功能时,按网上的说法已经不能实现了.因为现在浏览器中打开App,window不会触发onblur事件. 在 ...
- redis 解决秒杀
# import redis pool = redis.ConnectionPool(host = '127.0.0.1', port=6379, db=0)#创建连接池 r = redis.Redi ...
- 【转载】C/C++内存管理详解
转自:http://chenqx.github.io/2014/09/25/Cpp-Memory-Management/ 内存管理是C++最令人切齿痛恨的问题,也是C++最有争议的问题,C++高手从中 ...
- 【做题笔记】P1330 封锁阳光大学
读题易得:对于有边的两个点 \(u,v\) ,能且仅能其中一点对这条边进行封锁. 什么意思呢?假设给这张图上的点进行染色,那么对于上述的两个点 \(u,v\) ,\(u,v\) 必须异色(理解这一点很 ...
- QT+VS后中文字符乱码问题
在VS中写QT项目会出现中文乱码现象,尤其是控件的中文乱码以及qDebug()时候中文乱码通用的解决办法: 在头文件(.h)前面加上如下代码: #ifdef WIN32 #pragma executi ...
- Unity2018破解版安装教程(windows)
最近啊,在研究一些游戏的搭建与算法的创新,所以学习使用unity,下面来跟大家分享Unity2018的安装过程. 1.下载安装包(我的下载地址:链接:https://pan.baidu.com/s/1 ...
- Bugku-CTF之login3(SKCTF)(基于布尔的SQL盲注)
Day41 login3(SKCTF)
- Added non-passive event listener to a scroll-blocking 'touchmove' event. Consider marking event handler as 'passive' to make the page more responsive
Vue控制台警告: Added non-passive event listener to a scroll-blocking 'touchmove' event. Consider markin ...